
Abstract
The serotonin1A receptor belongs to the superfamily of G protein-coupled receptors (GPCRs) and is a potential drug target in neuropsychiatric disorders. The receptor has been shown to require membrane cholesterol for its organization, dynamics and function. Although recent work suggests a close interaction of cholesterol with the receptor, the structural integrity of the serotonin1A receptor in the presence of cholesterol has not been explored. In this work, we have carried out all atom molecular dynamics simulations, totaling to 3 μs, to analyze the effect of cholesterol on the structure and dynamics of the serotonin1A receptor. Our results show that the presence of physiologically relevant concentration of membrane cholesterol alters conformational dynamics of the serotonin1A receptor and, on an average lowers conformational fluctuations. Our results show that, in general, transmembrane helix VII is most affected by the absence of membrane cholesterol. These results are in overall agreement with experimental data showing enhancement of GPCR stability in the presence of membrane cholesterol. Our results constitute a molecular level understanding of GPCR-cholesterol interaction, and represent an important step in our overall understanding of GPCR function in health and disease.
Introduction
The G protein-coupled receptor (GPCR) superfamily comprises the largest and most diverse group of proteins in mammals, and is involved in information transfer (signal transduction) from outside the cell to the cellular interior (Chattopadhyay, Citation2014; Pierce et al., Citation2002, Rosenbaum et al., Citation2009). GPCRs regulate cellular responses to a variety of stimuli, and mediate multiple physiological processes. Due to this reason, GPCRs have emerged as major drug targets in all clinical areas (Heilker et al., Citation2009). It is estimated that ∼50% of clinically prescribed drugs target GPCRs (Schlyer & Horuk, Citation2006).
GPCRs are integral membrane proteins with seven transmembrane passes. A large portion of these receptors therefore remains in contact with the membrane. This raises the obvious possibility that the membrane could be an important regulator of receptor structure and function. Exploring the interaction of GPCRs with membrane lipids assumes significance in light of the fact that cells have the ability of varying the lipid composition of their membranes in response to a variety of stress and stimuli, thereby changing the environment and the activity of the receptors in their membranes. The organization and function of GPCRs have been shown to be dependent on the membrane lipid composition, specifically cholesterol (Burger et al., Citation2000; Jafurulla & Chattopadhyay, Citation2013; Oates & Watts, Citation2011; Paila & Chattopadhyay, Citation2010; Pucadyil & Chattopadhyay, Citation2006). Cholesterol is one of the important components of eukaryotic cell membranes and plays a crucial role in membrane dynamics and organization (Chaudhuri & Chattopadhyay, Citation2011; Mouritsen & Zuckermann, Citation2004; Simons & Ikonen, Citation2000). The role of membrane cholesterol in the organization and function of GPCRs represents an exciting area of research (Burger et al., Citation2000; Jafurulla & Chattopadhyay, Citation2013; Oates & Watts, Citation2011; Paila & Chattopadhyay, Citation2010; Pucadyil & Chattopadhyay, Citation2006). Nonetheless, the detailed mechanism underlying the effect of membrane cholesterol on the structure and function of GPCRs is not clear and appears to be complex (Paila & Chattopadhyay, Citation2009, Citation2010). A possible mechanism by which membrane cholesterol has been proposed to modulate GPCR organization and function is through a direct (specific) interaction, which could induce a conformational change in the receptor. A second possibility proposes an indirect way by altering the membrane physical properties. Yet another possibility could be a combination of both. An important common feature observed in recently solved high resolution crystal structures of GPCRs [such as β1-adrenergic receptor (Warne et al., Citation2011), β2-adrenergic receptor (Cherezov et al., Citation2007; Hanson et al., Citation2008), A2A adenosine receptor (Liu et al., Citation2012), and metabotropic glutamate type 1 receptor (Wu et al., Citation2014)] is the close association of cholesterol molecules with the receptor. Cholesterol binding motifs such as the cholesterol recognition/interaction amino acid consensus (CRAC) motif have been identified in GPCRs (Jafurulla et al., Citation2011), but the exact role of these motifs in preferential cholesterol binding to GPCRs is still not clear.
Molecular dynamics simulations have emerged as important tools in understanding GPCR-membrane interactions (Grossfield, Citation2011; Sengupta & Chattopadhyay, Citation2015). Previous simulations with cholesterol-rich membrane bilayers have suggested that cholesterol affects local structural properties of rhodopsin (Khelashvili et al., Citation2009) and human A2A adenosine receptor (Lyman et al., Citation2009). Recent microsecond time scale simulations of A2A adenosine receptor and the serotonin1A receptor have pointed toward a close, but highly dynamic receptor-cholesterol association (Lee & Lyman, Citation2012; Sengupta & Chattopadhyay, Citation2012). In the β2-adrenergic receptor, cholesterol has been recently shown to be implicated in decreased tryptophan side-chain dynamics leading to a conformational “lock” (Cang et al., Citation2013) and in oligomerization of the receptor (Prasanna et al., Citation2014). The presence of cholesterol in the membrane therefore appears to modulate the structural plasticity of GPCRs, although the exact role of cholesterol remains to be explored.
The serotonin1A receptor is an important member of the GPCR superfamily and is implicated in the generation and modulation of various cognitive, behavioral and developmental functions (Kalipatnapu & Chattopadhyay, Citation2007; Müller et al., Citation2007; Pucadyil et al., Citation2005). The agonists (Blier & Ward, Citation2003) and antagonists (Griebel, Citation1999) of this receptor represent major classes of molecules with potential therapeutic applications in anxiety- or stress-related disorders. As a result, the serotonin1A receptor serves as an important drug target for neuropsychiatric disorders such as anxiety and depression (Celada et al., Citation2013). In our previous work, we comprehensively demonstrated using a variety of experimental approaches that membrane cholesterol plays a crucial role in the organization, dynamics and function of the serotonin1A receptor (reviewed in Jafurulla & Chattopadhyay, Citation2013; Paila & Chattopadhyay, Citation2010; Pucadyil & Chattopadhyay, Citation2006). Although cholesterol binding “hot-spots” on the receptor surface have been identified (Jafurulla et al., Citation2011; Sengupta & Chattopadhyay, Citation2012), the effect of cholesterol binding on receptor structure and dynamics remain still unexplored.
In this work, we have carried out all atom molecular dynamics simulations to analyze the effect of cholesterol on the structure and dynamics of the serotonin1A receptor. We have simulated the serotonin1A receptor in cholesterol-rich 1-palmitoyl-2-oleoyl-sn-glycero-3-phosphocholine (POPC) membrane bilayers, chosen to mimic the natural biological environment in which the serotonin1A receptor resides. Simulations in POPC bilayers alone were carried out as a control. Our results show that the serotonin1A receptor exhibits differential dynamics in POPC/cholesterol bilayers relative to that in POPC bilayer. Specifically, we show that transmembrane helix VII has lower conformational flexibility in the presence of membrane cholesterol in the time scales of the simulations. These results are in overall agreement with experimental results which show that membrane cholesterol increases the stability of the serotonin1A receptor (Saxena & Chattopadhyay, Citation2012) and the β2-adrenergic receptor (Yao & Kobilka, Citation2005), a closely related GPCR which has a considerable sequence similarity with the serotonin1A receptor in the transmembrane region (Paila et al., Citation2011b).
Methods
System setup
All atom molecular dynamics simulations of the serotonin1A receptor were carried out with the receptor embedded in POPC and POPC/cholesterol bilayers. The concentration of cholesterol was 30 mol% in POPC/cholesterol bilayers. Two different systems were considered. In the first set, simulations were performed with a previously developed homology model of the serotonin1A receptor (Paila et al., Citation2011b). The model was chosen since it has been shown to be stable and was able to reproduce cholesterol interactions in a coarse-grain model (Sengupta & Chattopadhyay, Citation2012). An appropriate number of Cl- counter ions were added to neutralize the charge of the system. The membrane embedded receptor was simulated at two different ionic strengths (in the presence of 0.1 M NaCl and with only Cl- counter ions). These systems are referred to as model 1 (0.1 M NaCl) and model 2 (0 M NaCl) throughout the rest of the paper. In the second set, a new homology model was built based on the recent crystal structure of the serotonin1B receptor (Wang et al., Citation2013). This is referred to as model 3 and is described below. An appropriate number of Cl- counter ions were added to neutralize the charge of the system. All the systems were generated using CHARMM-GUI (Jo et al., Citation2008). A comprehensive list of all simulations performed is shown in Supplementary Table 1 (all Supplementary material available online). The residues corresponding to different regions of the receptor consisting of seven transmembrane helices (I–VII), the carboxy terminal helix VIII and seven loop regions are shown in Supplementary Table 2.
Homology model
The structure of the serotonin1A receptor was modeled based on the serotonin1B crystal structure (PDB Code: 4IAR (Wang et al., Citation2013)). The amino acid sequence of the serotonin1A receptor exhibited increased consensus with that of serotonin1B receptor (query cover: 98%, identity: 40%, E-value: 3 e-103). The cytochrome b562 insert between transmembrane helices V and VI was removed prior to building the model. To model loop 6 (intracellular loop 3), an independent BLAST search was performed. Chain A from the crystal structure of the N-terminal core of Bacillus subtilis inorganic pyrophosphatase (PDB: 1WPN, query cover: 44%, identity: 26%, E-value: 1.3) was chosen to model loop 6. Subsequently, a replica exchange molecular dynamics simulation was performed of the homology model of loop 6 in water. A large number (208) of replicas were considered spanning the temperature range from 200–580 K. Position restraints were applied on the backbone atoms of the terminal amino acid residues. Exchange time among the replicas was set to 100 ps with the acceptance ratio greater than 10%. Each replica was simulated for ∼4 ns with a total simulation time of 800 ns. The conformation with highest secondary structure similarity to previous NMR studies (Chen et al., Citation2011) was chosen for further analysis. The homology model of the serotonin1A receptor (without loop 6) generated from the crystal structure of the serotonin1B receptor and the loop 6 conformation obtained from replica exchange molecular dynamics were used as templates to generate the complete homology model of the serotonin1A receptor. EasyModeller ver 4.0 GUI package using MODELLER ver. 9.14 was used for model building. Quality check on the model assessed using ProQM server showed a global quality of 0.545 (0: worst, 1: best).
Simulation parameters
All atom molecular dynamics simulations were performed of the membrane embedded receptor. The first set of simulations (model 1 and 2) were performed using the program NAMD 2.7b1 (Kalé et al., Citation1999) with the PARAM27 version of the CHARMM force-field (MacKerell et al., Citation1998). The second set of simulations (model 3) were performed using GROMACS version 4.5.5 (Pronk et al., Citation2013). The CHARMM force-field version 36 was used for the study. The main difference between the two versions is the back-bone parameters to correct for the over stabilization of the helical stretches in the protein. The system was first minimized for 1000 steps using conjugate gradient method with the protein and lipid headgroup atoms fixed to allow reorganization of water molecules and lipid acyl chains. In the subsequent step, the temperature of the system was increased from 0–300 K for 0.5 ns, keeping the simulation box constant. During the simulation, the protein and lipid headgroup atoms were kept fixed to allow the melting of the lipid tails consistent with the liquid crystalline (fluid) phase. Subsequently, 1000 steps of minimization were carried out with all protein atoms constrained with harmonic constraints with a force constant of 1 kcal/molÅ2. This was followed by simulations for 0.5 ns with the same positional restraint on protein atoms. Finally, dynamics was performed for 0.5 ns with no positional restraint to equilibrate the system. Periodic boundary conditions were used in all three directions during the simulation. Production simulation was carried out using methodologies developed for the CHARMM 27 and CHARMM 36 parameter set, respectively. In model 3, the pressure was maintained using the Parinello-Rahman coupling scheme, such that the lateral and perpendicular pressures are coupled independently at 1 bar (compressibility 4.5 × 10⁻⁵ bar−1). The temperature of the system was maintained at 300 K through Langevin damping with a coefficient of 1 ps−1. Particle-mesh Ewald (PME) (Batcho et al., Citation2001) was used to compute the electrostatic interaction with a real space cut-off of 10 Å. We used the SHAKE algorithm to constrain all bonds involving hydrogen and consequently an integration time step of 2 fs was used. Van der Waals energies were calculated using 10 Å cut-off and pair list distance was calculated at 12 Å. Model 1 and 2 represent simulations for 250 ns and model 3 for 1 μs.
Analysis
The analysis of the results was carried out using VMD 1.8.7 (Humphrey et al., Citation1996) and GROMACS analysis tools. For the RMSD calculation, the protein structures were aligned to the first frame of the simulation in respect to the particular region for which the RMSD was being measured. RMSDs were calculated with regard to both all atoms, including side-chains (all atom) and backbone atoms only, as mentioned. RMSF was calculated from the root mean fluctuations of the Cα atoms along the trajectory.
Results and Discussion
The serotonin1A receptor exhibits differential dynamics in the presence of cholesterol
Molecular dynamics simulations were performed with membrane embedded serotonin1A receptor in POPC and POPC/cholesterol bilayers. The concentration of cholesterol was 30 mol% in POPC/cholesterol bilayers in all cases. Three systems were considered to avoid prior bias due to the homology model. The first two models were based on a previously developed homology model (Paila et al., Citation2011b), which has been shown to be stable and able to reproduce cholesterol interactions (Sengupta & Chattopadhyay, Citation2012). The equilibrated homology model of the receptor was simulated in the presence (model 1) and absence (model 2) of 0.1 M NaCl. In addition, a new homology model was developed (model 3) based on a recent crystal structure of the serotonin1B receptor (Wang et al., Citation2013).
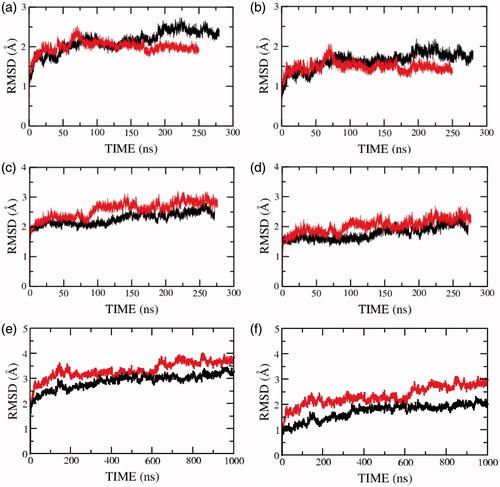
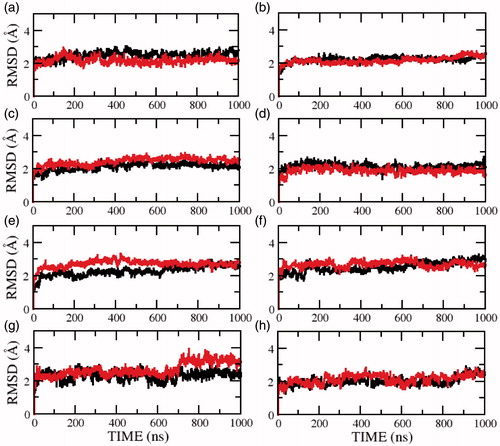
To understand the influence of the membrane lipid bilayer environment on the structure and stability of the serotonin1A receptor, we calculated the root mean square deviation (RMSD) of the serotonin1A receptor in membrane bilayers of POPC and POPC/cholesterol. shows that, on an average, the RMSD of the serotonin1A receptor in POPC bilayers is higher than that in POPC/cholesterol bilayers in the absence of salt. This is true when RMSD was calculated for all atoms (panels a, c and e) as well as backbone atoms (panels b, d and f). At longer time scales (model 3), the deviations are consistently higher in the absence of cholesterol. The same trend was also observed when only the transmembrane helices were considered (). However, the deviations along the trajectory are lower since the transmembrane helices exhibit reduced dynamics. The large jumps observed in , but not in , indicate that these correspond to structural rearrangements in the loop regions. The difference in RMSD could be indicative of the fact that the serotonin1A receptor is less flexible in the cholesterol-rich membrane bilayer in the time scales of the simulations.
Figure 1. Root mean square deviations (RMSD) of the serotonin1A receptor along the trajectory calculated for (a, c, e) all and (b, d, f) backbone atoms in POPC (red) and POPC/cholesterol (black) bilayers. Panels (a, b) represent the RMSD for model 1 (0.1 M NaCl), (c, d) for model 2 (0 M NaCl) and (e, f) for model 3 (0 M NaCl). See Methods for other details (For interpretation of the references to color in this figure legend, the reader is referred to the web version of this article).
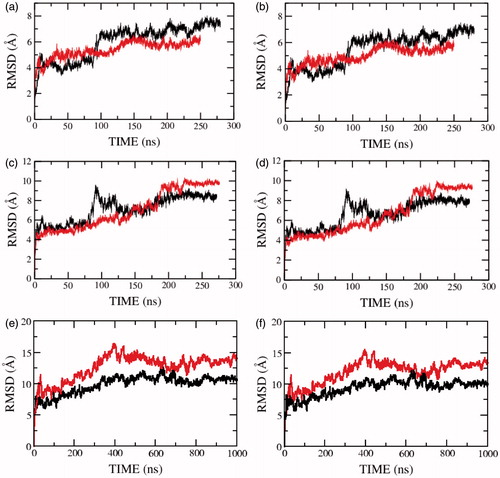
Figure 2. RMSD of the serotonin1A receptor along the trajectory calculated for (a, c, e) all and (b, d, f) backbone atoms of all transmembrane helices in POPC (red) and POPC/cholesterol (black) bilayers. Panels (a, b) represent the RMSD for model 1 (0.1 M NaCl), (c, d) for model 2 (0 M NaCl) and (e, f) for model 3 (0 M NaCl). See Methods for other details (For interpretation of the references to color in this figure legend, the reader is referred to the web version of this article).
Dynamics of individual transmembrane helices in the absence of cholesterol
To further characterize the decrease in receptor dynamics in presence of cholesterol, we analyzed the RMSD of the individual structural components of the receptor. These include the transmembrane helices I–VII, the extracellular and intracellular loops connecting the helices, and the carboxy terminal helix VIII (see Supplementary Table 2). shows the RMSD of the individual transmembrane helices I–VII and helix VIII of model 1 in presence of salt. The figure shows that transmembrane helices I–IV are more dynamic in the presence of cholesterol and transmembrane helices V–VII and helix VIII are of equal or lower flexibility in presence of cholesterol. Similarly, RMSD of the structural components in the absence of salt for model 2 and model 3 are given in and , respectively. Transmembrane helix VII on an average exhibits lower flexibility in the presence of cholesterol. The flexibility of the remaining transmembrane helices appears to fluctuate between the three models and could be sensitive to the model or simulation condition.
Figure 3. RMSD of the serotonin1A receptor in POPC (red) and POPC/cholesterol (black) bilayers in presence of NaCl (model 1) calculated for transmembrane helix (a) I, (b) II, (c) III, (d) IV, (e) V, (f) VI, (g) VII and (h) carboxy terminal helix VIII. See Methods and Supplementary Table 2 for further details (For interpretation of the references to color in this figure legend, the reader is referred to the web version of this article).
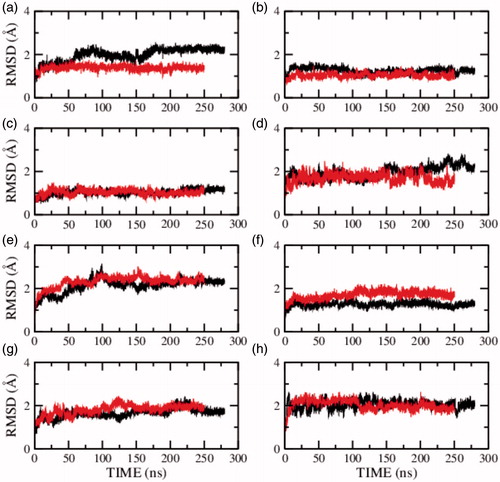
Figure 4. RMSD of the serotonin1A receptor in POPC (red) and POPC/cholesterol (black) bilayers in the absence of NaCl (model 2) calculated for transmembrane helix (a) I, (b) II, (c) III, (d) IV, (e) V, (f) VI, (g) VII and (h) carboxy terminal helix VIII. See Methods and Supplementary Table 2 for further details (For interpretation of the references to color in this figure legend, the reader is referred to the web version of this article).
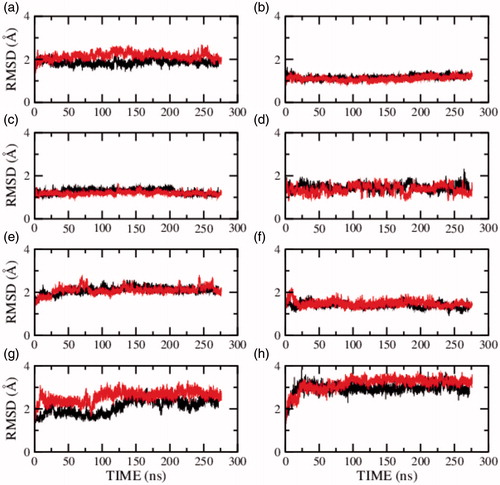
Figure 5. RMSD of the serotonin1A receptor in POPC (red) and POPC/cholesterol (black) bilayers in absence of NaCl (model 3) calculated for transmembrane helix (a) I, (b) II, (c) III, (d) IV, (e) V, (f) VI, (g) VII and (h) carboxy terminal helix VIII. See Methods and Supplementary Table 2 for further details (For interpretation of the references to color in this figure legend, the reader is referred to the web version of this article).
To characterize the fluctuations in the transmembrane helices further, the root mean square fluctuations (RMSF) of the Cα atoms were calculated along the trajectory. The RMSF of transmembrane helices I–VII and helix VIII for model 1 are shown in Supplementary Figure 1. Interestingly, the fluctuations of the Cα atoms in transmembrane helix VII (panel g) are lower in the presence of cholesterol. The same trend persists in model 2 and 3 (see Supplementary Figures 2 and 3). The fluctuations in the remaining helices appear to vary between the simulations. Taken together, it appears that transmembrane helix VII is the most sensitive to the presence of cholesterol and is highly flexible in the absence of cholesterol.
The RMSD profiles calculated for the intra- and extracellular loops in POPC and POPC/cholesterol bilayers for the three models are shown in Supplementary Figures 4-6. The trend in stability for the loop regions in the presence of cholesterol displayed considerable variation and large flexibility, irrespective of salt concentration. Relatively high dynamics was observed for loop 6 (intracellular loop 3). Interestingly, the contribution of this region to the total RMSD was highest. The RMSF of the residues in this region were also relatively high (Supplementary Figure 7).
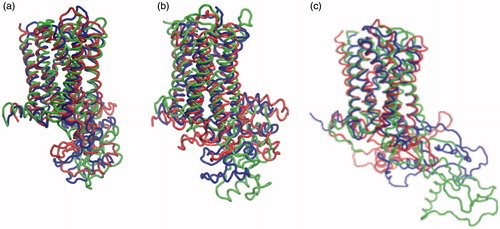
Superposition of the structures at the start and end of the simulation in POPC and POPC/cholesterol bilayers of the three models is shown in , which shows that there is no major unfolding of the transmembrane helices during the course of the simulation in POPC or POPC/cholesterol bilayers. Transmembrane helix VII appeared to show higher structural perturbation at longer time scales, but it is not clear if it is dependent on the initial homology model. Taken together, this supports the application of coarse-grain approaches, specially the MARTINI force-field, in which the transmembrane helices are constrained to their starting structures with a harmonic potential (Prasanna et al., Citation2014; Sengupta & Chattopadhyay, Citation2012). However, loop 6 (third intracellular loop) which consists of ∼120 residues (see Supplementary Table 2) is mainly unstructured (disordered) and shows considerable rearrangement. Interestingly, this is the region of GPCRs that poses considerable challenge toward crystallization efforts due to its inherent conformational flexibility. In recent crystallographic efforts, this has been addressed by stabilizing this region using monoclonal antibody, or nanobody, or replacing with lysozyme (Cherezov et al., Citation2007; Day et al., Citation2007; Rasmussen et al., Citation2011; Rosenbaum et al., Citation2007).
Figure 6. Superposition of initial and final structures of the serotonin1A receptor. The structures correspond to the starting structure (blue) and the structures after 100 ns of simulation in POPC (red) and POPC/cholesterol (green) bilayers in the three models. The structures are represented for (a) model 1, (b) model 2 and (c) model 3 (For interpretation of the references to color in this figure legend, the reader is referred to the web version of this article).
Proximity of cholesterol to the receptor
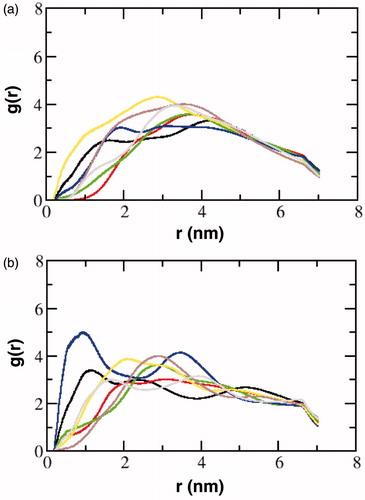
To analyze the probable occupancy sites of cholesterol around the transmembrane helices of the receptor, we calculated the radial distribution function, g(r), of cholesterol around each of the helices. As a representative example, the values for model 3 are shown in . The transmembrane helices were subdivided into two parts corresponding to the upper and lower leaflets of the membrane. In general, the first peak of g(r) is found at the closest distance for transmembrane helix I (black), indicating a close interaction of cholesterol with these helices. Additionally, high cholesterol peaks were also observed for transmembrane helices IV (blue) and V (yellow). The interaction of cholesterol in models 1 and 2 was similar (Supplementary Figure 8). Close interactions with cholesterol was observed in transmembrane helices I, IV, V and VII. However, due to the shorter time scales of the simulations, the sampling of the cholesterol was limited (see Supplementary Table 3), and it is possible that the sampling of the interaction modes was not adequate. In general, the interaction with cholesterol was stochastic in agreement with differential cholesterol association observed in coarse-grain and atomistic simulations (Sengupta & Chattopadhyay, Citation2015). Interestingly, in our previous work using coarse-grain MARTINI approach (Sengupta & Chattopadhyay, Citation2012), we showed stochastic cholesterol interactions sites, pointing toward higher occupancy of cholesterol at transmembrane helices I, V and VII.
Figure 7. The radial distribution function, g(r), of cholesterol around the transmembrane helices of the serotonin1A receptor in model 3. The transmembrane helices have been distinguished as those in the (a) extracellular leaflet and (b) intracellular leaflet. The color coding corresponds to transmembrane helix I (black), II (red), III (green), IV (blue), V (yellow), VI (brown) and VII (gray) (For interpretation of the references to color in this figure legend, the reader is referred to the web version of this article).
Lipid binding site at the groove of transmembrane helices I and VII
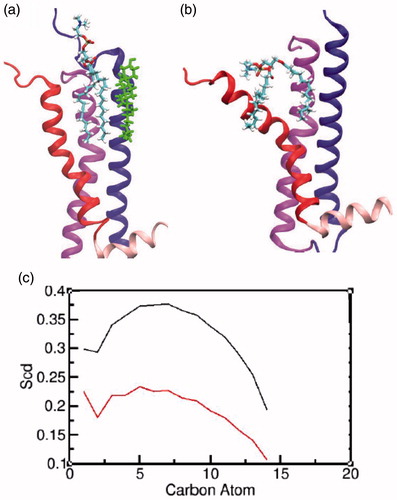
We analyzed the presence of POPC molecules at the groove of transmembrane helices I and VII, which we have earlier shown to correspond to a lipid binding site in the β2-adrenergic receptor by coarse-grain simulations (Prasanna et al., Citation2015). Interestingly, this site has also been identified as a putative lipid binding site from the crystal structure of A2 adenosine receptor (Liu et al., Citation2012). We identified a POPC molecule that was bound at the site, both in the presence and absence of cholesterol (). However, the absence of cholesterol at transmembrane helix I, in the vicinity of this lipid molecule reduces the acyl chain order of the lipid molecule at that groove (). This effect can be also visualized from the snapshots () where the POPC molecule is much more ordered in the presence of cholesterol. The increased fluctuations in the POPC molecule appear to lead to increased interactions with transmembrane helix VII and its subsequent structural deviations. The effect of cholesterol on transmembrane helix VII is therefore suggested to arise from a combination of its direct and indirect effects.
Figure 8. Characterizing the interaction of POPC at the groove of transmembrane helices I and VII: a schematic representation of a POPC molecule at the site in the (a) presence and (b) absence of cholesterol. The transmembrane helices I, II and VII and helix VIII are represented in blue, magenta, red and light pink, respectively. The cholesterol molecule is shown in green and POPC molecule is colored by atom type (carbon: cyan, phosphate: brown, hydrogen: white, nitrogen: blue and oxygen: red). (c) The order parameters calculated for the carbon atoms of the palmitoyl chain for the two POPC molecules in the presence (black) and absence (red) of cholesterol (For interpretation of the references to color in this figure legend, the reader is referred to the web version of this article).
Cholesterol-mediated effects on GPCRs are moderate but crucial
There is a lack of consensus on the mechanism of cholesterol interaction from results of previous studies on molecular dynamics simulations of rhodopsin. Cholesterol has been suggested to be mainly excluded from the receptor surface (Grossfield et al., Citation2006; Pitman et al., Citation2005), although recent data suggest the presence of high cholesterol density sites (Horn et al., Citation2014; Khelashvili et al., Citation2009). Among these reports, the only work focusing on protein structural integrity (Khelashvili et al., Citation2009) reports structural differences in the kink regions in transmembrane helices I, II and VII. However, Lyman and co-workers (Lee et al., Citation2013) analyzed the effect of cholesterol on the A2A adenosine receptor and reported a force-field-dependent dynamics of the kink regions. Another study (Shan et al., Citation2012) correlated the functionally relevant conformational flexibility of the serotonin2A receptor with the interaction of cholesterol, but it was not clear whether this conformational flexibility was cholesterol-dependent. It is therefore evident that despite several studies attempting to understand the role of cholesterol, the effect of cholesterol on the structural integrity of GPCRs in general, and the serotonin1A receptor in particular, is still not clear. Viewed from this perspective, our work constitutes one of the first attempts to monitor receptor dynamics in the presence and absence of cholesterol, and address the role of the individual structural elements. We have used two different models and two force-fields in an attempt to reduce the bias of the initial structure and force-field-related structural changes reported earlier. Our study is limited to sub-microsecond time regimes and longer time scale studies may reveal further finer differences. Although reduced dynamics is observed in POPC/cholesterol bilayers in the absence of salt, the reverse trend was observed in the presence of 0.1 M NaCl. While we propose that the differential dynamics observed in these models needs to be probed further, these results nonetheless validate the major finding that cholesterol affects receptor dynamics.
Our results assume additional significance in the context of the long time scale coarse-grain simulations that are being used to analyze receptor organization and protein-lipid interactions (Johner et al., Citation2014; Johnston et al., Citation2012; Khelashvili et al., Citation2009; Mondal et al., Citation2013; Periole et al., Citation2007, Citation2012). GPCR plasticity is important for receptor activity and signaling, and a priori, it is not clear whether a coarse-grain model would be suitable to study protein-lipid interactions. In particular, in our previous work regarding the homology model of the receptor (Paila et al., Citation2011b) and coarse-grain analysis of lipid-protein interactions (Sengupta & Chattopadhyay, Citation2012), the secondary structural elements were constrained and it was not possible to study the flexibility and dynamics of the receptor itself. The absence of large conformational changes observed in our current results, and the correspondence between cholesterol “hot-spots” between the rigid coarse-grain model and the flexible atomistic models, corroborate the use of coarse-grain models for lipid-dependent large-scale oligomerization studies.
In conclusion, our results show that the serotonin1A receptor is, on an average, less flexible in the presence of membrane cholesterol. In particular, transmembrane helix VII appears to contribute to the reduced flexibility. It is clear that these results represent only a first step toward understanding the subtle effects of cholesterol on receptor conformation. The interaction of cholesterol with GPCRs is highly plastic and differential binding modes are sampled in long time scale simulations (Sengupta & Chattopadhyay, Citation2015). It is therefore possible that the flexibility difference observed in the three models is dependent on this highly plastic and stochastic cholesterol interaction. These results support experimental data which show that membrane cholesterol is crucial in increasing serotonin1A receptor stability under conditions of thermal deactivation, extreme pH, and proteolytic digestion (Saxena & Chattopadhyay, Citation2012). In general, membrane cholesterol has been shown to be important in improving the stability of other GPCRs such as the β2-adrenergic receptor (Hanson et al., Citation2008; Yao & Kobilka, Citation2005; Zocher et al., Citation2012), and appears to be necessary in crystallization of the receptor (Cherezov et al., Citation2007). Importantly, the β2-adrenergic receptor enjoys ∼48% amino acid similarity with the serotonin1A receptor in the transmembrane region (Paila et al., Citation2011b). Such similarity in the transmembrane region could contribute to cholesterol sensitivity in the function of the β2-adrenergic receptor, similar to what was observed with the serotonin1A receptor (Jafurulla et al., Citation2014; Paila et al., Citation2008; Pucadyil & Chattopadhyay, Citation2004, Citation2007; Shrivastava et al., Citation2010). In agreement with this, we recently showed that adrenergic signaling is enhanced upon cholesterol depletion in cardiac myocytes (Paila et al., Citation2011a). Our results constitute one of the early reports on a molecular level understanding of GPCR-cholesterol interaction, and could be useful in future crystallization efforts of the serotonin1A receptor.
| Abbreviations | ||
| CRAC | = | cholesterol recognition/interaction amino acid consensus |
| GPCR | = | G protein-coupled receptor |
| RMSD | = | root mean square deviation |
| RMSF | = | root mean square fluctuation |
| POPC | = | 1-palmitoyl-2-oleoyl-sn-glycero-3-phosphocholine |
IMBC_1096971_SupplementaryMaterial.pdf
Download PDF (646 KB)Acknowledgements
This work was supported by the Council of Scientific and Industrial Research (Govt. of India) Network project BSC0115 (A.C.) and the Department of Science and Technology, Govt. of India (P.K.M.). D.S. and A.C. gratefully acknowledge the support of the Ramalingaswami Fellowship from the Department of Biotechnology, and J.C. Bose Fellowship from the Department of Science and Technology, Govt. of India, respectively. A.C. is an Adjunct Professor of Jawaharlal Nehru University (New Delhi), Indian Institute of Science Education and Research (Mohali), Indian Institute of Technology (Kanpur) and Honorary Professor of the Jawaharlal Nehru Centre for Advanced Scientific Research (Bangalore). We thank Yamuna Devi Paila for helpful discussions and G. Aditya Kumar for help in making figures. We thank members of the Chattopadhyay laboratory for their comments and discussions.
Declaration of interest
The authors report no conflicts of interest. The authors alone are responsible for the content and writing of the paper.
Related Research Data
References
- Batcho PF, Case DA, Schlick T. 2001. Optimized particle-mesh Ewald/multiple-timestep integration for molecular dynamics simulations. J Chem Phys 115:4003–4018
- Blier P, Ward NM. 2003. Is there a role for 5-HT1A agonists in the treatment of depression? Biol Psychiatry 53:193–203
- Burger K, Gimpl G, Fahrenholz F. 2000. Regulation of receptor function by cholesterol. Cell Mol Life Sci 57:1577–1592
- Cang X, Du Y, Mao Y, Wang Y, Yang H, Jiang H. 2013. Mapping the functional binding sites of cholesterol in β2-adrenergic receptor by long-time molecular dynamics simulations. J Phys Chem B 117:1085–1094
- Celada P, Bortolozzi A, Artigas F. 2013. Serotonin 5-HT1A receptors as targets for agents to treat psychiatric disorders: Rationale and current status of research. CNS Drugs 27:703–716
- Chattopadhyay A. 2014. GPCRs: Lipid-dependent membrane receptors that act as drug targets. Adv Biol 2014:143023
- Chaudhuri A, Chattopadhyay A. 2011. Transbilayer organization of membrane cholesterol at low concentrations: Implications in health and disease. Biochim Biophys Acta 1808:19–25
- Chen AS, Kim YM, Gayen S, Huang Q, Raida M, Kang C. 2011. NMR structural study of the intracellular loop 3 of the serotonin 5-HT1A receptor and its interaction with calmodulin. Biochim Biophys Acta 1808:2224–2232
- Cherezov V, Rosenbaum DM, Hanson MA, Rasmussen SGF, Thian FS, Kobilka TS, et al. 2007. High-resolution crystal structure of an engineered human β2-adrenergic G protein-coupled receptor. Science 318:1258–1265
- Day PW, Rasmussen SGF, Parnot C, Fung JJ, Masood A, Kobilka TS, et al. 2007. A monoclonal antibody for G protein-coupled receptor crystallography. Nat Methods 4:927–929
- Griebel G. 1999. 5-HT1A receptor blockers as potential drug candidates for the treatment of anxiety disorders. Drug News Perspect 12:484–490
- Grossfield A, Feller SE, Pitman MC. 2006. A role for direct interactions in the modulation of rhodopsin by omega-3 polyunsaturated lipids. Proc Natl Acad Sci USA 103:4888–4893
- Grossfield A. 2011. Recent progress in the study of G protein-coupled receptors with molecular dynamics computer simulations. Biochim Biophys Acta 1808:1868–1878
- Hanson MA, Cherezov V, Griffith MT, Roth CB, Jaakola V-P, Chien EYT, et al. 2008. A specific cholesterol binding site is established by the 2.8 Å structure of the human β2-adrenergic receptor. Structure 16:897–905
- Heilker R, Wolff M, Tautermann CS, Bieler M. 2009. G-protein-coupled receptor-focused drug discovery using a target class platform approach. Drug Discov Today 14:231–240
- Horn JN, Kao TC, Grossfield A. 2014. Coarse-grained molecular dynamics provides insight into the interactions of lipids and cholesterol with rhodopsin. Adv Exp Med Biol 796:75–94
- Humphrey W, Dalke A, Schulten K. 1996. VMD: Visual molecular dynamics. J Mol Graph 14:33–38
- Jafurulla M, Chattopadhyay A. 2013. Membrane lipids in the function of serotonin and adrenergic receptors. Curr Med Chem 20:47–55
- Jafurulla M, Rao BD, Sreedevi S, Ruysschaert J-M, Covey DF, Chattopadhyay A. 2014. Stereospecific requirement of cholesterol in the function of the serotonin1A receptor. Biochim Biophys Acta 1838:158–163
- Jafurulla M, Tiwari S, Chattopadhyay A. 2011. Identification of cholesterol recognition amino acid consensus (CRAC) motif in G-protein coupled receptors. Biochem Biophys Res Commun 404:569–573
- Jo S, Kim T, Iyer VG, Im W. 2008. CHARMM-GUI: A web-based graphical user interface for CHARMM. J Comput Chem 29:1859–1865
- Johner N, Mondal S, Morra G, Caffrey M, Weinstein H, Khelashvili G. 2014. Protein and lipid interactions driving molecular mechanisms of in meso crystallization. J Am Chem Soc 136:3271–3284
- Johnston JM, Wang H, Provasi D, Filizola M. 2012. Assessing the relative stability of dimer interfaces in G protein-coupled receptors. PLoS Comput Biol 8:e1002649
- Kalé L, Skeel R, Bhandarkar M, Brunner R, Gursoy A, Krawetz N, Phillips J, et al. 1999. NAMD2: Greater scalability for parallel molecular dynamics. J Comp Phys 151:283–312
- Kalipatnapu S, Chattopadhyay A. 2007. Membrane organization and function of the serotonin1A receptor. Cell Mol Neurobiol 27:1097–1116
- Khelashvili G, Grossfield A, Feller SE, Pitman MC, Weinstein H. 2009. Structural and dynamic effects of cholesterol at preferred sites of interaction with rhodopsin identified from microsecond length molecular dynamics simulations. Proteins 76:403–417
- Lee JY, Lyman E. 2012. Predictions for cholesterol interaction sites on the A2A adenosine receptor. J Am Chem Soc 134:16512–16515
- Lee JY, Patel R, Lyman E. 2013. Ligand-dependent cholesterol interactions with the human A2A adenosine receptor. Chem Phys Lipids 169:39–45
- Liu W, Chun E, Thompson AA, Chubukov P, Xu F, Katritch V, et al. 2012. Structural basis for allosteric regulation of GPCRs by sodium ions. Science 337:232–236
- Lyman E, Higgs C, Kim B, Lupyan D, Shelley JC, Farid R, Voth GA. 2009. Role for a specific cholesterol interaction in stabilizing the apo configuration of the human A2A adenosine receptor. Structure 17:1660–1668
- MacKerell AD JR, Bashford D, Bellott M, Dunbrack RL Jr, Evanseck JD, Field MJ, et al. 1998. All-atom empirical potential for molecular modeling and dynamics studies of proteins. J Phys Chem B 102:3586–3616
- Mondal S, Johnston JM, Wang H, Khelashvili G, Filizola M, Weinstein H. 2013. Membrane driven spatial organization of GPCRs. Sci Rep 3:2909
- Mouritsen OG, Zuckermann MJ. 2004. What’s so special about cholesterol? Lipids 39:1101–1113
- Müller CP, Carey RJ, Huston JP, De Souza Silva MA. 2007. Serotonin and psychostimulant addiction: Focus on 5-HT1A-receptors. Prog Neurobiol 81:133–178
- Oates J, Watts A. 2011. Uncovering the intimate relationship between lipids, cholesterol and GPCR activation. Curr Opin Struct Biol 21:802–807
- Paila YD, Chattopadhyay A. 2009. The function of G-protein coupled receptors and membrane cholesterol: Specific or general interaction? Glycoconj J 26:711–720
- Paila YD, Chattopadhyay A. 2010. Membrane cholesterol in the function and organization of G-protein coupled receptors. Subcell Biochem 51:439–466
- Paila YD, Jindal E, Goswami SK, Chattopadhyay A. 2011a. Cholesterol depletion enhances adrenergic signaling in cardiac myocytes. Biochim Biophys Acta 1808:461–465
- Paila YD, Murty MRVS, Vairamani M, Chattopadhyay A. 2008. Signaling by the human serotonin1A receptor is impaired in cellular model of Smith-Lemli-Opitz Syndrome. Biochim Biophys Acta 1778:1508–1516
- Paila YD, Tiwari S, Sengupta D, Chattopadhyay A. 2011b. Molecular modeling of the human serotonin1A receptor: Role of membrane cholesterol in ligand binding of the receptor. Mol Biosyst 7:224–234
- Periole X, Huber T, Marrink SJ, Sakmar TP. 2007. G protein-coupled receptors self-assemble in dynamics simulations of model bilayers. J Am Chem Soc 129:10126–10132
- Periole X, Knepp AM, Sakmar TP, Marrink SJ, Huber T. 2012. Structural determinants of the supramolecular organization of G protein-coupled receptors in bilayers. J Am Chem Soc 134:10959–10965
- Pierce KL, Premont RT, Lefkowitz RJ. 2002. Seven-transmembrane receptors. Nat Rev Mol Cell Biol 3:639–650
- Pitman MC, Grossfield A, Suits F, Feller SE. 2005. Role of cholesterol and polyunsaturated chains in lipid-protein interactions: Molecular dynamics simulation of rhodopsin in a realistic membrane environment. J Am Chem Soc 127:4576–4577
- Prasanna X, Chattopadhyay A, Sengupta D. 2014. Cholesterol modulates the dimer interface of the β2-adrenergic receptor via cholesterol occupancy sites. Biophys J 106:1290–1300
- Prasanna X, Chattopadhyay A, Sengupta D. 2015. Role of lipid-mediated effects in β2-adrenergic receptor dimerization. Adv Exp Med Biol 842:247–261
- Pronk S, Pall S, Schulz R, Larsson P, Bjelkmar P, Apostolov R, et al. 2013. GROMACS 4.5: A high-throughput and highly parallel open source molecular simulation toolkit. Bioinformatics 29:845–854
- Pucadyil TJ, Chattopadhyay A. 2004. Cholesterol modulates ligand binding and G-protein coupling to serotonin1A receptors from bovine hippocampus. Biochim Biophys Acta 1663:188–200
- Pucadyil TJ, Chattopadhyay A. 2006. Role of cholesterol in the function and organization of G-protein coupled receptors. Prog Lipid Res 45:295–333
- Pucadyil TJ, Chattopadhyay A. 2007. Cholesterol depletion induces dynamic confinement of the G-protein coupled serotonin1A receptor in the plasma membrane of living cells. Biochim Biophys Acta 1768:655–668
- Pucadyil TJ, Kalipatnapu S, Chattopadhyay A. 2005. The serotonin1A receptor: A representative member of the serotonin receptor family. Cell Mol Neurobiol 25:553–580
- Rasmussen SG, Choi H-J, Fung JJ, Pardon E, Casarosa P, Chae PS, et al. 2011. Structure of a nanobody-stabilized active state of the β2 adrenoceptor. Nature 469:175–180
- Rosenbaum DM, Cherezov V, Hanson MA, Rasmussen SGF, Thian FS, Kobilka TS, et al. 2007. GPCR engineering yields high-resolution structural insights into β2-adrenergic receptor function. Science 318:1266–1273
- Rosenbaum DM, Rasmussen SGF, Kobilka BK. 2009. The structure and function of G-protein-coupled receptors. Nature 459:356–363
- Saxena R, Chattopadhyay A. 2012. Membrane cholesterol stabilizes the human serotonin1A receptor. Biochim Biophys Acta 1818:2936–2942
- Schlyer S, Horuk R. 2006. I want a new drug: G-protein-coupled receptors in drug development. Drug Discov Today 11:481–493
- Sengupta D, Chattopadhyay A. 2012. Identification of cholesterol binding sites in the serotonin1A receptor. J Phys Chem B 116:12991–12996
- Sengupta D, Chattopadhyay A. 2015. Molecular dynamics simulations of GPCR-cholesterol interaction: An emerging paradigm. Biochim Biophys Acta 1848:1775–1782
- Shan J, Khelashvili G, Mondal S, Mehler EL, Weinstein H. 2012. Ligand-dependent conformations and dynamics of the serotonin 5-HT2A receptor determine its activation and membrane-driven oligomerization properties. PLoS Comput Biol 8:e1002473
- Shrivastava S, Pucadyil TJ, Paila YD, Ganguly S, Chattopadhyay A. 2010. Chronic cholesterol depletion using statin impairs the function and dynamics of human serotonin1A receptors. Biochemistry 49:5426–5435
- Simons K, Ikonen E. 2000. How cells handle cholesterol. Science 290:1721–1726
- Wang C, Jiang Y, Ma J, Wu H, Wacker D, Katritch V, et al. 2013. Structural basis for molecular recognition at serotonin receptors. Science 340:610–614
- Warne T, Moukhametzianov R, Baker JG, Nehmé R, Edwards PC, Leslie AGW, et al. 2011. The structural basis for agonist and partial agonist action on a β1-adrenergic receptor. Nature 469:241–244
- Wu H, Wang C, Gregory KJ, Han GW, Cho HP, Xia Y, et al. 2014. Structure of a class C GPCR metabotropic glutamate receptor 1 bound to an allosteric modulator. Science 344:58–64
- Yao Z, Kobilka B. 2005. Using synthetic lipids to stabilize purified β2 adrenoceptor in detergent micelles. Anal Biochem 343:344–346
- Zocher M, Zhang C, Rasmussen SGF, Kobilka BK, Müller DJ. 2012. Cholesterol increases kinetic, energetic, and mechanical stability of the human β2-adrenergic receptor. Proc Natl Acad Sci USA 109:E3463–3472