Abstract
In contrast to heavy alcohol consumption, which is harmful, light to moderate drinking has been linked to reduced cardiovascular morbidity and mortality. Effects on lipid status or clotting do not fully explain these benefits. Exaggerated cardiovascular responses to mental stress are detrimental to cardiovascular health. We hypothesized that habitual alcohol consumption might reduce these responses, with potential benefits. Advanced magnetic resonance techniques were used to accurately measure cardiovascular responses to an acute mental stressor (Montreal Imaging Stress Task) in 88 healthy adults (∼1:1 male:female). Salivary cortisol and task performance measures were used to assess endocrine and cognitive responses. Habitual alcohol consumption and confounding factors were assessed by questionnaire. Alcohol consumption was inversely related to responses of heart rate (HR) (r = −0.31, p = 0.01), cardiac output (CO) (r = −0.32, p = 0.01), vascular resistance (r = 0.25, p = 0.04) and mean blood pressure (r = −0.31, p = 0.01) provoked by stress, but not to stroke volume (SV), or arterial compliance changes. However, high alcohol consumers had greater cortisol stress responses, compared to moderate consumers (3.5 versus 0.7 nmol/L, p = 0.04). Cognitive measures did not differ. Findings were not explained by variations in age, sex, social class, ethnicity, physical activity, adrenocortical activity, adiposity, smoking, menstrual phase and chronic stress. Habitual alcohol consumption is associated with reduced cardiac responsiveness during mental stress, which has been linked to lower risk of hypertension and vascular disease. Consistent with established evidence, our findings suggest a mechanism by which moderate alcohol consumption might reduce cardiovascular disease, but not high consumption, where effects such as greater cortisol stress responses may negate any benefits.
Introduction
It is well established that heavy alcohol consumption is harmful to the liver, brain and cardiovascular system, leading to an estimated 2.5 million deaths per year globally (Global status report on alcohol and health, Citation2011). Nonetheless, light to moderate alcohol consumption is associated with reduced cardiovascular morbidity and mortality (Klatsky et al., Citation1990). Although this could be due to confounding factors (e.g. social class, smoking or physical activity), most studies point towards a direct positive effect of alcohol on cardiovascular health (Doll et al., Citation1994; Gronbaek et al., Citation1994; Shaper et al., Citation1988).
Several mechanisms by which alcohol may benefit cardiovascular health have been postulated. These include improved blood lipid profiles (Langer et al., Citation1992), reduced plasma fibrinogen and platelet activity (Dimmitt et al., Citation1998) as well as positive antioxidant effects (Sato et al., Citation2002). However, these factors do not fully account for the benefits of alcohol, suggesting that other mechanisms are also involved. One possibility is that chronic alcohol intake reduces the cardiovascular response to acute mental stress. As a greater blood pressure (BP) response to mental stress is associated with the earlier development of cardiovascular disease (Chida & Steptoe, Citation2010), any reduction should have beneficial effects on cardiovascular health. It is well known that acute alcohol intake reduces the cardiovascular response to mental stress (Sher et al., Citation2007; Stewart et al., Citation1992) through both sedative effects and direct modulation of the cardiovascular stress response (Moberg et al., Citation2011). However, the effects of chronic alcohol intake on stress responsiveness are less well understood. This is particularly true after blood alcohol levels have returned to normal. In animal models, it is known that prolonged alcohol intake blunts the endocrine and autonomic response to acute stress (Lee et al., Citation2000). These findings have also been demonstrated in humans with severe chronic alcohol abuse (Lovallo et al., Citation2000), although the relevance to “normal” drinking levels is unclear. Intriguingly, there is some evidence that moderate alcohol intake chronically alters autonomic nervous system function, but these findings require verification (Flanagan et al., Citation2002; Kupari et al., Citation1993). Such verification would require robust assessment of both the cardiovascular responses to mental stress and alcohol consumption.
Comprehensive assessment of the cardiovascular system is difficult during mental stress, and most studies rely on BP and HR alone. However, with the development of rapid imaging techniques, it is now possible to perform magnetic resonance (MR) scanning of the cardiovascular system (CMR) during acute mental stress (Jones et al., Citation2011). This approach allows simultaneous measurements of BP and aortic flow, as well as subsequent calculation of total peripheral resistance (TPR) and total arterial compliance (TAC). The accuracy and reliability of CMR allow associations between the cardiovascular stress response and other factors to be assessed in small populations. For example, excess adiposity was shown recently to be associated with blunted mental stress responses in a small population, using the same techniques (Jones et al., Citation2012). Thus, CMR provides a valuable method for evaluating possible links between alcohol consumption and the cardiovascular stress response.
We hypothesized that alcohol has a persistent effect on stress responsiveness that partly accounts for its known cardiovascular health benefits. The aim of this study was to test our hypothesis by combining rapid CMR imaging with questionnaire-based assessments of alcohol consumption and other confounders.
Methods
We studied healthy men (N = 43) and women (N = 45) recruited from a single primary care research practice (Chorleywood Health Centre, Hertfordshire, UK). Electronic patient records and disease registers were used to select healthy men and women aged between 18 and 45 years (median age 38 years), who were free of chronic disease and did not use regular medication. Participants with contraindications for MR imaging were excluded. The Great Ormond Street Hospital/Institute of Child Health Research Ethics Committee approved the study, which conforms to the ethical guidelines of the 1975 Declaration of Helsinki and all participants gave written informed consent.
Questionnaires
We used a questionnaire to assess alcohol consumption using an approach that has been shown to be highly reproducible and correlate well with extensive diaries of alcohol intake (Giovannucci et al., Citation1991). This approach consisted of dividing alcohol use into five specific drink categories: (1) low alcohol (not alcohol-free) beer, lager or cider; (2) beer, stout, lager or cider; (3) low alcohol wine; (4) wine, sherry or vermouth; (5) spirits or liqueurs. Firstly, for each type of drink, typical frequency of consumption was recorded as: (i) never; (ii) every 2–3 months; (iii) once a month; (iv) once a fortnight; (v) 1–2 times per week; (vi) 3–6 times per week; (vii) every day or (viii) more than once per day (number recorded) and then converted to a frequency per day (using the midpoint of ranges where necessary). Secondly, participants estimated the quantity of each type of drink they would usually consume per drinking session. This was recorded in pints, standard glasses or standard measures, including fractions of these amounts. These measures were converted to standard UK alcohol units using the following scale: 2 units per pint of beer, stout, lager or cider; 2 units per standard glass of wine, sherry or vermouth and 1 unit per measure of spirits or liqueurs. Low alcohol alternatives were assumed to have half the alcohol content of normal drinks. A single UK unit of alcohol is equivalent to 10 mL or 7.9 g of alcohol and is 0.56 of a USA “standard drink”. For each drink category, the product of the frequency per day and the number of units drunk yielded a measure of average alcohol consumption per drink type. Total alcohol consumption for each participant was estimated by summing estimated alcohol unit consumption for all drink types. All participants also completed questionnaires on their social class (Baecke et al., 1982; The National Statistics Socio-economic Classification Citation2012), ethnicity, education, physical activity level, menstrual history (in women) and tobacco consumption. Stress exposure in the preceding month was assessed with the Perceived Stress Scale (PSS) (Cohen et al., Citation1983).
CMR during mental stress
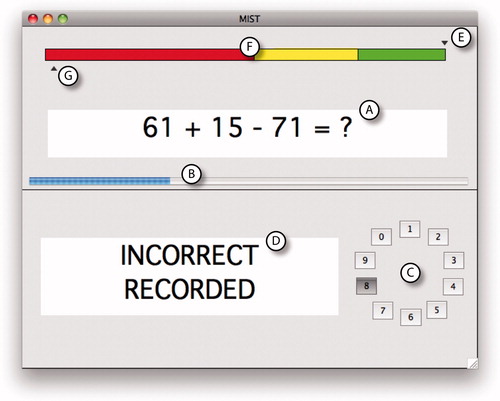
All imaging was performed using a 1.5T MR scanner (Avanto, Siemens Medical Solutions, Erlangen, Germany). We used the Montreal Imaging Stress Task (MIST) to induce acute mental stress. This task was specifically designed for use during MR imaging. It has been described in detail previously and shown to stimulate cardiovascular and endocrine responses reliably (Jones et al., Citation2011). Briefly, participants used button presses to answer a series of mental arithmetic problems presented on a computer screen (). Both their performance and a purportedly “average performance” were displayed continuously. They were asked to compare their performance with this “average performance”, which was actually computer generated and programmed to finish with a high percentage of correct answers. Furthermore, question difficulty and question rate were adjusted continuously according to the participant’s performance to ensure that all subjects finished with similarly poor results. Participants had been told that they should match the “average performance”, and thus their artificially poor results led to negative social evaluation. This form of social stress has been shown to produce a robust stress response (Dickerson & Kemeny, Citation2004).
Figure 1. A screenshot of the MIST, showing (A) an example mathematical problem, (B) a blue timer bar advancing from left to right, (C) a rotary dial for selecting answers (0–9) and (D) a feedback box stating that the answer was “Incorrect”. The “average performance” indicator (E) is above the colored bar (F) and in the green zone, suggesting a good performance and the participant’s own indicator (G) is below the bar in the red zone, suggesting a poor performance.
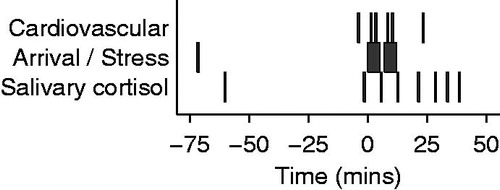
The stress protocol () consisted of a rest period (prior to commencement of the MIST), and two 5 min stress periods during which participants were asked to perform the MIST. The two stress periods were separated by a 2 min interval. During this time, the investigator told participants that they were performing poorly in order to increase social evaluative threat. During a recovery period that followed the second stress period, all participants were informed that their poor performance was artificial and that their data was useful. Aortic flow was measured using phase contrast MR on six occasions (): once at rest, then four times during stress (1 and 3 min into each consecutive stress period) and finally once during a recovery period (approximately 25 min after stress began). In addition, oscillometric BP was measured in the non-dominant arm at 1 min intervals. During the recovery period, body fat was quantified using -IDEAL MR (Kowalik et al., Citation2011; Yu et al., Citation2007).
Figure 2. Median timing of cardiovascular and endocrine measures, relative to onset of stress. The middle row shows the two 5 min periods of stress and the arrival time. Above this, the time of the cardiovascular measures, each lasting less than 5 s, are shown. There were two measures during each stress period, one at rest, just prior to stress, and one during recovery. The timing of salivary cortisol measures is shown on the bottom row.
MR flow quantification
Flow quantification was performed in the ascending aorta as it passes the bifurcation of the pulmonary arteries using an ECG-gated spiral phase-contrast MR sequence, as described previously (Steeden et al., Citation2011). This technique allows images to be acquired within a short breath-hold (∼5 s) with a spatial resolution of 1.6 × 1.6 mm and a temporal resolution of 30 ms.
All images were processed using in-house plug-ins for the open-source software OsiriX (OsiriX Foundation, Geneva, Switzerland). Flow images were manually segmented (using the modulus images) and SV and CO were measured. TPR (in mmHg/L/min, also known as WU) was calculated by dividing the mean BP (MBP) by CO. TAC was calculated by optimization of a two-element windkessel model, as described previously (Stergiopulos et al., Citation1994).
MR fat quantification
As body fat is an important confounder, it was quantified accurately using a -IDEAL sequence (Kowalik et al., Citation2011; Yu et al., Citation2007). Data were acquired in a continuous stack of 10 mm thick slices from the neck to the knees with a spatial resolution of 3 × 3 mm. To prevent motion artifact, we used breath holding for the thorax and abdomen and cardiac gating for slices containing the heart. Image processing was performed as described previously (Jones et al., Citation2012).
Salivary cortisol
Using established protocols, eight saliva samples were obtained during the course of the experiment (Salivette® Cortisol – Sarstedt, Nümbrecht, Germany): at median times of −60 (arrival), −2, 5, 12, 21, 28, 33 and 38 min relative to the onset of the first stress period (). Concentration of salivary free cortisol was measured using a commercially available chemiluminescence immunoassay (IBL, Hamburg, Germany). Participants were asked to abstain from caffeine or alcohol consumption for 24 h prior to the study and from eating food in the 2 h prior to arrival.
Cognitive performance
We used the number of questions attempted, the number answered correctly and the mean time taken to answer questions to assess cognitive performance during the stress task.
Statistical methods
Analyses were carried out using Stata 11 (StataCorp, College Station, TX). If necessary, variables were log transformed prior to parametric testing. Excess alcohol consumption was defined according to UK standards as more than 2 units per day for women and more than 3 units per day for men. Associations of excess alcohol consumption with potential confounders were assessed with logistic regression. To simplify presentation of associations between alcohol consumption and endocrine or cardiovascular parameters, alcohol consumption was divided into three groups (<1.5 units, 1.5–3 unit and >3 units). For cardiovascular measures, the mean difference between rest and stress across the four measurement occasions was used as a measure of stress response. This was done to simplify presentation of the data, as associations with stress response measures for each occasion were similar. For cardiovascular data, associations were found to be linear and are presented as correlation coefficients. SV, CO, TPR and TAC were indexed to body surface area (SVi, COi, TPRi and TACi), according to standard practice, to avoid confounding effects of body size. A repeated measures approach was used to test the difference between alcohol consumption groups and cortisol responses to stress, as groups differed in a non-linear manner. Thus, differences in cortisol measures with respect to the initial resting value were tested using random effects least squares regression. Age, sex, time of day and menstrual cycle phase (in women) (Hastrup & Light, Citation1984) are known to affect the magnitude of cardiovascular and endocrine responses to stress. Therefore, linear relationships between variables, expressed as partial correlations, were adjusted for these factors. To test the possibility that other confounders might explain associations between alcohol consumption and cardiovascular function, further adjustment was made for smoking, social class, ethnicity, education, physical activity, body fat percentage, past stress exposure and cortisol level at rest and cortisol increment in response to stress. To test for the possibility of a J-shaped relationship between alcohol consumption and outcome variables, all the above models were repeated with additional quadratic terms for alcohol consumption.
Results
Participant characteristics
Participants were predominantly white European, well-educated non-smokers (). Median alcohol consumption () was less in women (1.0 unit per day) than in men (2.0 units per day). Seven (16%) women and one (2%) man were non-drinkers. Seven (16%) women and 16 (37%) men were drinking more alcohol than UK recommendations. Excess alcohol consumption was associated with being male and with reduced physical activity levels but not with other participant characteristics. Importantly, there was no relationship between alcohol consumption and chronic stress exposure (PSS).
Figure 3. Box and whisker plots of alcohol consumption in standardized units (U) in men and women according to alcohol consumption groups. Boxes show interquartile ranges with median values indicated by horizontal lines and whiskers show ranges. The number of participants in the groups is given above each box. Note that the range includes zero for the low alcohol consumption groups of both sexes, indicating some non-drinkers in both groups.
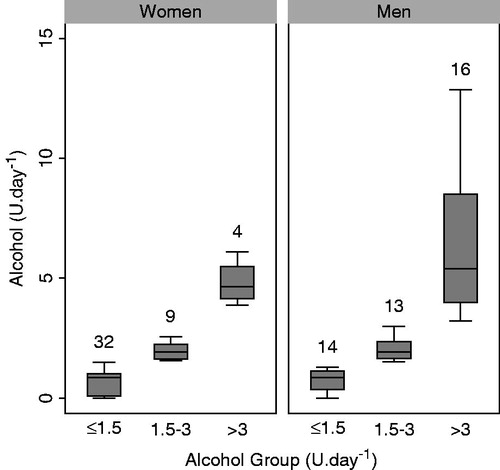
Table 1. Participant characteristics.
Responses to the MIST
During the MIST, participants achieved a median of 48% (IQR 45–49%) correct answers, but the number of questions answered (21–70) and the number answered correctly (3–35) varied widely, showing that the MIST successfully calibrated apparent performance for a wide variation in ability. The MIST provoked a strong cardiovascular response () characterized by increased HR, BP, SVi and COi, and decreased TPRi and TACi. The MIST also caused a significant salivary cortisol increase; peaking 28 min after stress began (). Cardiovascular responses were correlated with cortisol responses for HR (r = 0.33, p = 0.002), COi (r = 0.35, p = 0.001) and systolic BP (r = 0.26, p = 0.02) but not for SVi (r = 0.17, p = 0.13), TPRi (r = −0.20, p = 0.07), TACi (r = −0.21, p = 0.05), MBP (r = 0.06, p = 0.57) or diastolic BP (r = −0.00, p = 0.98).
Figure 4. Mean (±SE) cardiovascular responses to stress according to alcohol consumption group (standardized units per day). All parameters are indexed to body surface area except HR and blood pressure. *Recovery. Differences between rest and stress, but not absolute levels at rest or during stress, were statistically significant where indicated: †r = −0.31, p = 0.01; ‡r = −0.32, p = 0.01; §r = 0.25, p = 0.04; #r = −0.31, p = 0.01 (for continuous linear associations). Overlapping error bars are not displayed for clarity.
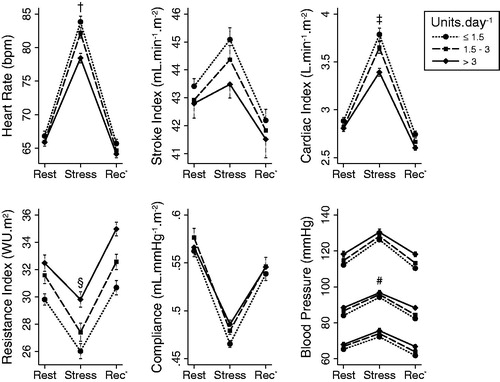
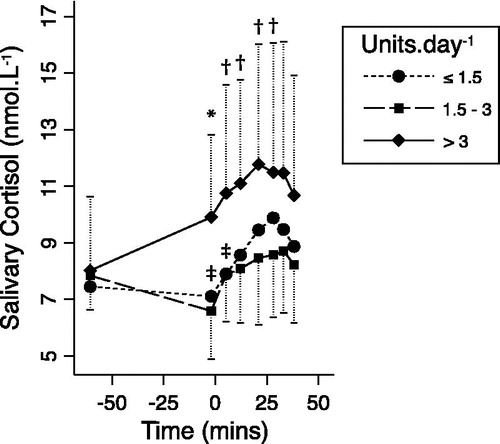
Figure 5. Geometric mean (±geometric SD) salivary cortisol responses to stress according to the alcohol consumption group (standardized units per day). *p = 0.005, †p < 0.05 for random-effects generalized least squares comparisons of the changes with respect to initial values, between the high and moderate consumption groups. ‡p < 0.05 for similar comparisons between the low and moderate consumption groups. Overlapping error bars are not displayed for clarity.
Associations of mental stress responses with alcohol consumption
At baseline, there was no relationship between alcohol consumption and any of the resting cardiovascular parameters () or with resting cortisol (r = −0.05, p = 0.70). Similarly, alcohol consumption was not associated with cardiovascular parameters during stress (). However, alcohol consumption was inversely related to the increases in HR, COi and MBP and the decrease in TPRi provoked by stress (). These associations were unaltered or strengthened after further adjustment for possible confounders, suggesting that they are not explained by variations in age, sex, social class, ethnicity, physical activity, adrenocortical activity, adiposity, smoking and PSS. These results are also present when participants were divided into low, moderate and high alcohol intake groups ().
Table 2. Partial correlations of alcohol consumption (log units per day) with cardiac parameters at rest and with their responses to stress.
Alcohol consumption was not associated with cognitive performance during stress (number of questions answered: r = −0.15, p = 0.27; number answered correctly: r = −0.12, p = 0.36; mean time to answer: r = 0.08, p = 0.58).
There was no linear relationship between alcohol consumption and either resting cortisol levels or change in cortisol during stress. However, the high alcohol consumption group ( > 3 units per day) had significantly greater increases in cortisol levels up to the peak response (), compared to the moderate (1.5–3 units per day) consumption group (3.5 versus 0.7 nmol/L at the peak, p = 0.04). The low-consumption group (<1.5 units per day) differed marginally from the moderate consumption group only in the early part of the cortisol response curve and not for the peak.
Quadratic terms for alcohol consumption were not significant in any of the baseline or stress analyses and their addition did not significantly alter the linear relationships. Therefore, there was no evidence in our data of a J-shaped relationship between alcohol consumption and cardiovascular or cognitive responses to stress.
Discussion
We found that greater habitual alcohol consumption is associated with reduced cardiovascular responses to acute mental stress. We also found that moderate consumption of alcohol is associated with lower endocrine responses to stress, compared to low or high consumption of alcohol. It has been speculated that reduced stress responses might offer an explanation for the known cardiovascular health benefits of moderate alcohol consumption (Fagrell et al., Citation1999). Our findings offer support for such speculation. Furthermore, our finding of an exaggerated cortisol response to stress in the high alcohol consumption group offers a possible new detrimental effect of excessive alcohol intake. Importantly, we found no associations between chronic alcohol consumption and cognitive responses to stress, implying that the effect is not due to differences in the cognitive processing of the stressor. This is in contrast to acute alcohol consumption, which appears to have more generalized effects on stress response physiology (Sher et al., Citation2007; Stewart et al., Citation1992).
Using CMR, we were also able to show that the reduced BP response seen with increasing alcohol consumption was due to lower COi augmentation and was partially offset by a reduced TPRi response. Furthermore, we showed that the reduced COi response was driven by a reduced HR response rather than reduced SVi response. This suggests chronic alcohol intake may have a greater effect on autonomic control of chronotropy than on inotropy and that its effects in the peripheral vasculature are mediated by the control of resistance vessels rather than large vessel vascular tone.
In a recent meta-analysis, the cardiovascular response to mental stress was linked to increased risk of cardiovascular disease (Chida & Steptoe, Citation2010), including hypertension, stroke and myocardial infarction. Our finding that alcohol consumption is associated with lower stress responsiveness suggests that alcohol could offer some protection against these conditions. Of course, excessive alcohol consumption is associated with several cardiovascular risk factors, such as increased BP and obesity (Fagrell et al., Citation1999). Thus, any potential protective effects suggested by our findings are likely to be overwhelmed at higher levels of consumption by deleterious effects of alcohol on the cardiovascular system. This is concordant with epidemiological evidence of a J-shaped relationship between alcohol consumption and cardiovascular mortality (Klatsky, Citation1994). Our finding of greater cortisol stress responses in the high alcohol consumption group offers a further possible mechanism to underpin these observations. However, we found no evidence of a J-shaped relationship between alcohol consumption and variations in cardiovascular responses, suggesting that this specific effect of alcohol is continuous.
The biological mechanism by which chronic alcohol consumption might reduce cardiovascular responses to mental stress is not yet determined. There is some evidence that chronic alcohol intake is associated with autonomic dysfunction, possibly secondary to alcohol neuropathy (Malpas et al., Citation1991; Ryan & Howes, Citation2002). Of course, autonomic dysfunction due to neuropathy is usually associated with liver disease in heavy drinkers and therefore does not apply to our population. Nevertheless, even in moderate drinkers there is some evidence that parasympathetic activity is increased and sympathetic activity is reduced (Flanagan et al., Citation2002). Furthermore, there is evidence that chronic alcohol ingestion in rats alters cardiac sympathetic nervous system signalling (Koga et al., Citation1993). Thus, we believe that altered autonomic function is the most likely mechanism by which habitual alcohol intake might reduce the stress response. However, the cardiovascular measures collected in this study cannot precisely determine the specific parts of the autonomic nervous system involved. Heart rate variability (HRV) measures might offer a means to do this, but cannot be applied easily in an MR environment, due to the loss of accurate ECG data during scanning. Interpretation of HRV measures also remains controversial (Parati et al., Citation2006). Once these limitations are overcome, future studies of the effects of alcohol on stress responses may benefit from measuring HRV to study the specific roles of the sympathetic and parasympathetic nervous systems. Our findings might also be explained by unknown factors that could affect both alcohol consumption and autonomic function. Level of response to alcohol and craving for alcohol vary according to differences in genes that are active in the central nervous system, including genes encoding gamma-aminobutyric-acid (GABA), glutamate, nicotinic and dopamine receptors (Agrawal et al., Citation2013; Schuckit, Citation2009). Such genetic differences could also lead to differences in the stress response. This possibility requires further exploration in future studies that include comprehensive genotyping.
One important aspect of this study was control for confounding factors. It has been suggested that obesity may result from excessive alcohol consumption (Yeomans, Citation2010) and obesity has also been linked with lower cardiovascular responses to stress (Carroll et al., Citation2008; Jones et al., Citation2012). Therefore, we assessed body fat content accurately using advanced MR techniques and demonstrated that our findings did not depend on this potential mechanism. In fact, our findings were also independent of a wide range of potential confounders, including age, sex, social class, ethnicity, physical activity and smoking.
Limitations
In this cross-sectional study, causal relationships between alcohol and stress responsiveness cannot be determined. In rodents, there is evidence that repeated stress exposure leads to increased alcohol consumption (Caldwell & Riccio, Citation2010). There is also some evidence of this effect in humans (Mehlum, Citation1999). Therefore, it is possible that our findings could be explained by greater stress exposure, leading to both increased alcohol consumption and down-regulation of subsequent cardiovascular stress responses. However, we found no evidence of differences in alcohol consumption according to our measure of chronic stress exposure (PSS). Although we found no evidence of a J-shaped relationship between cardiovascular stress responsiveness and alcohol consumption, the number of participants (particularly women) in our study who consumed very high levels of alcohol was small. This may have limited our ability to demonstrate a reversal of the relationship between alcohol and stress responsiveness at high levels of consumption. Thus, we are unable to determine whether the relationship between alcohol and cardiovascular stress responsiveness reverses in subjects with established alcohol use disorders, or if the explanation for detrimental cardiovascular risk in alcoholics lies in disorders of other physiological systems. Support for the latter possibility comes from our finding of exaggerated endocrine stress responses in high alcohol consumers. Prospective longitudinal studies are required to establish the direction of the association between alcohol and stress responsiveness. Future studies might also address the relative importance of this effect in comparison to the effects of alcohol on lipid status (Langer et al., Citation1992) and coagulation (Dimmitt et al., Citation1998). In this protocol, the MIST was used as a generalized stressor and compared to a rest period. We did not attempt to differentiate the effects of components of the stressor using a ‘no stress’ control period, where mental arithmetic was completed without social evaluation.
Our study used a single questionnaire measurement of alcohol consumption. This approach has been shown to be highly reproducible and results correlate strongly with more extensive diaries of alcohol intake (Giovannucci et al., Citation1991). Both methods may underestimate high levels of alcohol consumption due to a presumed tendency of participants to under-report drinking that might be deemed socially unacceptable (Giovannucci et al., Citation1991). However, as there is no suitable objective measure, the extent of this problem is unknown and would only act to weaken our reported associations. Subjects were asked to refrain from alcohol consumption within 24 h of the experiment and, therefore, had no blood alcohol. However, it is possible that variations in the timing of last alcohol consumption influenced our findings. Testing this possibility in future studies would require more detailed diaries of alcohol use or blood alcohol assays.
Conclusions
This study provides the first evidence of a novel mechanism for the known cardiovascular risk benefits of light to moderate alcohol consumption. Healthy adults who routinely drank more alcohol had lower HR, COi, TPRi and BP responses to a standardized stress task and moderate alcohol consumption was linked to lower cortisol responses. These findings were robust to adjustment for a range of confounders. Given that greater BP responses to stress are associated with later cardiovascular disease, reduced stress responsiveness may partly account for the lower cardiovascular mortality reported in light to moderate drinkers.
Declaration of interest
This work was supported by a National Institute for Health Research (NIHR) Biomedical Research Centre grant (AJ [09CC04]). JD is funded by a British Heart Foundation (BHF) Chair of Cardiology. AMT is funded by an NIHR Senior Research Fellowship & The Fondation Leducq. VM is funded by a BHF Intermediate Fellowship. There are no conflicts of interest. The authors alone are responsible for the writing and content of this paper.
Acknowledgements
We are very grateful to the doctors, nurses and staff at Chorleywood Health Centre and the radiographers at Great Ormond Street Hospital for their help with this study and to the participants for giving generously their time.
Related Research Data
References
- Agrawal A, Wetherill L, Bucholz KK, Kramer J, Kuperman S, Lynskey MT, Nurnberger JI Jr, et al. (2013). Genetic influences on craving for alcohol. Addict Behav 38(2):1501--8
- Baecke JA, Burema J, Frijters JE. (1982). A short questionnaire for the measurement of habitual physical activity in epidemiological studies. Am J Clin Nutr 36(5):936–42
- Caldwell EE, Riccio DC. (2010). Alcohol self-administration in rats: modulation by temporal parameters related to repeated mild social defeat stress. Alcohol 44(3):265–74
- Carroll D, Phillips AC, Der G. (2008). Body mass index, abdominal adiposity, obesity, and cardiovascular reactions to psychological stress in a large community sample. Psychosom Med 70(6):653–60
- Chida Y, Steptoe A. (2010). Greater cardiovascular responses to laboratory mental stress are associated with poor subsequent cardiovascular risk status: a meta-analysis of prospective evidence. Hypertension 55(4):1026–32
- Cohen S, Kamarck T, Mermelstein R. (1983). A global measure of perceived stress. J Health Soc Behav 24:385–96
- Dickerson SS, Kemeny ME. (2004). Acute stressors and cortisol responses: a theoretical integration and synthesis of laboratory research. Psychol Bull 130(3):355–91
- Dimmitt SB, Rakic V, Puddey IB, Baker R, Oostryck R, Adams MJ, Chesterman CN, et al. (1998). The effects of alcohol on coagulation and fibrinolytic factors: a controlled trial. Blood Coagul Fibrinolysis 9(1):39–45
- Doll R, Peto R, Hall E, Wheatley K, Gray R. (1994). Mortality in relation to consumption of alcohol: 13 years' observations on male British doctors. BMJ 309(6959):911–18
- Fagrell B, De Faire U, Bondy S, Criqui M, Gaziano M, Gronbaek M, Jackson R, et al. (1999). The effects of light to moderate drinking on cardiovascular diseases. J Intern Med 246(4):331–40
- Flanagan DE, Pratt E, Murphy J, Vaile JC, Petley GW, Godsland IF, Kerr D. (2002). Alcohol consumption alters insulin secretion and cardiac autonomic activity. Eur J Clin Invest 32(3):187–92
- Giovannucci E, Colditz G, Stampfer MJ, Rimm EB, Litin L, Sampson L, Willett WC. (1991). The assessment of alcohol consumption by a simple self-administered questionnaire. Am J Epidemiol 133(8):810–17
- Global status report on alcohol and health. (2011). Geneva: World Health Organization, available at http://www.who.int/substance_abuse/publications/global_alcohol_report/msbgsruprofiles.pdf (accessed 1 October 2012)
- Gronbaek M, Deis A, Sorensen TI, Becker U, Borch-Johnsen K, Muller C, Schnohr P, Jensen G. (1994). Influence of sex, age, body mass index, and smoking on alcohol intake and mortality. BMJ 308(6924):302–6
- Hastrup JL, Light KC. (1984). Sex differences in cardiovascular stress responses: modulation as a function of menstrual cycle phases. J Psychosom Res 28(6):475–83
- Jones A, McMillan MR, Jones RW, Kowalik GT, Steeden JA, Deanfield JE, Pruessner JC, et al. (2012). Adiposity is associated with blunted cardiovascular, neuroendocrine and cognitive responses to acute mental stress. PLoS One 7(6):e39143
- Jones A, Steeden JA, Pruessner JC, Deanfield JE, Taylor AM, Muthurangu V. (2011). Detailed assessment of the hemodynamic response to psychosocial stress using real-time MRI. J Magn Reson Imaging 33(2):448–54
- Klatsky AL. (1994). Epidemiology of coronary heart disease – influence of alcohol. Alcohol Clin Exp Res 18(1):88–96
- Klatsky AL, Armstrong MA, Friedman GD. (1990). Risk of cardiovascular mortality in alcohol drinkers, ex-drinkers and nondrinkers. Am J Cardiol 66(17):1237–42
- Koga Y, Kajiyama K, Sufu H, Otsuki T, Tsuji Y, Iwami G, Toshima H. (1993). Alterations in beta-adrenergic receptor density and cyclic-AMP level in the myocardium of rats chronically treated with alcohol. Kurume Med J 40(1):1–6
- Kowalik G, Steeden JA, Atkinson D, Muthurangu V. (2011). A networked GPU reconstructor within the clinical workflow for rapid fat quantification. Proceedings of the 19th Annual Meeting of ISMRM (Abstract 2708), Montreal, Canada
- Kupari M, Virolainen J, Koskinen P, Tikkanen MJ. (1993). Short-term heart rate variability and factors modifying the risk of coronary artery disease in a population sample. Am J Cardiol 72(12):897–903
- Langer RD, Criqui MH, Reed DM. (1992). Lipoproteins and blood pressure as biological pathways for effect of moderate alcohol consumption on coronary heart disease. Circulation 85(3):910–15
- Lee S, Schmidt D, Tilders F, Cole M, Smith A, Rivier C. (2000). Prolonged exposure to intermittent alcohol vapors blunts hypothalamic responsiveness to immune and non-immune signals. Alcohol Clin Exp Res 24(1):110–22
- Lovallo WR, Dickensheets SL, Myers DA, Thomas TL, Nixon SJ. (2000). Blunted stress cortisol response in abstinent alcoholic and polysubstance-abusing men. Alcohol Clin Exp Res 24(5):651–8
- Malpas SC, Whiteside EA, Maling TJ. (1991). Heart rate variability and cardiac autonomic function in men with chronic alcohol dependence. Br Heart J 65(2):84–8
- Mehlum L. (1999). Alcohol and stress in Norwegian United Nations peacekeepers. Mil Med 164(10):720–4
- Moberg CA, Weber SM, Curtin JJ. (2011). Alcohol dose effects on stress response to cued threat vary by threat intensity. Psychopharmacology (Berlin) 218(1):217–27
- Parati G, Mancia G, Di Rienzo M, Castiglioni P, Taylor JA, Studinger P. (2006). Point: counterpoint: cardiovascular variability is/is not an index of autonomic control of circulation. J Appl Physiol 101(2):676–82
- Ryan JM, Howes LG. (2002). Relations between alcohol consumption, heart rate, and heart rate variability in men. Heart 88(6):641–2
- Sato M, Maulik N, Das DK. (2002). Cardioprotection with alcohol: role of both alcohol and polyphenolic antioxidants. Ann N Y Acad Sci 957:122–35
- Schuckit MA. (2009). An overview of genetic influences in alcoholism. J Subst Abuse Treat 36(1):S5–14
- Shaper AG, Wannamethee G, Walker M. (1988). Alcohol and mortality in British men: explaining the U-shaped curve. Lancet 2(8623):1267–73
- Sher KJ, Bartholow BD, Peuser K, Erickson DJ, Wood MD. (2007). Stress-response-dampening effects of alcohol: attention as a mediator and moderator. J Abnorm Psychol 116(2):362–77
- Steeden JA, Atkinson D, Hansen MS, Taylor AM, Muthurangu V. (2011). Rapid flow assessment of congenital heart disease with high-spatiotemporal-resolution gated spiral phase-contrast MR imaging. Radiology 260(1):79–87
- Stergiopulos N, Meister JJ, Westerhof N. (1994). Simple and accurate way for estimating total and segmental arterial compliance: the pulse pressure method. Ann Biomed Eng 22(4):392–7
- Stewart SH, Finn PR, Pihl RO. (1992). The effects of alcohol on the cardiovascular stress response in men at high risk for alcoholism: a dose response study. J Stud Alcohol 53(5):499–506
- The National Statistics Socio-economic Classification. Office for National Statistics, available at http://www.ons.gov.uk/ons/guide-method/classifications/current-standard-classifications/soc2010/soc2010-volume-3-ns-sec–rebased-on-soc2010–user-manual/index.html (accessed 1 March 2012)
- Yeomans MR. (2010). Alcohol, appetite and energy balance: is alcohol intake a risk factor for obesity? Physiol Behav 100(1):82–9
- Yu H, McKenzie CA, Shimakawa A, Vu AT, Brau AC, Beatty PJ, Pineda AR, et al. (2007). Multiecho reconstruction for simultaneous water-fat decomposition and T2* estimation. J Magn Reson Imaging 26(4):1153–61