
Abstract
Two novel polymer–drug conjugates norcantharidin-poly(vinyl alcohol) and norcantharidin-chitosan (NCTD-PVA and NCTD-CS) were synthesized via alcoholysis reaction and characterized by 1H-NMR and FTIR. NCTD was released from the conjugates via hydrolysis, faster in PBS (pH 5.0) than that in PBS (pH 7.4). NCTD-PVA and NCTD-CS inhibited human esophageal carcinoma ECA-109 cell and murine breast cancer EMT6 cell growth in a dose-dependent manner. The IC50 values of NCTD, NCTD-PVA and NCTD-CS on ECA-109 cell at 48 h were 9.4 ± 0.9, 55.3 ± 3.0 and 168.8 ± 8.9 μg/ml, respectively, and the IC50 values of the three compounds on EMT6 cell were 3.1 ± 0.3, 30.5 ± 5.4 and 90.7 ± 8.1 μg/ml, respectively. The two conjugates both induced esophageal carcinoma ECA-109 cell apoptosis and arrested cell cycle at the S phase. Caspase-8 and caspase-3 were activated in the ECA-109 cell after incubating with NCTD-PVA or NCTD-CS. The primary in vivo antitumor activity was assessed in the EMT6 tumor-bearing mouse model. NCTD-PVA and NCTD-CS displayed higher tumor inhibition rates than that of free NCTD.
Introduction
Esophageal cancer, one of the common malignant tumors, has caused about 300 000 people’s death every year all over the world. Due to its high incidence in China, seeking for effectively protective and curative methods becomes very important. Norcantharidin (NCTD), a derivative of cantharidin (CTD), remains the prototypic anti-cancer activity as well as some disadvantages such as the kidney toxicity and low targeting efficiency (Wang, Citation1989; McCluskey et al., Citation2003; Zhang et al., Citation2005).
Low molecular weight compounds have been applied in clinic traditionally. Most of them faced low delivery efficiency problem. In the last decade, much attention has been paid to special polymers due to their passive targeting property. One particular approach to enhance the efficiency of drugs is the design of polymer–drug conjugates (Khandare & Minko, Citation2006). It is a means of improving the efficacy of controlled drug delivery system through a prolonged release of drugs. Based on the enhanced permeability and retention (EPR) effect, the drug passive targeting delivery system includes liposomes (Cobleigh et al., Citation2003), micelles, dendrimers (Pili et al., Citation2010), biodegradable particles (Homsi et al., Citation2007) and so on. The EPR effect was first proposed in the 1980s by Matsumura & Maeda (Citation1986), nano-size agents (typically liposomes, nanoparticles and macromolecular drugs) tend to accumulate in tumor tissue much more than they do in normal tissues due to the defective endothelial cells and the lack of effective lymphatic drainage of the tumor vessels (Vasey et al., Citation1999).
Poly(vinyl alcohol) (PVA), a high molecular weight polymer with good biocompatibility, has been widely applied in medicine. Chitosan (CS), the only natural alkaline polysaccharose, has good biodegradability and biocompatibility as well as antibacterial property and immunoregulation activity. However, the application of CS has been hampered largely by its solubility only in acidic environments with pH values lower than 6.0 (Guan et al., 2012a). To overcome this problem, N-trimethyl chitosan, a partially quaternized chitosan derivative was synthetized and it was soluble in the entire pH range (Guan et al., 2012a). In our study, the hydrophilic group (−COOH) was imported into the CS molecule via the alcoholysis reaction between NCTD and CS. PVA and CS, with multiple hydroxyl groups, can easily be conjugated with low molecular weight drug molecules such as NCTD. Previous studies showed that NCTD induced various cancer cells apoptosis (Peng et al., Citation2002; Chen et al., Citation2003; Kok et al., Citation2005; Huang et al., Citation2009; Peng et al., Citation2009; Luan et al., Citation2010; Chang et al., Citation2011; Liao et al., Citation2011). Several studies on norcantharidin-chitosan (NCTD-CS) nanoparticles have been reported (Wang et al., Citation2010; Yu et al., Citation2011; Guan et al., Citation2012a,Citationb), though the NCTD-CS nanoparticles presented favorable liver-targeting efficacy and antitumor effect, the drug-loading capacity was relatively low, only about 10% (Wang et al., Citation2010). In our study, norcantharidin-poly(vinyl alcohol) (NCTD-PVA) and NCTD-CS with high drug-loading amount (30–40%) were synthesized in order to decrease the medication doses used in clinic, at the same time increase the accumulated drug amount in the tumor tissue by the EPR effect of high molecular weight polymer–drug conjugates, thus enhance the drug delivery efficiency and decrease the drug toxicity to normal tissues. Polymer-drug conjugates could deliver the drug into tumors or even inside every individual tumor cell efficiently via the EPR effect in vivo. However, low molecular weight pharmaceutical agents will not be retained in tumors because of their ability to return to the circulation by diffusion (Maeda et al., Citation2001). Several studies have been reported that the introduction of some specific ligands to chitosan or PVA endowed them with active targeting, which could deliver the drug more efficiently to the targeting tissue (Zhang et al., Citation2006; Mahmoudi et al., Citation2008; Guan et al., Citation2012a,b). Primary in vitro and in vivo evaluation of NCTD-PVA and NCTD-CS was performed to study whether the two polymer–drug conjugates displayed more efficient antitumor effects compared with NCTD.
Materials and methods
Materials and reagents
NCTD was purchased from Ze Lang Biotechnology Co. Ltd, China. CS (Mw = 50 000 Da, degree of deacetylation = 87%) was obtained from Yuhuan Ocean Biotechnology Co. Ltd., China, PVA (Mw ∼74 800 Da), DMSO, methanol (LC), methanesulfonic acid and acetone were purchased from Sinopharm Chemical Reagent Co. Ltd., China. MTT (3-(4,5-dimethylthiazol-2-yl)-2,5-diphenyltetrazolium bromide), PI and RNase A were purchased from Solarbio Biotechnology Co. Ltd, China. Annexin V-FITC cell apoptosis kit, Bradford protein concentration assay kit, caspase-3 activity assay kit and caspase-8 activity assay kit were purchased from Beyotime Institute of Biotechnology, China.
Synthesis and characterization
NCTD (5.04 g) and PVA (1.76 g) were dissolved in anhydrous DMSO in a 250 ml round bottomed flask. The solution was stirred at 60 °C for 24 h. After that, the reaction solution was precipitated by acetone, the precipitated product was isolated by filtration, washed with water 2–3 times and dried in vacuum oven at 25 °C for 48 h. The synthetic route was shown in .
Figure 1. Synthesis of NCTD-PVA (a) and NCTD-CS (b).
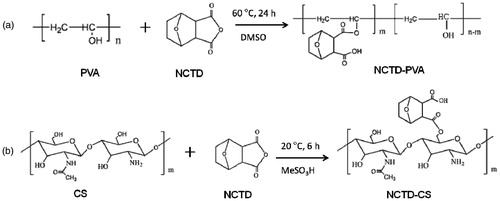
Similarly, NCTD (5.04 g) and CS (1.61 g) were dissolved in methanesulfonic acid in a 250 ml round bottomed flask. The solution was stirred at room temperature for 6 h, then the reaction solution was precipitated by acetone, dialyzed using a dialysis tube (molecular weight cutoff 3500 Da) against distilled water for two days and dried in vacuum oven at 25 °C for 48 h. The synthetic route was shown in .
NCTD-PVA and NCTD-CS were characterized by 1H-NMR and FTIR. The 1H-NMR spectra were measured on a Varian Mercury plus 400 spectrometer with D2O as solvent. The chemical structures of NCTD-PVA and NCTD-CS were measured using a FTIR spectrometer (EQUINOX55, Bruck, Switzerland). The degrees of NCTD grafting of NCTD-PVA were calculated by acid-base titration
where 44 is the relative molecular weight of the PVA monomer, C is the concentration (mol/l) of NaOH, V is the volume (ml) of used NaOH and W is the weight (g) of NCTD-PVA.
The degree of NCTD substitution (DS) of NCTD-CS was calculated by 1H-NMR
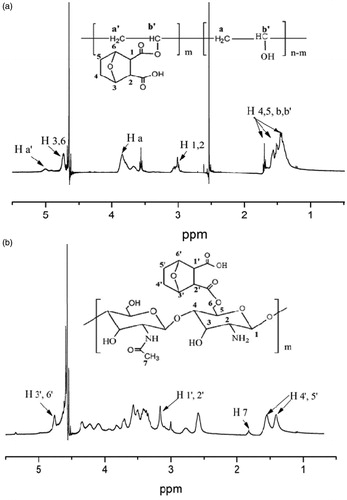
where DD is the degree of deacetylation of chitosan, IH4′5′ is the integration area of the proton peaks at 1.32–1.64 ppm (), which were assigned to the methylene groups of the conjugated NCTD. IH7 is the integration area of the proton peak of acetamido of the chitosan.
Figure 2. 1H-NMR spectra of NCTD-PVA (a) and NCTD-CS (b).
In vitro NCTD release study
In vitro release behavior of NCTD from NCTD-PVA and NCTD-CS was evaluated using a dialysis method. A dialysis tube (molecular weight cutoff 3500 Da) containing 5 ml NCTD-PVA (20 mg/ml) or NCTD-CS (20 mg/ml) was immersed in a plastic tube containing 30 ml PBS (pH 5.0 or 7.4), respectively. Then, the release experiments were conducted in an incubator shaker (SHA-C, China) at 37 °C, with shaking at 120 rpm. At various time intervals, PBS in the tubes were collected and replaced with fresh medium. The amounts of released NCTD were quantified by HPLC (1525-2998-2707, Waters, Milford, MA, USA). The mobile phase was a mixture of methanol/0.02 M KH2PO4 buffer solution (15:85 v/v). UV wavelength was 210 nm and the flow rate was 1 ml/min at 30 °C.
Cell lines and in vitro cytotoxicity assay
Human esophageal carcinoma ECA-109 cell line was obtained from Chinese Academy of Sciences in Shanghai, murine breast cancer EMT6 cell line was provided by Professor Shaoshun Li of Shanghai Jiao Tong University. Both ECA-109 and EMT6 cells were cultivated in RPMI-1640 medium (Gibco, Carlsbad, CA, USA) supplemented with 10% heat-inactivated fetal calf serum (Solarbio, China) at 37 °C in a humidified 5% CO2 incubator.
The in vitro cytotoxicity assay was tested on ECA-109 and EMT6 cells. Briefly, cells were seeded in 96-well plates at a density of 5000 cells per well. After 24 h, various concentrations of NCTD, NCTD-PVA and NCTD-CS were added to the medium. After 48 h, MTT was added to each well at a final concentration of 0.5 mg/ml. After 4 h, the MTT solutions were replaced by 200 μl DMSO per well to dissolve the formazan crystal. The optical density (OD) values were measured by the microplate reader (Varioskan Flash, Thermo, Boston, MA, USA) at 490 nm. The inhibition rate was calculated by the following formula:
where ODtreated is the OD value of NCTD-, NCTD-PVA- or NCTD-CS-treated cells. ODcontrol is the OD value of untreated cells. The IC50 values were calculated using the Origin 8.1 software.
Cell apoptosis assay
Except the cytotoxicity assay was experimented on both ECA-109 and EMT6 cell lines, other in vitro evaluations were assessed on ECA-109 cell line. Annexin V-FITC/PI double staining was performed according to the protocol of cell apoptosis kit. Briefly, after incubating with NCTD (8 μg/ml), NCTD-PVA (52 μg/ml) and NCTD-CS (168 μg/ml) for 12, 24 and 48 h, respectively, cells were collected and re-suspended in a binding buffer, then 5 μl Annexin V-FITC and 10 μl PI were added and they were incubated for 10 min at room temperature in the dark. And then they were tested by a flow cytometer (FACS Calibur, BD, Franklin Lakes, NJ) within an hour. The data were analyzed by the Cell Quest software (BD, Franklin Lakes, NJ).
Cell cycle distribution assay
Cells were seeded in 6-well plates at a density of 200 000 cells per well. NCTD (8 μg/ml), NCTD-PVA (52 μg/ml) and NCTD-CS (166 μg/ml) were added to the medium, after 48 h, cells were fixed with cooled 70% (v/v) ethanol for 4 h and incubated with PBS containing 50 μg/ml PI and 50 μg/ml RNase A at 37 °C for 30 min. Finally, the cellular DNA contents were analyzed by the FACS ModFit LT software.
Caspase-3 and caspase-8 activity assays
Caspase-3 and caspase-8 activities were measured according to the manufacturer’s protocol (Beyotime, China). Briefly, cells were cultured with or without NCTD, NCTD-PVA and NCTD-CS for 24 and 36 h, and then cells were lysed and total cellular protein extracts were quantified using a protein-assay kit (Beyotime, China). Then, an equal amount of total protein extract was incubated at 37 °C over night with either Ac-DEVD-pNA for caspase-3 assay or Ac-IETD-pNA for caspase-8 assay. The release of pNA was estimated by the absorbance at 405 nm on a microplate reader. The relative activity of caspase was calculated by the formula:
In vivo antitumor evaluation
All the in vivo experiments were performed in accordance with the requirements of the National Act on the use of experimental animals (People’s Republic of China). Female Kunming mice were purchased from Slac Experimental Animal Co. Ltd., China. Twenty female Kunming mice (22–25 g) were equally and randomly divided into four groups: the control, NCTD, NCTD-PVA and NCTD-CS group. 2 × 10⁶ EMT6 cells were subcutaneously injected at front right armpit of each Kunming mouse. The next day, each mouse of the NCTD group was intravenously given the NCTD injection once daily at a dose of 10 mg/kg for eight days. Similarly, NCTD-PVA was administrated at days 1, 3, 5 and 7 at 52 mg/kg (20 mg/kg NCTD-equivalent dose). And NCTD-CS was administrated at days 1 and 5 at 83 mg/kg (40 mg/kg NCTD-equivalent dose). The mice of the control group were given equal volume of saline once daily for eight days. After eight days, all mice were sacrificed, and the tumor tissues were harvested and weighed, hearts, livers, spleens, lungs and kidneys were collected and fixed with 10% formalin solution.
Statistical analysis
All data were expressed as mean ± SD of at least triplicate independent experiments. We used the Student’s t-test to analyze the statistics. The mean values of two groups were considered significantly different if *p < 0.05, **p < 0.01.
Results and discussion
Synthesis and characterization
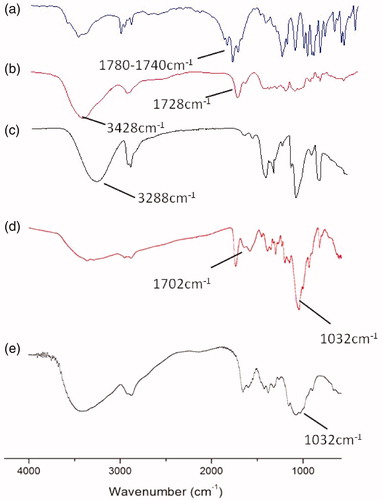
NCTD-PVA and NCTD-CS were synthesized via alcoholysis reaction. In the 1H-NMR spectrum of NCTD-PVA (), the peak at 3.8 ppm belonged to protons attached to the methylene group of the PVA backbone. The peak at 3.0 ppm was assigned to the methylidyne groups (H 1, 2) of the conjugated NCTD, suggesting that NCTD was successfully conjugated to the PVA. As seen from , the signals at 1.32–1.64 and 3.18 ppm were attributed to the methylene groups (H 4′, 5′) and the methylidyne groups (H 1′, 2′) of the conjugated NCTD, respectively, indicating that NCTD was conjugated into the chitosan backbone successfully. showed FTIR spectra of NCTD (a), NCTD-PVA (b), PVA (c), NCTD-CS (d) and CS (e). As shown in and , the peaks of carbonyl in anhydride and ester were observed at 1780 and 1728 cm−1, respectively. Besides, the characteristic peak of νO–H in PVA (3288 cm−1, ) was observed at 3428 cm−1 in NCTD-PVA (). From , the C6–OH peak for CS at 1032 cm−1 disappeared, but a new peak appeared at 1702 m−1, which was the peak of carbonyl in carboxyl. These indicated that NCTD-PVA and NCTD-CS were synthesized successfully. The degrees of NCTD grafting of NCTD-PVA and NCTD-CS (mol/monomer mol) were 10.4% and 89.6%, respectively, the corresponding NCTD mass fractions were 38.8% and 48.0%.
Figure 3. FTIR spectra of NCTD (a), NCTD-PVA (b), PVA (c), NCTD-CS (d) and CS (e).
In vitro NCTD release
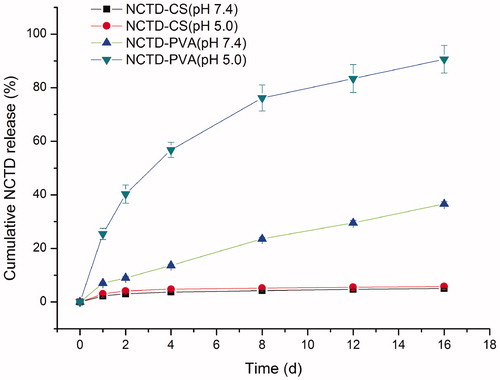
The release profiles of NCTD from NCTD-PVA and NCTD-CS in PBS (pH 5.0 and 7.4) were presented in . We found that NCTD underwent faster release from NCTD-PVA in PBS (pH 5.0) than that in PBS (pH 7.4). After two days, more than 40% NCTD was released in PBS (pH 5.0) whereas only 9% NCTD was released in PBS (pH 7.4). After 16 days, about 90% NCTD was released in PBS (pH 5.0) whereas about 37% NCTD was released in PBS (pH 7.4). The release curves indicated that the release of NCTD from NCTD-PVA was much slower under the neutral physiological conditions than that under weakly acidic conditions. It was well documented that unlike normal tissues, solid tumor tissues usually had an acidic extracellular environment with an averaged pH of 6.81 ± 0.09 and the lowest value of 5.55 (Whitmarsh & Davis, Citation1996). From the release profiles of NCTD-CS, we found that release of NCTD from NCTD-CS was relatively slow. Less than 6% NCTD was released in PBS (pH 5.0 and 7.4) after 16 days. The slow release of NCTD from NCTD-CS may be because there were a lot of −NH2, −COOH, and −OH groups in the NCTD-CS molecules, when NCTD-CS was dissolved in aqueous solution, the −NH2, −COOH, and −OH groups may form lots of hydrogen bonds or even complex network structure systems with the H2O molecules from the solvent, which could impede the release of NCTD from NCTD-CS.
Figure 4. Release profiles of NCTD from NCTD-PVA and NCTD-CS in PBS (pH 5.0 and 7.4) at 37 °C (n = 3).
In vitro cytotoxicity
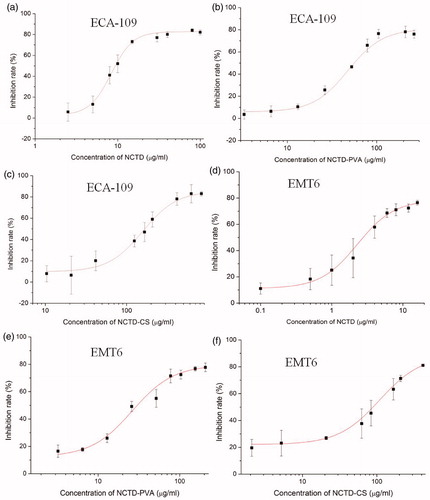
The MTT assay results showed that after cultivating with NCTD, NCTD-PVA or NCTD-CS at various concentrations, the number of viable ECA-109 cells and EMT6 cells markedly decreased in a dose-dependent manner (). The IC50 values of NCTD-PVA and NCTD-CS at 48 h on ECA-109 cells were 55.3 ± 3.0 and 168.8 ± 8.9 μg/ml (NCTD equivalent doses of 21.2 ± 1.2 and 81.0 ± 4.3 μg/ml), respectively, much higher than that of NCTD (9.4 ± 0.9 μg/ml). While the IC50 values of NCTD-PVA and NCTD-CS on EMT6 cells were 30.5 ± 5.4 and 90.7 ± 8.1 μg/ml (NCTD equivalent doses of 11.8 ± 2.1 and 43.5 ± 3.9 μg/ml), higher than that of NCTD (3.1 ± 0.3 μg /ml). The results showed that EMT6 cells were more sensitive to NCTD, NCTD-PVA and NCTD-CS than ECA-109 cells. The data also indicated that both of the ECA-109 cells and the EMT6 cells were more resistant to NCTD-PVA and NCTD-CS. Considering prolonged NCTD release from the conjugates, the lower cytotoxicity of NCTD-PVA or NCTD-CS in comparison with free NCTD was understandable.
Figure 5. Inhibition rates of proliferation of ECA-109 cells (a–c) and EMT6 (d–f) cells at various concentrations of NCTD (a and d), NCTD-PVA (b and e) and NCTD-CS (c and f) (n = 6).
Cell apoptosis
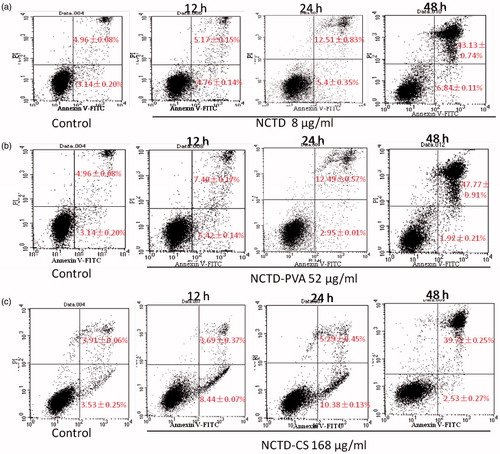
Annexin V-FITC/PI double staining and flow cytometric analysis were used to quantify the induced apoptotic cells (). After culturing with NCTD, NCTD-PVA and NCTD-CS for 12, 24 and 48 h, respectively, the number of cells that underwent apoptosis and necrosis (Annexin V+/PI−, early apoptosis, Annexin V+/PI+, late apoptosis and necrosis) increased in a time-dependent manner. After NCTD or NCTD-PVA treatment, the proportion of early apoptotic cells was about 5% throughout the whole experiment time, whereas the number of late apoptotic and necrotic cells increased markedly with extended incubation time. Slight difference was seen in NCTD-CS treated cells, after 12 and 24 h, the proportion of early apoptotic cells increased to about 10%, but after 48 h, about 40% cells were the late apoptotic and necrotic cells and only about 2% were in their early apoptotic phase. The results demonstrated that NCTD-PVA and NCTD-CS inhibited ECA-109 cell proliferation via the apoptosis pathway, but the detailed mechanism may be different.
Figure 6. NCTD (a), NCTD-PVA (b) and NCTD-CS (c) induced ECA-109 cell apoptosis. The cells were incubated with NCTD (8 μg/ml), NCTD-PVA (52 μg/ml) and NCTD-CS (168 μg/ml) for 12, 24 and 48 h, respectively. Then, the cells were collected and stained with Annexin V-FITC and PI and analyzed by flow cytometry (n = 3).
Cell cycle distribution
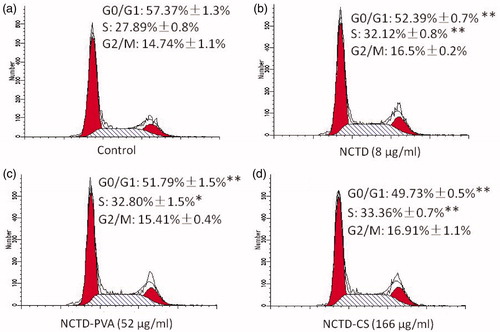
To further understand the cell proliferation inhibitory mechanisms of NCTD-PVA and NCTD-CS, PI single staining and flow cytometric analysis were performed to detect the cell cycle distribution. The results () revealed that NCTD induced accumulation of cells in the S phase and reduced the number of cells in the G0/G1 phase. Similarly, NCTD-PVA and NCTD-CS also arrested ECA-109 cell cycle at the S phase. These implied that NCTD-PVA and NCTD-CS may take effect via the release of NCTD.
Figure 7. Flow cytometric analysis of cell cycle distribution. The ECA-109 cells were treated with or without NCTD (b), NCTD-PVA (c) and NCTD-CS (d) for 48 h. (a) Drug untreated group. DNA histograms showed that NCTD, NCTD-PVA and NCTD-CS-arrested cell cycle at the S phase (n = 3), *p < 0.05, **p < 0.01.
Caspase-3 and caspase-8 activities
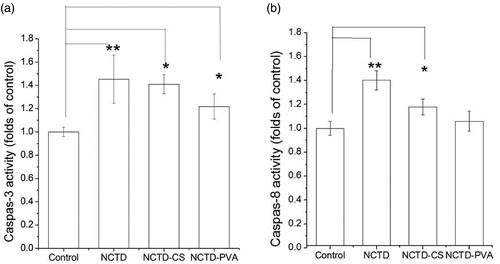
Accumulating evidence demonstrated that treatment with anti-cancer drugs has been shown to activate caspase cascade, which played a central role in the execution of apoptosis (Thistlethwaite et al., Citation1985; Chen et al., Citation1998). Thus, the caspase activation effects of NCTD, NCTD-PVA and NCTD-CS on ECA-109 cell were examined. As shown in , both caspase-3 and caspase-8 were activated upon NCTD, NCTD-PVA or NCTD-CS treatment, particularly the activity of caspase-3 was significantly elevated at 36 h compared with the untreated cells, suggesting the participation of the extrinsic pathway in the induced apoptosis. The caspase-3 and caspase-8 activities of NCTD-PVA- or NCTD-CS-treated cells were not as high as those of NCTD-treated cells, perhaps because less NCTD was accumulated in NCTD-PVA- or NCTD-CS-treated cells at 24 and 36 h.
Figure 8. Activation of caspase-3 (a) and caspase-8 (b) involved in NCTD, NCTD-PVA and NCTD-CS-induced ECA-109 cell apoptosis. The cells were treated with NCTD (8 μg/ml), NCTD-PVA (52 μg/ml) and NCTD-CS (166 μg/ml), respectively, the caspase-3 and caspase-8 activities were measured according to manufacturer’s protocol, fluorogenic peptides were used as substrates. Caspase-3 (a) activity was measured after incubating for 36 h and caspase-8 (b) activity was measured after incubating for 24 h (n = 3), *p < 0.05, **p < 0.01.
In vivo antitumor evaluation
The antitumor efficacies of NCTD, NCTD-PVA and NCTD-CS were assessed in a breast tumor-bearing Kunming mouse model. No death was recorded within the experimental period. After intravenous injection for eight days, all tumor tissues were harvested (). The tumor inhibition rate was calculated by the formula:
where W is the mean tumor weight. The control group had an average tumor burden of 1.02 g while the NCTD, NCTD-PVA and NCTD-CS groups had average tumor burdens of 0.66, 0.45 and 0.55 g, respectively, a 35.87%, 56.17% and 45.82% decrease in tumor growth compared with the control group (), statistically significant differences of tumor weight were obtained between the control group and the treated groups. Besides, NCTD-PVA and NCTD-CS showed prolonged release behavior and higher tumor inhibition rates in the tumor model compared with NCTD. Considering the biodegradation of NCTD-CS, hydrolysis of NCTD-PVA and the EPR effect of macromolecules, the higher inhibition rates of the polymer–drug conjugates were understandable. Apart from that, some strange phenomena were also observed, NCTD-PVA-treated mice were not as active as the other groups during the experimental period. After all mice were sacrificed, the spleens of the NCTD-PVA group and the kidneys of the NCTD-CS group were light red, whereas the spleens and kidneys of other groups were dark red. The spleens of the NCTD-PVA group were also observed larger than those of the other groups (). These implied that further security evaluations of the two conjugates in vivo were still needed.
Figure 9. In vivo antitumor activity of NCTD, NCTD-PVA and NCTD-CS after intravenous injection via the tail vein in tumor-bearing mice. Mice were treated with saline, NCTD, NCTD-PVA and NCTD-CS for eight days, respectively, then all mice were killed and the tumor tissues (a), spleens and kidneys (b) of each group were harvested.
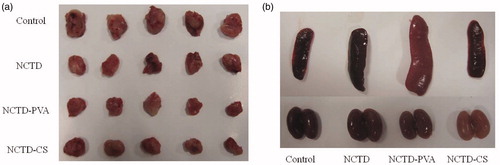
Table 1. Tumor weights and tumor inhibition rates for EMT6 tumor-bearing mice after treatment of NCTD-PVA and NCTD-CS (n = 5).
Conclusions
In summary, two polymer–drug conjugates (NCTD-PVA and NCTD-CS) were synthesized innovatively and characterized by 1H-NMR and FTIR. The release of NCTD from NCTD-PVA was faster in PBS (pH 5.0) than that in PBS (pH 7.4), whereas NCTD-CS was relatively stable. The two conjugates both induced ECA-109 cell apoptosis and cell cycle arrest, activated caspase-3 and caspase-8 in vitro. In general, similar cell proliferation inhibitory effects and mechanisms were obtained in NCTD-, NCTD-PVA- or NCTD-CS-treated ECA-109 cell, suggesting that the two conjugates take effect in the form of NCTD, in other words, NCTD-PVA and NCTD-CS must release NCTD via hydrolysis to take part in the anti-tumor process. More significant anti-tumor effects of NCTD-PVA and NCTD-CS were observed in the tumor-bearing Kunming mice model than that of NCTD. These imply that proper modifications of NCTD may enhance its antitumor effect. Two focal points must be taken into consideration. First, the amount of NCTD linked to polymers is adequate for the compound to reach its target site with a proper level of drug. Second, the timing of release is compatible for a therapeutic approach. Based on the theory more polymer–drug conjugates will be synthesized and studied in the future.
Declaration of interest
The authors report no conflicts of interest.
Acknowledgements
This work was supported by National Natural Science Foundation of China (NSFC) (81171439) and Shanghai Science and Technology Committee (10441902000).
References
- Chang C, Zhu Y, Tang X, et al. (2011). The anti-proliferative effects of norcantharidin on human HepG2 cells in cell culture. Mol Biol Rep 38:163–9
- Chen YN, Cheng CC, Chen JC, et al. (2003). Norcantharidin-induced apoptosis is via the extracellular signal-regulated kinase and c-Jun-NH2-terminal kinase signaling pathways in human hepatoma HepG2 cells. Br J Pharmacol 140:461–70
- Chen Y-R, Wang W, Kong A-N-T, et al. (1998). Molecular mechanisms of c-Jun N-terminal kinase-mediated apoptosis induced by anticarcinogenic isothiocyanates. J Biol Chem 273:1769–75
- Cobleigh MA, Langmuir VK, Sledge GW, et al. (2003). A phase I/II dose-escalation trial of bevacizumab in previously treated metastatic breast cancer. Semin Oncol 30:117--124
- Guan M, Zhou Y, Zhu QL, et al. (2012a). N-trimethyl chitosan nanoparticle-encapsulated lactosyl-norcantharidin for liver cancer therapy with high targeting efficacy. Nanomedicine 8:1172–81
- Guan M, Zhu QL, Liu Y, et al. (2012b). Uptake and transport of a novel anticancer drug-delivery system: lactosyl-norcantharidin-associated N-trimethyl chitosan nanoparticles across intestinal Caco-2 cell monolayers. Int J Nanomed 7:1921–30
- Homsi J, Simon GR, Garrett CR, et al. (2007). Phase I trial of poly-L-glutamate camptothecin (CT-2106) administered weekly in patients with advanced solid malignancies. Clin Cancer Res 13:5855–61
- Huang Y, Liu Q, Liu K, et al. (2009). Suppression of growth of highly-metastatic human breast cancer cells by norcantharidin and its mechanisms of action. Cytotechnology 59:201–8
- Khandare J, Minko T. (2006). Polymer–drug conjugates: progress in polymeric prodrugs. Prog Polym Sci 31:359–97
- Kok S-H, Cheng S-J, Hong C-Y, et al. (2005). Norcantharidin-induced apoptosis in oral cancer cells is associated with an increase of proapoptotic to antiapoptotic protein ratio. Cancer Lett 217:43–52
- Liao H-F, Chen Y-J, Chou C-H, et al. (2011). Norcantharidin induces cell cycle arrest and inhibits progression of human leukemic Jurkat T cells through mitogen-activated protein kinase-mediated regulation of interleukin-2 production. Toxicol Vitro 25:206–12
- Luan J, Duan J, Liu Q, et al. (2010). Inhibitory effects of norcantharidin against human lung cancer cell growth and migration. Cytotechnology 62:349–55
- Maeda H, Sawa T, Konno T. (2001). Mechanism of tumor-targeted delivery of macromolecular drugs, including the EPR effect in solid tumor and clinical overview of the prototype polymeric drug SMANCS. J Control Release 74:47–61
- Mahmoudi M, Simchi A, Imani M, et al. (2008). Optimal design and characterization of superparamagnetic iron oxide nanoparticles coated with polyvinyl alcohol for targeted delivery and imaging. J Phys Chem B 112:14470–81
- Matsumura Y, Maeda H. (1986). A new concept for macromolecular therapeutics in cancer chemotherapy: mechanism of tumoritropic accumulation of proteins and the antitumor agent smancs. Cancer Res 46:6387–92
- McCluskey A, Ackland SP, Bowyer MC, et al. (2003). Cantharidin analogues: synthesis and evaluation of growth inhibition in a panel of selected tumour cell lines. Bioorg Chem 31:68–79
- Peng C, Liu X, Xu K, et al. (2009). Norcantharidin induces HT-29 colon cancer cell apoptosis through the αvβ6-extracellular signal-related kinase signaling pathway. Cancer Sci 100:2302–8
- Peng F, Wei YQ, Tian L, et al. (2002). Induction of apoptosis by norcantharidin in human colorectal carcinoma cell lines: involvement of the CD95 receptor/ligand. J Cancer Res Clin Oncol 128:223–30
- Pili R, Rosenthal PN, Van Hazel G, et al. (2010). Phase II study on the addition of ASA404 (vadimezan; 5, 6-dimethylxanthenone-4-acetic acid) to docetaxel in CRMPC. Clin Cancer Res 16:2906–14
- Thistlethwaite AJ, Leeper DB, Moylan III DJ, et al. (1985). pH distribution in human tumors. Int J Radiat Oncol Biol Phys 11:1647–52
- Vasey PA, Kaye SB, Morrison R, et al. (1999). Phase I clinical and pharmacokinetic study of PK1 [N-(2-hydroxypropyl) methacrylamide copolymer doxorubicin]: first member of a new class of chemotherapeutic agents – drug-polymer conjugates. Clin Cancer Res 5:83–94
- Wang G-S. (1989). Medical uses of mylabris in ancient China and recent studies. J Ethnopharmacol 26:147–62
- Wang Q, Zhang L, Hu W, et al. (2010). Norcantharidin-associated galactosylated chitosan nanoparticles for hepatocyte-targeted delivery. Nanomedicine 6:371–81
- Whitmarsh A, Davis R. (1996). Transcription factor AP-1 regulation by mitogen-activated protein kinase signal transduction pathways. J Mol Med 74:589–607
- Yu D, Bei Y, Chen X, et al. (2011). Novel norcantharidin-loaded liver targeting chitosan nanoparticles to enhance intestinal absorption. 5th International Conference on Bioinformatics and Biomedical Engineering (iCBBE) 2011, IEEE
- Zhang L, Sun X, Zhang Z-R. (2005). An investigation on liver-targeting microemulsions of norcantharidin. Drug Deliv 12:289–95
- Zhang H, Mardyani S, Chan W-CW, et al. (2006). Design of biocompatible chitosan microgels for targeted pH-mediated intracellular release of cancer therapeutics. Biomacromolecules 7:1568–72