
Abstract
The aims of the present study were to prepare new dual-mode floating gastroretentive tablets (DF-GRT) containing itraconazole (ITR) and to evaluate influence of the dosage forms on pharmacokinetic parameters of ITR. The solubility of ITR was enhanced around 200 times (from 1.54 to 248.38 µg/mL) by preparing solid dispersion (SD) with hydroxypropylmethyl cellulose. Buoyancy of DF-GRT containing ITR-SD was established by both camphor sublimation and gas generation. Camphor sublimation decreased density of DF-GRT by making pores in tablet matrix, which led to elimination of lag time for floating. Carbon dioxide generated by sodium bicarbonate and citric acid helped to maintain buoyancy of DF-GRT. Therefore DF-GRT floated on the medium without lag time until disintegrated entirely during in vitro release study. They released 89.11% of the drug at 2 h. Residual camphor was <0.5 wt% after sublimation. The pharmacokinetics of DF-GRT was evaluated in six miniature pigs and compared to immediate release tablets (IRT). Mean AUC ratio of GRT/IRT was 1.36 but there was no statistical difference between AUC values. However delayed tmax, increased MRT and equivalent Cmax of DF-GRT supposed it could be a promising tool for gastroretentive drug delivery system containing ITR.
Introduction
Itraconazole (ITR) is an oral antifungal agent that inhibits cytochrome P450 and interferes in biosynthesis of ergosterol in fungal membranes, thereby leading to cell death (Van Cutsem et al., Citation1984; Saag & Dismukes, Citation1988; Odds et al., Citation2000). The oral bioavailability of ITR is markedly affected by food intake (Barone et al., Citation1993; Zimmermann et al., Citation1994) and shows high intra- and intersubject variability (Hardin et al., Citation1988; Zhou et al., Citation1998; McKinsey et al., Citation1999; Janssen, Citation2006). Thus Sporanox® capsule (Janssen Pharmaceuticals, Inc., Titusville, NJ), currently marketed ITR product, is highly recommended to be administered right after a meal.
Numerous studies have been done to improve the bioavailability of ITR including solid dispersion (SD) (Jung et al., Citation1999; Kapsi & Ayres, Citation2001; Engers et al., Citation2010), inclusion complex with cyclodextrin (Hassan et al., Citation2007) and self-micro emulsifying drug delivery system (Hong et al., Citation2006; Woo et al., Citation2008). According to the Biopharmaceutics Classification System (BCS), ITR is a class II drug and most studies have focused on improving the solubility of ITR (Wu & Benet, Citation2005). Meanwhile Jules Jacobs et al. studied mucoadhesive tablets of ITR. Because ITR is weak base (pKa = 3.7) and is ionized at acidic pH, the drug might be absorbed mainly in upper gastrointestinal tract. The authors insisted that ∼20% of improvement in bioavailability was achieved by mucoadhesive tablets of ITR (Jacob et al., Citation2006). Hence, present study was based on the concept that extended gastric retention of ITR could lead to an increase of absorption in upper gastrointestinal tract. In addition, high intra- and intersubject variability in bioavailability might be attributed to diversity of individual gastric retention times. Thus it was attempted to extend gastric retention of ITR by employing the gastroretentive dosage form.
In previous studies, gastroretentive tablets (GRT) which usually exhibited release behavior over 6 h have been prepared. However, it seemed difficult to design GRT which stayed in human stomach for >2 h under fasted condition due to housekeeper waves (Singh & Kim, Citation2000). Therefore GRT containing ITR-SD which floated on gastric fluid and constantly released the drug for 2 h were designed. Considering tmax of ITR in reported pharmacokinetic studies, gastric retention of ITR for 2 h is enough to enhance the absorption of ITR in the upper gastrointestinal tract if the system works (Barone et al., Citation1993; Zimmermann et al., Citation1994). To our knowledge, this is the first attempt to improve the ITR bioavailability this way.
There has been several ways to prepare gastroretentive dosage forms including a floating system, a mucoadhesive system, an expandable system and a super-swelling system (Singh & Kim, Citation2000; Arora et al., Citation2005). Among them, the floating system is thought to be the most convenient method in that it requires simple manufacturing steps (e.g. compression) and pharmaceutically accepted excipients. Although the floating system has been generally designed using gas generators (e.g. carbonates), GRT containing low-density material such as polypropylene and calcium silicate were also reported (Streubel et al., Citation2003; Jain et al., Citation2005). These GRT are valuable in that they could float immediately on gastric fluid surface due to low-density, thus they would not be in risk of premature emptying in a stomach. However safety and clearance of low density materials might be suspicious.
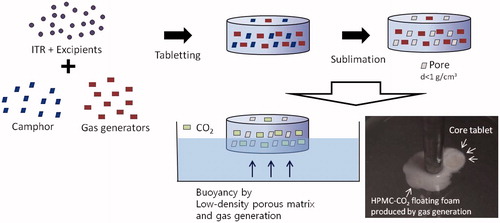
In the present study, our group designed new GRT which acquired buoyancy using two different systems, gas-generating and highly porous low-density system as depicted in . Formulation studies for gas-generating GRT (GG-GRT) and low-density GRT (LD-GRT) were conducted separately, and finally both systems were combined for DF-GRT in the present study. These dual-mode floating GRT (DF-GRT) has buoyancy without any lag time due to low density and shows controlled drug release behavior. Camphor was used as a sublimation material for the highly porous low-density system and, citric acid and sodium bicarbonate were incorporated as gas generators for the gas-generating system. The density of GRT could be easily controlled by the amount of sublimation materials (Oh et al., Citation2012).
Figure 1. A conceptional image of dual-mode floating GRT (DF-GRT).
The aims of the present study were to design GRT containing ITR and to evaluate influence of the gastroretentive dosage form on pharmacokinetic parameters of ITR. Effect of factors such as addition of camphor, type of matrix formed polymer on both release behavior and buoyancy were investigated. The pharmacokinetic study was performed in a miniature pig model and pharmacokinetic parameters of the GRT and immediate release tablets were compared.
Materials and methods
Materials
Itraconazole was purchased from Neuland Laboratories Limited (Hyderabad, India). Camphor was obtained from Sigma-Aldrich Co. (St. Louis, MO). Hydroxypropylmethyl cellulose (HPMC) with various viscosity grades were kindly gifted from Samsung fine chemicals (Ulsan, South Korea) and Shin-Etsu Chemicals Co. (Tokyo, Japan). Grades of HPMC were as followings; 4.5 cP (2906), 50 cP (2906), 4000 cP (2208), 15 000 cP (2208) and 100 000 cP (2208). Hydroxyethyl cellulose (HEC) was obtained from Aqualon (Natrosol® 250 HHX; Wilmington, DE). The following materials were purchased from various companies: croscarmellose sodium (CCS; FMC BioPolymer Co., Philadelphia, PA), sodium bicarbonate (NaHCO3; Samchun Pure Chemical Co., Pyeongtaek, Korea), maize starch (Roquette Corporate, Lestrem, France), citric acid (Samchun Pure Chemical Co., Pyeongtaek, Korea). Water was purified by reverse osmosis and filtered in house. All chemicals used were of reagent grade and solvents were of HPLC grade.
Preparation of ITR-SD
Itraconazole solid dispersion was prepared with HPMC 4.5 cP and citric acid using spray dryer (Mini Spray Dryer B-290; Büchi, Switzerland) (Lee et al., Citation2005). Briefly, itraconazole (20 g) was dissolved in dichloromethane (200 g) and both HPMC (5 g) and citric acid (5 g) were in ethanol (136 g). Then prepared solutions were mixed together for 1 h using a mechanical stirrer. ITR-SD was harvested using following conditions; pump speed – 10%, air flow rate – 45 Nl/h, aspiration level – 90–100%, inlet air temperature – 55°C, outlet air temperature – 38°C. The weight ratio of ITR:HPMC:citric acid was 1:0.25:0.25 and thus 300 mg of ITR-SD contained 200 mg of ITR.
Solubility test
Solubility test was carried out by adding excess ITR-SD to simulated gastric fluid without enzyme (pH 1.2 medium) and placing it in a horizontally-shaking water bath at 25°C for 48 h. Samples were withdrawn at 24 and 48 h. The supernatants were then filtered and analyzed using HPLC-UV.
Quantitative analysis of ITR
Concentration of ITR in the samples was measured by HPLC-UV at 263 nm using a mobile phase consisting of acetonitrile and 0.05% diethylamine aqueous solution (in volume ratio of 70:30) with Luna C18 column (150 mm × 4.6 mm; Phenomenex Inc., Torrance, CA) (Yoo et al., Citation2000). The temperature in a column oven was maintained at 40°C. Injection volume was 30 µl and flow rate of the mobile phase was 1.0 mL/min.
Differential scanning calorimetry
Samples of ITR-SD were placed in aluminum pans and crimped with an aluminum lid. Thermal analysis was carried out using differential scanning calorimetry (Exstar 6000, Seiko, Tokyo, Japan). The heating rate was 10°C/min from 30 to 200°C.
Powder X-ray diffraction
Powder X-ray diffraction (PXRD) was measured by D8 focus diffractometer (Bruker AXS, Karlsruhe, Germany) with a Cu anode (1.54 Å). PXRD data were obtained over range of 2-theta from 5° to 40° with the scanning rate of 2°/min.
Preparation of immediate release tablets containing ITR-SD
Itraconazole containing ITR-SD were prepared by wet granulation method and the composition was given in . Briefly, SD and starch were mixed with distilled water and granulated by 35-mesh screen. The granules were dried for 2 h in an oven at 50°C. Then granules and CCS was mixed together for 10 min in a plastic bag prior to lubrication with magnesium stearate. The mixture was compressed using a hydraulic compactor (Carver Laboratory Press-C; Fred S. Carver, Wabash, IN) with a flat-faced round punch (diameter: 13 mm). The content of ITR was maintained at 200 mg per tablet.
Table 1. Compositions of tablets containing ITR-SD (unit: mg/tablet).
Preparation of GRT containing ITR-SD
Compositions of GRT containing ITR-SD were summarized in . Granules containing ITR-SD was prepared using the identical method for granules of IRT containing ITR-SD. Then granules were blended with HPMC and camphor, citric acid and/or sodium bicarbonate. These excipients were sieved through 35-mesh screen prior to using. The mixture was lubricated with magnesium stearate and then compressed using a hydraulic compactor with a flat-faced round punch (diameter: 13 mm). The content of ITR was maintained at 200 mg per tablet. When camphor was incorporated in formulations, tablets were placed in a vacuum oven at 60°C for 2 h for sublimation. A decrease in the weight indicated the end point of sublimation. Tablet hardness was measured with Tablet Tester 6D (Dr. Schleuniger, Thun, Switzerland) and density was determined by dividing weight by volume of a tablet.
Tablets to study the effect of camphor amount on tablet hardness and density were prepared using the identical processes. The compositions were given in .
Table 2. Formulations to evaluate effect of camphor amount on hardness and density of LD-GRT (unit: mg/tablet).
In vitro release study
In vitro release study was performed in 900 mL of simulated gastric fluid without enzyme (pH 1.2 medium) at 37°C using USP dissolution apparatus 2 (DST 810, Labfine Inc., Anyang, Korea) with a rotation speed of 100 rpm. The 5 ml of aliquot was manually collected at pre-determined time points and replaced with an equal volume of fresh dissolution medium. Samples were filtered through PVDF syringe filter (0.45 μm, Puradisc™, Whatman, Kent, UK) then concentration of ITR was measured by HPLC-UV. Results of in vitro release studies were fitted into Higuchi equation (Equation 1) and release rate constants were calculated;
where Qt is the released amount of drug at time t, Q∞ is the released amount of drug at infinite time, k is the release rate constant, n is the exponent and c is an intercept.
Scanning electron microscopy
Morphology of GRT was observed using scanning electron microscope (JSM-7500F, Jeol, Tokyo, Japan). Samples were stuck onto a carbon tape and then coated with a platinum layer by a high resolution precision etching coating system (model No. 682; Gatan Inc., Pleasanton, CA).
Quantitative analysis of residual camphor concentration in DF-GRT containing ITR-SD
The analysis of residual camphor concentration was performed using GC/MS system (6890 gas chromatograph and 5973 mass spectrometer; Agilent Technologies Inc., Santa Clara, CA). The system was equipped with HP-5MS UI column (60 m × 0.25 mm× 0.25 μm; Agilent Technologies Inc., Santa Clara, CA). Camphor standard solution (100 μg/mL) and sample solution (2 mg/mL) was prepared with HPLC grade ethanol. DF-GRT (F11) were pulverized and 20 mg aliquot was added to 10 ml ethanol to prepare sample solution. Samples were calibrated against a standard curve in the range of 0.1–2 μg/mL (r2 = 0.99995). The operating conditions were followings; inlet temperature – 250°C, split ratio – 70:1, velocity – 26 cm/s, flow – 1 mL/min, m/z – 152.
In vivo study
Animals
The animal study was performed in compliance with the regulations of the Institutional Laboratory Animal Resources of Sungkyunkwan University. The experiments were conducted by PWG Genetics Korea, Ltd. (Pyeongtaek, Korea). Six miniature pigs (Micro-pig®) weighing between 14.8 and 16.8 kg (<20 week old) were used in the present study. They were fed with a standard pig diet and allowed free access to tap water.
Pharmacokinetic study of IRT and DF-GRT in miniature pigs
The animals were starved for 12 h prior to the experiment and during the experiments. Two periods of experiment were performed for IRT and DF-GRT (F11) consecutively. The wash-out period between experiments was 1 week. Blood samples were collected from jugular vein of the neck at predetermined time points (0, 1, 2, 3, 4, 5, 6, 8, 10, 12, 16, 24 and 48 h). Samples were collected in tubes with 0.1 mL heparin and centrifuged at 3500 rpm for 10 min. Plasma samples were taken and stored at −40°C until analysis.
Plasma ITR analysis
Plasma ITR concentration was determined using the HPLC-UV method with a few modification (Yoo et al., Citation2000). Internal standard (100 μL of 50 μg/mL miconazole) and 100 μL of pH 10 carbonate buffer were added to 1 mL of plasma sample and vortexed for 30 s. Heptanes and isoamyl amyl alcohol was added to the mixture prior to centrifugation at 3000 rpm for 5 min. The organic phase was transferred to the test tube and was evaporated to dryness under gentle stream of nitrogen at 50°C. The residue was dissolved in mobile phase and vortexed for 2 min and was injected for the HPLC analysis. HPLC analysis was performed as described previously in Section “Quantitative analysis of ITR”, except for injection volume of 200 μL and flow rate of 1.1 mL/min. The standard calibration curves were generated in the range of 3–300 ng/mL and the correlation coefficients (r2) were >0.9957. The pharmacokinetic parameters such as maximum plasma concentration (Cmax), time to reach maximum plasma concentration (tmax), area under the curve (AUC) were analyzed by non-compartmental methods using WinNonlin (Pharsight, St. Louis, MO).
Statistics
All statistical analyses were performed using Student’s t-test with Minitab™ software (release 13.32, Minitab Inc., State College, PA) and p values <0.05 were considered statistically significant.
Results and discussion
Characterization of ITR-SD
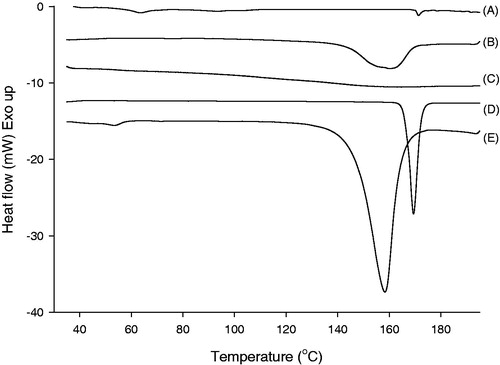
The solubility of ITR in pH 1.2 medium at 48 h was 1.54 ± 0.23 µg/mL and it was enhanced to 248.38 ± 6.26 µg/mL by preparing ITR-SD using spray-drying method (n = 3, mean ± SD). There was no significant change in solubility between time points (24 and 48 h). DSC thermograms of ITR-SD and the physical mixture of ITR, HPMC and citric acid were displayed in . Raw ITR had a significant endothermic peak at 169.4°C and this peak was corresponding to the melting point of ITR (Park et al., Citation2010). In case of ITR-SD, the peak was slightly shifted to 171.3°C and the intensity definitely decreased compared to those of raw ITR. Enthalpy of fusion also decreased from 86.3 (for raw ITR) to 2.62 mJ/mg (for ITR-SD). In thermogram of physical mixture, peaks of ITR and citric acid were shifted and merged. Therefore, a broad peak ranged from 150 to 170°C was detected and it indicated the miscibility of two components.
Figure 2. DSC thermograms of (A) ITR-SD, (B) physical mixture, (C) HPMC, (D) raw ITR substance and (E) citric acid.
As displayed in , sharp peaks in XRD patterns of ITR and the physical mixture indicated that ITR existed in a crystalline form for raw ITR and physical mixture.
Figure 3. XRD patterns of (A) ITR-SD, (B) physical mixture, (C) HPMC, (D) raw ITR substance and (E) citric acid.
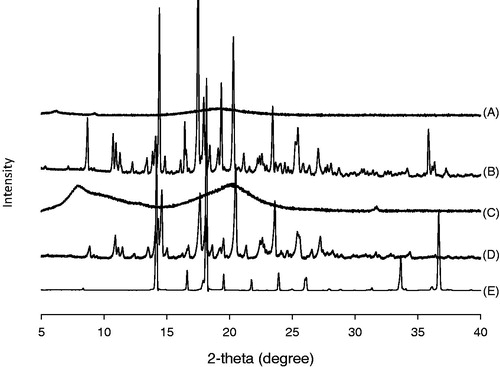
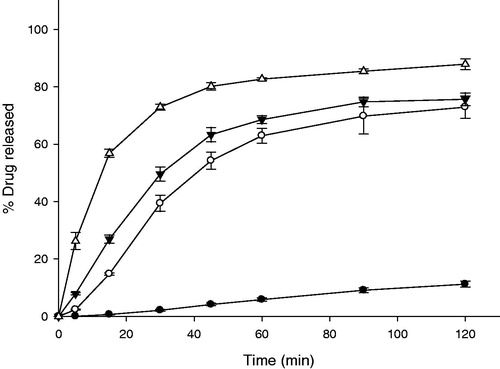
On the other hand, intensity of the peaks were markedly decreased in the case of ITR-SD. Thus, results of both XRD and DSC indicated that crystallinity of ITR in SD form was markedly decreased compared to that of raw ITR. It was supposed that improvement of the solubility of ITR was attributed to decrease in crystallinity of ITR. Release profiles of IRT are displayed in . It was observed that 82.70 ± 0.44% of ITR was released from IRT at 1 h.
Figure 4. Release profiles of IRT and GG-GRT with various amount of gas-generators (n = 3, Mean ± SD) Key •: F1 (without gas generators), ○: F2 (60 mg of NaHCO3 and 30 mg of citric acid), ▾: F3 (120 mg of NaHCO3 and 60 mg of citric acid), △: IRT.
Gas-generating GRT containing ITR-SD
Effect of amount of gas generators in compositions on release profiles of gas-generating GRT (GG-GRT) are displayed in . Released amounts of ITR from F1, F2 or F3 at 30 min was 2.13 ± 0.34%, 39.37 ± 2.78%, 49.60 ± 2.43%, respectively. Released rate constants of GG-GRT tended to increase with increase in amount of gas generators as shown in . All the tablets floated on the medium with lag time of 3–5 min as summarized in . When tablets were placed in the dissolution medium, they sunk toward the bottom of the vessels. At the same time, gas generation began via the reaction among citric acid, sodium bicarbonate and water, which lead to floating and partial disintegrating of the tablets.
Table 3. Physical properties and release rate of tablets containing ITR-SD.
In many floating gastroretentive systems, carbon dioxide was produced by gas generators (e.g. carbonates) and entrapped in polymer matrix, leading to buoyancy (Singh & Kim, Citation2000; Arora et al., Citation2005). In the present study, amount of swellable polymer (HPMC) was insufficient not only to withstand the stress of gas generation but also to entrapped the gas at initial phase of in vitro release study. After partial disintegration of tablets, HPMC was swollen and hydrogel of HPMC around the tablets was established. Thus further disintegration by gas generation was not observed and buoyancy of the tablet lasted until entire erosion of tablet. Thus, larger amount of gas generators produced carbon dioxide further, leading to faster collapse of matrix and faster release of ITR at first 30 min.
Effect of type of cellulose-derived polymers on the release profile of GG-GRT was investigated. Despite different viscosity grade of HPMC, release rates of F3, F4 and F5 were similar as given in and . When HEC was incorporated in F6 to substitute for HPMC, release rate of ITR was increased as shown in . In addition, it was observed that F6 were split into some fragments and sunk to the bottom of vessel within 30 min.
Figure 5. Release profiles of GG-GRT with various cellulose-derived polymers (n = 3, Mean ± SD) Key •: F3 (HPMC 4,000 cP), ○: F4 (HPMC 15,000 cP), ▾: F5 (HPMC 100,000 cP), △: F6 (HEC).
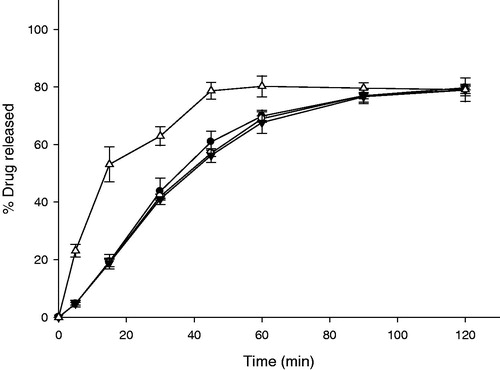
Previously reported, HPMC particles required time for swelling and establishing a gel barrier efficiently in contact with water (Gao et al., Citation1996; Campos-Aldrete & Villafuerte-Robles, Citation1997). Swollen HPMC matrix controls penetration of water into the tablet and thus also controls diffusion out of the drug from the matrix. When HPMC with the higher viscosity grade was incorporated, higher viscous gel barrier of HPMC was established and both penetration rate of water into the matrix and diffusion rate of drug out of the matrix slowed down. In the present study, premature gel barrier of HPMC was partially collapsed due to gas generation in early phase of in vitro release study and tablets turned into HPMC-CO2 floating foam with a core tablet. Thus diffusion pathway of ITR was shortened and then viscosity of HPMC might have little effect on release rate.
It has been reported that HEC shows faster and further swelling property compared to HPMC 100 000 and 4000 cP (Baumgartner et al., Citation2002; Saša et al., Citation2006). As swollen gel of HEC was so fragile that it could not withstand stress of gas generation, fracture of tablet occurred. This caused sinking of F6 as well as faster release of ITR. Therefore HPMC was a better matrix former for GG-GRT.
Low-density GRT containing ITR-SD
As summarized in , GG-GRT (F2-F6) required the lag time ranging from 3 to 5 min to float on dissolution medium. To eliminate the lag time pores in the tablet matrix were generated by sublimation of camphor, which imparted bigger buoyancy to GRT due to lower density. As given in , both density and hardness of low-density GRT (LD-GRT) decreased with increase in amount of camphor in compositions. Considering the high correlation coefficients (0.9974 and 0.9886), it was clear that amount of camphor was in inverse proportion to both density and tablet hardness.
Figure 6. Effect of amount of camphor on density (A) and hardness (B) of LD-GRT (n = 3, Mean ± SD).
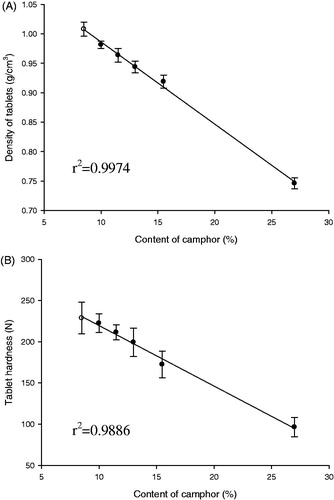
It was observed that >11.3 wt% of camphor ensured buoyancy of tablet on pH 1.2 medium over 12 h (data not shown). When 9.8 wt% of camphor was incorporated, density of tables became <1 g/cm3 while the tablets were not floated on the medium. Tablets had the micro-sized pores generated by camphor sublimation on the surface, water could occupy the pores and interfere buoyancy of the tablets.
It was believed that tablet matrix was loosened by pores after sublimation process, leading to decrease in tablet hardness. Tablet hardness were 96 N with 26.7 wt% of camphor, which meant proper crushing strength level could be achieved after large amount of camphor sublimation. Thus, camphor amount was maintained at 11.3–14.3% as shown in .
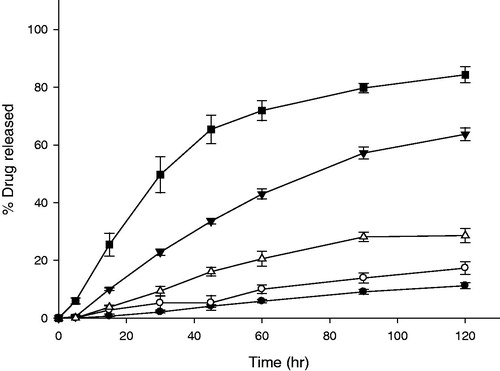
Density of tablets was decreased effectively by camphor sublimation and this imparted enough buoyancy to the tablet. Therefore gas generators were removed from the compositions and LD-GRT were prepared as shown in (F7–F10). A disintegrant, CCS, was used for the release control (F8 and F9). As shown in , released amounts of ITR from F7, F8 and F9 at 2 h were 11.21 ± 1.02%, 17.33 ± 2.23% and 63.73 ± 2.21%, respectively. The formulations floated without any lag time (). Addition of larger amount of CCS increased release rate of LD-GRT due to faster disintegration rate (). It was corresponding to the results of in vitro release studies of GG-GRT (). Although the release rates of F7 and F8 were too low (1.0957 and 1.6507 h−1/2, respectively), the release rate of F9 was 6.5603 h−1/2 and this implied that possibility of release control of LD-GRT by disintegration using CCS instead of gas generators. However, F9 sunk to the bottom of vessels within 30 min in the release study. When HPMC 4000 cP substituted for HPMC 50 cP (F10), release rate decreased because disintegration of the matrix was limited.
Figure 7. Release profiles of LD-GRT (F8-F10) and DF-GRT with both gas-generators and camphor (F11) (n = 3, Mean ± SD) Key •: F7 (30 mg of HPMC 50 cP without CCS), ○: F8 (30 mg of HPMC 50 cP and 7 mg of CCS), ▾: F9 (30 mg of HPMC 50 cP and 15 mg of CCS), △: F10 (30 mg of HPMC 4000 cP, 15 mg of CCS) and ▪: F11 (DF-GRT).
Although density of F9 was lowered by sublimation of camphor, partial disintegration and penetration of water into porous structure of tablets could cause sinking of F9 during the release study. As given in , Buoyancy of GG-GRT (F2–F5) was superior to that of LD-GRT (F9). The results indicated that gas generation can be more effective for tablet buoyancy when these physical changes of GRT occurred.
Dual-mode floating GRT containing ITR-SD
Finally dual-mode floating GRT (DF-GRT) containing both gas generators and camphor (F11) were prepared. Camphor sublimation made DF-GRT float on the medium without lag time by decreasing density of tablet. In addition, gas generators played an important role in maintaining buoyancy of DF-GRT. Release behavior of DF-GRT (F11) and GG-GRT (F5) was compared (n = 12, data not shown). The similarity factor and the difference factor between release profiles of F5 and F11 were 69.27 and 7.65.
The similarity factor and the difference factor are evaluation tools for the determination of equivalence between two in vitro release profiles. If the similarity factor and the difference factor between them ranged from 50 to 100 and from 0 to 15, respectively, they are considered similar (Moore & Flanner, Citation1996; FDA, 1997). Thus in vitro release profiles of F5 and F11 was found to be similar and it was demonstrated that lag time for buoyancy was eliminated by camphor sublimation, which showed no effect on the release profiles.
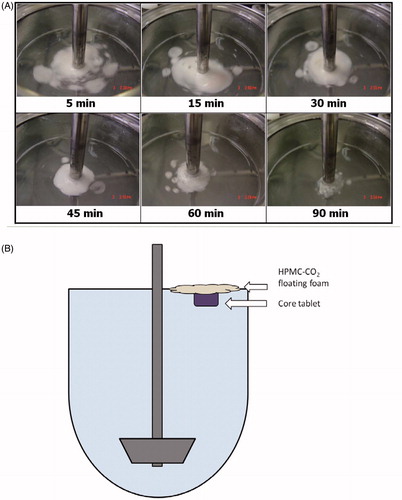
Pictures of DF-GRT (F11) which is comprised of both camphor and gas generators during the in vitro release test are displayed in . F11 floated immediately on the medium and was partially disintegrated due to gas generation. Because of viscosity of HPMC, collapsed fragments formed HPMC-CO2 floating foam around core tablet. F11 floated on the medium until it disintegrated entirely and was chosen for in vivo study.
Figure 8. (A) Images of DF-GRT (F11) during in vitro dissolution test. (B) A diagram of GRT (F11) during dissolution test.
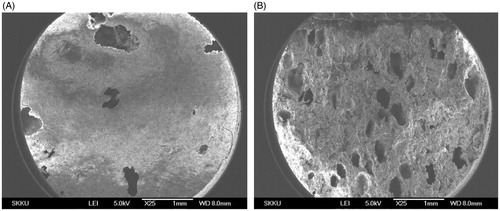
Porous structure of F11 was observed by SEM as shown in . The approximate size of the pores corresponded to size of camphor powder (sieved using #35 mesh, ∼500 μm), which indicated the pores were generated by sublimation of camphor and size of pores could be controlled by modulating size of camphor particles.
Figure 9. (A) Surface and (B) cross-sectional SEM images of DF-GRT (F11) (magnification: ×25, scale bar: 1 mm).
Residual camphor amount in DF-GRT (F11) was quantified using GC/MS and representative chromatograms of camphor standard and sample are given in . Amount of residual camphor in F11 was found to be 560.66 ± 84.27 ppm (n = 3, mean ± SD). It indicates that 99.5 mg (99.5%) of camphor was removed by the sublimation at 60°C for 2 h.
Figure 10. Representative chromatograms of (A) camphor standard solution (1 μg/mL) and (B) sample solution (F11).
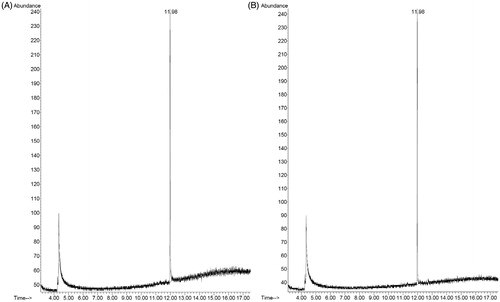
Camphor is a terpenoid which is found in wood of the camphor laurel. Following FDA Code of Federal Regulations (Title 21), it is used as topical antitussive, expectorant and cooling agent in many pharmaceutical products. In particular, it was stated in Japanese Pharmaceutical Excipients that maximum oral dose of camphor was 18 mg as a pharmaceutical excipient (Japanese Pharmaceutical Excipients Council, Citation2004). Thus residual amount of camphor would not be an issue.
Mean plasma concentration versus time curves of DF-GRT (F11) and IRT in miniature pigs are shown in . Pharmacokinetic parameters for both formulations are summarized in . AUC of DF-GRT was 2195.51 ±644.85 ng·h/mL and of IRT was 1609.55 ± 380.26 ng·h/mL. In addition, Cmax of DF-GRT was 124.30 ± 26.12 ng/mL and of IRT was 88.99 ± 12.44 ng/mL. Mean AUC ratio and mean Cmax ratio were 1.36 and 1.40 while AUC and Cmax of both formulations were not significantly different due to variation. Median values of tmax for GRT and IRT were 16.0 and 5.5 h, respectively.
Figure 11. Mean plasma concentration of ITR versus time profiles after oral administration in mini pig model. Key •: IRT, ○: DF-GRT (F11) (n = 6, Mean ± SE).
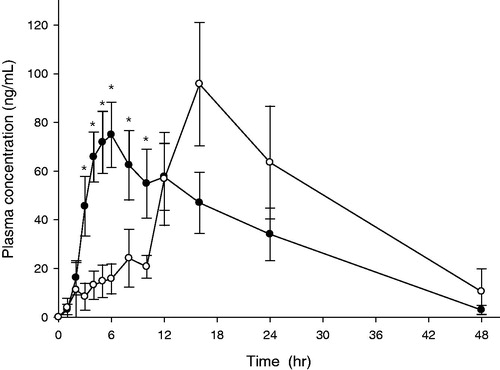
Table 4. Pharmacokinetic parameters for IRT and FD-GRT (F11) containing ITR-SD in the miniature pig model (n = 6, Mean ± SE).
Itraconazole and its hydroxyl metabolite, hydroxyitraconazole (ITR-OH), had antifungal effect in human beings (De Beule, Citation1996). However ITR-OH was not analyzed in the present study because ITR-OH was not detected after administration of ITR and it was considered minor metabolite in miniature pigs (Kaltenbach et al., Citation1996; Cavalier et al., Citation1997). Kaltenbach et al. showed results of pharmacokinetics study of marketed ITR capsule (Sporanox®, Jassen) using miniature pig model. AUC, Cmax and tmax of ITR were 1652.67 ± 297.91 ngċh/mL, 113.00 ± 17.21 ng/mL and 3.67 ± 0.58 h, respectively (data was represented as mean ± SD) (Kaltenbach et al., Citation1996). Compared to the results, pharmacokinetic parameters of DF-GRT and IRT were reliable although the study of Kaltenbach et al. was performed in steady-state and pigs participated were heavier (>20 kg). On the other hand, tmax of IRT was further longer and inter-subject variation was larger in the present study than the reference.
Itraconazole plasma concentration of DF-GRT was lower than IRT by 10 h as given in . During in vitro release tests, disintegration rate of DF-GRT was slower than IRT. IRT were entirely disintegrated within 15 min whereas DF-GRT (F11) were within 120 min. However, it might be misleading to conclude that this difference caused gap between the pharmacokinetic profiles of two different dosage forms for initial 10 h. Instead, it was suspected that disintegration rate of DF-GRT in a stomach was slower than in the release test due to physical characteristic (e.g. movement of stomach or volume of gastric juice) of miniature pigs.
It was found that plasma concentration of DF-GRT was similar to typical sustained-release dosage form. Delayed tmax and increased MRT of DF-GRT than IRT supposed that ITR of DF-GRT was stayed longer in the body and was absorbed slower. Nevertheless, Cmax of DF-GRT was not lower than that of IRT. Therefore it was thought that results indicated the potential of DF-GRT containing ITR.
Conclusions
The present study discussed the preparation and in vitro/in vivo evaluation on DF-GRT containing ITR-SD. The highly porous GRT were prepared by camphor sublimation method, which was a new technique to accomplish buoyancy of GRT. Since density of the dosage form decreased during the sublimation step, GRT did not require any lag time for buoyancy in the release test. Carbon dioxide generated by sodium bicarbonate and citric acid helped to maintain buoyancy of GRT. In the miniature pig model, there was no statistical difference between AUC values of GRT and IRT. However, when compared to pharmacokinetic parameters of IRT, delayed tmax, increased MRT and similar Cmax of DF-GRT supposed potential of gastroretentive drug delivery system containing ITR. Follow up studies are required, such as scintigraphy or X-ray imaging that will assist in estimating the in vivo gastric retention time for the tablets.
Declaration of interest
This study was supported by the grant of the Korean Health Technology R&D Project, Ministry for Health, Welfare & Family Affairs, Republic of Korea (A092018).
References
- Arora S, Ali J, Ahuja A, et al. (2005). Floating drug delivery systems: a review. AAPS PharmSciTech 6:E372–90
- Barone JA, Koh JG, Bierman RH, et al. (1993). Food interaction and steady-state pharmacokinetics of itraconazole capsules in healthy male volunteers. Antimicrob Agents Chemother 37:778–84
- Baumgartner S, Kristl J, Peppas NA. (2002). Network structure of cellulose ethers used in pharmaceutical applications during swelling and at equilibrium. Pharm Res 19:1084–90
- Campos-Aldrete ME, Villafuerte-Robles L. (1997). Influence of the viscosity grade and the particle size of HPMC on metronidazole release from matrix tablets. Eur J Pharm Biopharm 43:173–8
- Cavalier A, Leveque D, Peter JD, et al. (1997). Pharmacokinetic interaction between itraconazole and ceftriaxone in Yucatan miniature pigs. Antimicrob Agents Chemother 41:2029–32
- De Beule K. (1996). Itraconazole: pharmacology, clinical experience and future development. Int J Antimicrob Agents 6:175–81
- Engers D, Teng J, Jimenez Novoa J, et al. (2010). A solid state approach to enable early development compounds: selection and animal bioavailability studies of an itraconazole amorphous solid dispersion. J Pharm Sci 99:3901–22
- FDA (2001). Guidance for Industry: Statistical Approaches to Establishing Bioequivalence. Center for Drug Evaluation and Research
- Gao P, Skoug JW, Nixon PR, et al. (1996). Swelling of hydroxypropyl methylcellulose matrix tablets. 2. Mechanistic study of the influence of formulation variables on matrix performance and drug release. J Pharm Sci 85:732–40
- Hardin TC, Graybill JR, Fetchick R, et al. (1988). Pharmacokinetics of itraconazole following oral administration to normal volunteers. Antimicrob Agents Chemother 32:1310–3
- Hassan HA, Al-Marzouqi AH, Jobe B, et al. (2007). Enhancement of dissolution amount and in vivo bioavailability of itraconazole by complexation with beta-cyclodextrin using supercritical carbon dioxide. J Pharm Biomed Anal 45:243–50
- Hong JY, Kim JK, Song YK, et al. (2006). A new self-emulsifying formulation of itraconazole with improved dissolution and oral absorption. J Control Release 110:332–8
- Jacob J, Carter B, Iampietro M, et al. (2006). Gastroretentive, bioadhesive drug delivery system for controlled release of itraconazole: pharmacokinetics of spherazole™ CR in healthy human volunteers. J Clin Pharmacol 46:1065
- Jain SK, Awasthi AM, Jain NK, Agrawal GP. (2005). Calcium silicate based microspheres of repaglinide for gastroretentive floating drug delivery: preparation and in vitro characterization. J Control Release 107:300–9
- Janssen. (2006). Prescribing information. Availalble at: http://www.sporanox.com
- Japanese Pharmaceutical Excipients Council. (2004). Japanese Pharmaceutical Excipients, Yakuji Nippo, Tokyo, Japan
- Jung JY, Yoo SD, Lee SH, et al. (1999). Enhanced solubility and dissolution rate of itraconazole by a solid dispersion technique. Int J Pharm 187:209–18
- Kaltenbach G, Leveque D, Peter JD, et al. (1996). Pharmacokinetic interaction between itraconazole and rifampin in Yucatan miniature pigs. Antimicrob Agents Chemother 40:2043–6
- Kapsi SG, Ayres JW. (2001). Processing factors in development of solid solution formulation of itraconazole for enhancement of drug dissolution and bioavailability. Int J Pharm 229:193–203
- Lee KH, Park E-S, Chi S-C. (2005). Composition comprising itraconazole for oral administration. WO Patent WO/2005/099,708
- McKinsey DS, Wheat LJ, Cloud GA, et al. (1999). Itraconazole prophylaxis for fungal infections in patients with advanced human immunodeficiency virus infection: randomized, placebo-controlled, double-blind study. National Institute of Allergy and Infectious Diseases Mycoses Study Group. Clin Infect Dis 28:1049–56
- Moore JW, Flanner HH. (1996). Mathematical comparison of dissolution profiles. Pharm Technol 20:64--74
- Odds FC, Oris M, Van Dorsselaer P, Van Gerven F. (2000). Activities of an intravenous formulation of itraconazole in experimental disseminated Aspergillus, Candida, and Cryptococcus infections. Antimicrob Agents Chemother 44:3180–3
- Oh T-O, Kim J-Y, Ha J-M, et al. (2012). Preparation and in vivo evaluation of highly porous gastroretentive metformin tablets using a sublimation method. Eur J Pharm Biopharm 83:460–7
- Park YJ, Xuan JJ, Oh DH, et al. (2010). Development of Novel Itraconazole-loaded Solid Dispersion without Crystalline Change with Improved Bioavailability. Arch Pharm Res 33:1217–25
- Saag MS, Dismukes WE. (1988). Azole antifungal agents: emphasis on new triazoles. Antimicrob Agents Chemother 32:1–8
- Saša B, Odon P, Stane S, Julijana K. (2006). Analysis of surface properties of cellulose ethers and drug release from their matrix tablets. Eur J Pharm Sci 27:375–83
- Singh BN, Kim KH. (2000). Floating drug delivery systems: an approach to oral controlled drug delivery via gastric retention. J Control Release 63:235–59
- Streubel A, Siepmann J, Bodmeier R. (2003). Floating matrix tablets based on low density foam powder: effects of formulation and processing parameters on drug release. Eur J Pharm Sci 18:37–45
- Van Cutsem J, Van Gerven F, Van de Ven MA, et al. (1984). Itraconazole, a new triazole that is orally active in aspergillosis. Antimicrob Agents Chemother 26:527–34
- Woo JS, Song YK, Hong JY, et al. (2008). Reduced food-effect and enhanced bioavailability of a self-microemulsifying formulation of itraconazole in healthy volunteers. Eur J Pharm Sci 33:159–65
- Wu C-Y, Benet LZ. (2005). Predicting drug disposition via application of BCS: transport/absorption/elimination interplay and development of a biopharmaceutics drug disposition classification system. Pharm Res 22:11–23
- Yoo SD, Kang E, Jun H, et al. (2000). Absorption, first-pass metabolism, and disposition of itraconazole in rats. Chem Pharm Bull (Tokyo) 48:798–801
- Zhou H, Goldman M, Wu J, et al. (1998). A pharmacokinetic study of intravenous itraconazole followed by oral administration of itraconazole capsules in patients with advanced human immunodeficiency virus infection. J Clin Pharmacol 38:593–602
- Zimmermann T, Yeates RA, Laufen H, et al. (1994). Influence of concomitant food intake on the oral absorption of two triazole antifungal agents, itraconazole and fluconazole. Eur J Clin Pharmacol 46:147–50