
Abstract
Thiocolchicoside (TCC) is an effective therapeutic agent against the orthopaedic, traumatic and rheumatologic disorders but it suffer from the drawback of poor bioavailability due to extensive first pass metabolism and low permeability via the oral route. The aim of the present study was to evaluate the potential of nanoemulsion (NE) for bioavailability enhancement of TCC through the transdermal route. The NEs were developed using Linseed: sefsol in 1:1 ratio as the oil phase, span 80, Transcutol P and distilled water as surfactant, co-surfactant and aqueous phase. Furthermore, selected formulations were subjected to physical stability and consequently evaluated for in vitro permeation using porcine skin. The optimized formulation had small average globule diameter of 117 nm with polydispersity index of 0.285. The globules were spherical in shape as observed by transmission electron microscopy. The in vitro skin permeation profile of optimized NE was compared with aqueous solution of TCC. Significant increase in permeability parameters were observed in NEs formulation (p < 0.05) as compared to aqueous solution of TCC. The steady-state flux (Jss) and permeability coefficient (Kp) for optimized NE formulation (C1) were found to be 30.63 ± 4.18 µg/cm2/h and 15.21 × 10⁻³ ± 2.81cm2/h, respectively. The results of enhanced permeation through transdermal route suggest that water-in-oil NEs which are compatible with the lipophilic sebum environment of the hair follicle facilitate the transport of TCC, and such transport might be predominantly transfollicular in nature. Overall, these results suggested that water-in-oil NEs are good carriers for transdermal delivery of TCC.
Introduction
Thiocolchicoside (TCC) is a semisynthetic sulfur derivative of colchicoside, a natural glycoside present in a plant Gloriosa superba. TCC has been used from the last 35 years as anti-inflammatory, analgesic and muscle relaxant drug. Due to these properties, it is extensively prescribed for the treatment of orthopaedic, traumatic and rheumatologic disorders. TCC is administered orally, intramuscularly or topically for the symptomatic treatment of rheumatologic disorders (Janbores, Citation1987).
TCC oral daily dose is 8 mg, which shows 25% oral relative bioavailability in comparison to intramuscular administration and the reason for poor bioavailability is mainly due to the hepatic first pass metabolism (Sandov et al., Citation1994). TCC suffers from poor permeation and extensive first pass metabolism. In the present study the use of nanoemulsion (NE) was explored to enhance the permeation through the skin Shen et al. (Citation2011). Transdermal route has been used to bypass the liver and subsequently increase the bioavailability.
Transdermal administration of drug molecule is considered to have numerous clinical benefits, such as avoiding the first pass metabolism, improvement in patient compliance and reduction in adverse effects (Prausnitz & Langer, Citation2011). Despite the barrier function of skin, small lipophilic molecules are easily administered through the skin, but it is difficult to administer hydrophilic drugs, proteins and peptides that are in the market or under development. Recently, however, a new delivery formulation has been described that overcomes most of the problems associated with transdermal delivery of hydrophilic drugs proteins and peptides. This technology utilizes the ability of water-in-oil NEs effectively to “hide” water-soluble molecules within an oil layer, which can then be used to “smuggle” water-soluble molecules such as hydrophilic drugs though the epidermis into the dermal layer, in a similar fashion to the way in which “vanishing creams” vanish when applied topically (Gregory & Himes, Citation2011).
Water-in-oil (w/o) NE, a class of nanosystem with droplet size of 20–200 nm have been reported to prolong the release for hydrophilic drugs with the oil and interfacial layer acting as release barriers (Ramachandran et al., Citation2001; Wang et al., Citation2008; Hwang et al., Citation2009). NEs have been shown to have a highly favorable drug delivery potential, which may be attributed to both their excellent solubility properties as well as the possible permeation enhancement as the small droplets of NEs provide a large surface to volume ratio, favoring close contact with the skin, thus providing high-concentration gradient and improved substance permeation. Also the low surface tension ensure better adherence to the skin and disperse phase act as a reservoir making it possible to transport bioactive molecules in a more controlled fashion (Elena et al., Citation2001; Kong et al., Citation2011).
The objective of the present study was to prepare novel NE formulation for transdermal delivery of TCC with increased permeability of drug through the skin subsequently leading to improved bioavailability. The anti-inflammatory activity of TCC has also been potentiated due to the use of oils having anti-inflammatory activity.
Materials and methods
Materials
TCC was obtained as a gift sample from Zydus Cadila (Ahmedabad, India). Linseed oil was received as a kind gift from Expo essential oil (New Delhi, India). Fish oil was a gift sample from Coastal exports (Mangalore, India). Propylene glycol mono caprylic ester (sefsol) was purchased by Nikko Chemicals (Tokyo, Japan). Jojoba oil and caproyl macrogol-8-glyceride (Labrasol) were kindly gifted from Gattefossé (St.Priest, France), poly-oxyethylene vegetable oil ether (Unitop 100) was obtained as a kind gift sample from Unitop Chemicals Pvt. Ltd. (Mumbai, India). Span 80 and Tween 80 were purchased from CDH (Mumbai, India). Olive oil and PEG 400 was purchased from Merck Limited (Mumbai, India). Polyglyceryl-6-dioleate (Plurol Oleique) and diethylene glycol monoethyl ether (Transcutol P) were purchased from Gattefosse (France). Water was taken from Milli-Q water purification system (Millipore, Billerica, MA). All other chemicals used in the study were of analytical reagent grade.
Analytical methodology
The TCC estimation was performed using a reported reverse phase high performance liquid chromatography (HPLC) method. The analysis was carried out on a LiChrospherR C18 (150 mm × 4.6 mm i.d., 5 μm particle size; Merck, India) column. The mobile phase used was acetonitrile: water (15:85). The flow rate was 1 ml/min. The detection was performed at 370 nm. The eluent were filtered (pore size, 0.45 μm) before use and then degassed by sonication in an ultrasonic bath. The assays were performed at ambient temperature (25 °C).
Formulation, development and optimization
Screening of excipients
The important criterion for selection of the materials was that the components are falls under GRAS (Generally regarded as safe) category. Only oils which had good anti-inflammatory properties were chosen for the screening of oils like linseed oil, fish oil, olive oil and jojoba oil. The solubility of TCC in these oils was determined by dissolving excess of TCC in 2 ml of all oil in 5 ml capacity stopper vials separately and mixed for 10 minutes using a vortex mixer (Nirmal International, New Delhi, India). The mixture vials were then kept at 37 °C ± 1 °C in an isothermal shaker bath (Nirmal International, New Delhi, India) for 72 h to get to equilibrium. The equilibrated samples were removed from the shaker and centrifuged at 5000 rpm for 15 minutes. Supernatant was taken and filtered through a 0.45 µm member filter. The concentration of TCC was determined in each oil spectrophotometrically at the wavelength of 259 nm Acharjyask et al. (Citation2010). For the selection of surfactant and co-surfactant, miscibility of oil having maximum solubility of TCC was done with a numbers of surfactants.
Construction of pseudoternary phase diagrams
Oil titration method was used for the development of pseudoternary phase diagram, which involves stepwise addition of oil phase to each weigh ratio of water with surfactants, co-surfactant and then mixing the components with the help of vortex mixer at 25 °C. Surfactant and co-surfactant were mixed in different weigh ratios 1:0, 1:1, 1:2, 2:1, 3:1, 4:1 with increasing amount of cosurfactant with respect to surfactant for the detailed study of phase diagram. Sixteen different combination of water and Smix (1:9,1:8,1:7,1:6,1:5,1:4,1:3.5,1:3,3:7,1:2,4:6,1:1,6:4,7:3,8:2 and 9:1) were made so that the maximum ratio should be covered for the study to delineate the boundaries of the phases formed precisely in the phase diagram. The mixture of water, surfactant and co-surfactant at certain weight ratios were titrated with oil under moderate stirring. After being equilibrated, the mixtures were assessed visually for transparent w/o NE. The physical state of NE was marked on a pseudoternary phase diagram with one axis representing the aqueous phase, the other representing the oil phase and third representing a mixture of surfactant and co-surfactant at a fixed weigh ratio (Smix).
Preparation of TCC-loaded NE formulation
From each phase diagram constructed different formulations were selected from NE region for incorporation of drug into the aqueous phase. The criterion for the selection was based on the following points.
The formulation having water concentration such that it could dissolve desired concentration of TCC easily without any precipitation
It was also considered that the amount of Smix should be minimal so that it does not cause irritation on the skin during application.
Physical stability study
In order to overcome the problem of metastable and unstable formulations, physical stability tests were performed (Kumar et al., Citation2012; Sharma et al., Citation2011). Selected formulations were subjected to three physical stability tests like heating and cooling cycles, freeze thaw cycle and centrifugation. Heating cooling cycles was performed between 45 °C and at room temperature (25 °C ± 2 °C) with storage time of 24 h at each temperature (six cycles each).
Freeze thaw cycle at −20 °C ± 2 °C in a deep freezer (Vest-fwst, Hyderabad, India) and at room temperature (25 °C ± 2 °C) for 24 h were carried out six times followed by centrifugation at 5000 rpm for 20 min.
Characterization of NE
Droplet size analysis
Droplet size analysis of the NEs was determined by photon correlation spectroscopy using Zetasizer Nano ZS90 (Malvern Instruments, Worcestershire, UK) at 633 nm, which is based on the principle of dynamic light scattering. The measurements were performed using a He–Ne laser at 633 nm by using Avalanche photo diode detector. Light scattering was monitored at 25 °C at a scattering angle of 90°. The formulation was filtered through 0.22 µm membrane filter in order to eliminate multiscattering phenomena and experimental errors. Droplet size distribution studies were performed at refractive index 1.481, viscosity 5.0 PaS and dielectric constant 79.4.
Viscosity determination
Brook-field DV III ultra V6.0 RV cone and plate rheometer (Brook-field Engineering Laboratories, Inc, Middleboro, MA) with spindle # CPE40 at 25 ± 0.5 °C was used for the determination of viscosity of the formulations. The optimized parameters used were: Sample size/wt: 0.5 g, Speed: 30 rpm, Data interval: 1.0, Loop start: 1, Wait time: 30 min, Temperature: 25 ± 0.3 °C, Shear rate: 60 s−1.
Refractive index and pH
Refractive index of formulation was determined using an Abbe type of refractometer (Precision standard Testing equipment Corporation, New Delhi, India) which was calibrated using castor oil prior to use. The pH was determined for the optimized NEs by using a calibrated digital pH meter (Mettler Toledo MP 220, Greifensee, Switzerland) in triplicate at room temperature.
Surface morphology by transimmision electron microscopy
Morphology and structure of the TCC-loaded NE were studied using Morgagni 268D transmission electron microscopy (TEM) (FEI, Merignac Cedex, Netherland) operating at 70 KV and capable of point to point resolution. Combinations of bright field imaging at increasing magnification and diffraction modes were used to reveal the form and size of NE droplets. In order to perform the TEM observations, a drop of NE was applied on carbon coated grid with 2% phosphotungstic acid (PTA) and was left for 120 s. The dried coated grid was taken on a slide and covered with a cover slip. The slide was observed under the electron microscope.
In vitro skin permeation studies
In vitro skin permeation studies were performed on an automated Franz diffusion cell (SFD 6, Logan Inst, Avalon, NJ) with an effective diffusion area of 1.76 cm2 and 11 ml of receiver chamber capacity using porcine abdominal skin. Porcine skin is frequently used in vitro studies as it mimics the human skin and shows similar penetration for topically applied substance (Schaefer & Redelmier, Citation1996; Kieffer et al., Citation2000; Simon & Molibach, Citation2000; Schmook et al., Citation2001). Cadaver of pigs aged less than a week were collected and kept at 0 °C within 12 h of death. The full-thickness porcine skin was excised from the abdominal region, and subcutaneous fat and other extraneous tissue adhering to the dermis were completely removed and trimmed by forceps and scissors. Pieces of fresh full-thickness skin were immersed in water at 58 °C for 2 min after which the epidermis was carefully separated from the dermis with a spatula. Pieces of skin were wrapped individually in ParafilmTM and maintained at −20 °C ± 2 °C until use and were stored for no longer than a period of 2 months (Yannic et al., Citation2005). The skin was brought to room temperature and mounted between the donor and receiver compartment of the Franz diffusion cell, where the stratum corneum (SC) side faced the donor compartment and the dermal side faced the receiver compartment. Initially the donor compartment was empty and the receiver chamber was filled with phosphate buffer pH 7.4. The receiver fluid was stirred with a magnetic rotor at a speed of 100 rpm and the temperature was maintained at 32 °C ± 1 °C. All the receiver fluid was replaced every 30 min to stabilize the skin. It was found that the receiver fluid showed negligible absorbance after 4.5 h and beyond indicating complete stabilization of the skin. After complete stabilization of the skin, 1 ml of NE formulation and 1 ml of TCC aqueous solution (containing 2 mg of TCC) were placed into each donor compartment and sealed with paraffin film to provide occlusive conditions. Samples were withdrawn at regular intervals (0.5, 1, 2, 3, 6, 12 and 24 h), filtered through a 0.45 μm membrane filter, and analyzed for drug content by HPLC.
Permeation data analysis
The cumulative amount of TCC permeated through the porcine skin (Q, µg/cm2) was plotted as a function of time (t, h) for each formulation. The permeation rate (flux) at the steady-state (Jss, µg/cm2/h) was calculated from the slope of the linear portion of graph plotted between the cumulative amount of TCC permeated per unit area of skin versus time at steady-state condition, respectively. Permeability coefficient (Kp) was calculated by dividing the flux with initial drug concentration (Co) in the donor portion of cell as given below:
Enhancement ratio (Er) was calculated by dividing the Jss of respective formulation with Jss of control formulation by using the equation
Assessment of skin permeation
The structural and chemical change in epidermal layer of skin was determined by Fourier transform infra-red spectroscopy (FTIR), differential scanning calorimetry (DSC), histopathological study and confocal study (CLSM).
FTIR spectral analysis of NE-treated and -untreated porcine skin
SC was cut into small circular discs. 0.9% w/v solution of sodium chloride was prepared and 0.01% w/v sodium azide was added as antibacterial and antimycotic agent. 35 ml of 0.9% w/v of sodium chloride solution was placed in different conical flasks and SC of approximate 1.5 cm diameter was floated over it for 3 days. After 3 days of hydration, these discs were thoroughly bloted over filter paper and FTIR spectra of each SC disc was recorded and this was taken as control. It was scanned in the frequency range of 400 to 4000 cm−1 (Perkin Elmer, Rodgau, Germany). After taking FTIR spectra, the same discs were dipped into TCC NE formulation. This was kept for a period of 24 h (equivalent to the permeation studies) at 37 ± 2 °C. Each SC disc after treatment was washed, blotted dry, and then air dried for 2 h. Samples were kept under vacuum in desiccators for 15 min to remove any traces of formulation completely. FTIR spectra of treated SC discs were recorded again. Each sample served as its own control.
DSC studies of NE treated and untreated porcine skin
Approximately 15 mg of freshly prepared SC was taken and hydrated over saturated potassium sulfate solution for 3 days. Then the SC was blotted to get hydration between 20 and 25%. Hydrated SC sample was dipped into NE formulation present in 35 ml of phosphate buffer pH 7.4. This was kept for 24 h (equivalent to the permeation studies) at 37 ± 2 °C. After treatment, SC was removed and blotted to attain hydration of 20–25%, cut (5 mg), sealed in aluminum hermetically sealed pans and equilibrated for 1 h before the differential scanning calorimeter (DSC) run. Then, the SC samples were scanned on a DSC6 Differential Scanning Calorimeter (Perkin Elmer, Germany). Scanning was done at the rate of 5 °C/min over the temperature range of 30 °C to 200 °C.
Histopathological examination of skin specimen
Abdominal skin of porcine was treated with optimized TCC NE in PBS (pH 7.4). After 24 h, the skin samples from treated and untreated (control) areas were taken. Each specimen was stored in 10% formalin solution in phosphate-buffered saline (pH 7.4). The specimens were cut into sections vertically. Each section was dehydrated using ethanol, embedded in paraffin for fixing and stained with haematoxylin and eosin. These samples were then observed under light microscope (Motic, Tokyo, Japan) and compared with the control sample. In each skin sample, three different sites were scanned and evaluated.
Confocal laser scanning microscopy study
To visualize the path of NE permeation in vitro pre-treated hairless porcine skin samples were taken after 2, 6 and 12 h. These samples were treated with 1 ml of TCC-loaded NE formulation in which 1% of rhodamine b was loaded in the aqueous phase. CLSM study was performed to scan the fluorescence signal of rhodamine b at different skin depth. About 1% solution of rhodamine b in water was applied on porcine skin and it was considered as control. For CLSM study, the in vitro skin permeation study was carried out as mentioned in the section “In vitro skin permeation studies”. After 2, 6 and 12 h, the skin was removed and washed with distilled water. The treated area was cut out and tested for probe penetration (Schaefer & Redelmier, Citation1996; Schmook et al., Citation2001). The excised nude porcine skin was positioned on the microscopic slide with the SC side facing the cover glass. CLSM was carried out with the Laser Confocal Microscope with Fluorescence Correlation Spectroscope-Olympus FluoView FV1000 (Olympus, Melville, NY) with an argon laser beam with excitation at 488 nm and emission at 590 nm (blue-yellow-red region). Each skin sample was sliced in sections of 6–10 μm thickness through the z-axis by CLSM. The TCC with the rhodoamine b intensity and the permeated depth were detected by CLSM with Fluoview software (Olympus, Melville, NY) (Ahad et al., Citation2012).
Results and discussion
Screening of NE components
The solubility of TCC was determined in various oils having anti inflammatory activity. TCC showed highest solubility in combination of Linseed oil and sefsol in 1:1 ratio (18.42 ± 2.32 mg/ml) and therefore this combination was selected as the oil phase for the development of the optimal NE formulation of TCC. The TCC is a hydrophilic drug, therefore its solubility in aqueous phase is more important than the oil phase for formulating w/o NE. Linseed oil possess anti-inflammatory activity as it contains significant amount of omega 3 fatty acid including α-linolenic acid (ALA;18 n-3) which gets converted in human body to eicosapentaenoic acid (EPA). EPA acting as a competitive inhibitor of arachidonic acid (AA) converts to PGE2 and LTB4, and leads to decreased synthesis of one or both of these eicosanoids and, thus, helps in reducing inflammation (James & Gibson, Citation2000; Basch et al., Citation2007). Sefsol is a solubilising agent which helped in increasing the solubility of TCC in linseed oil.
Moreover, the surfactant selected must be able to decrease the interfacial tension to very small value and help in the dispersion process during the preparation of the NE. It should be able to provide a flexible film that can readily deform around the droplets and be of an appropriate hydrophilic character to provide the correct curvature at the interfacial region for the desired NE type (w/o). The right blend of low and high HLB surfactants leads to the formation of a stable NE formulation (Craig et al., Citation1995). For getting the larger area of NE in pseudoternary phase diagram, the miscibility of oil phase with surfactant and co-surfactant is very important. Therefore, the miscibility of oil phase was performed with different surfactant and co-surfactant (). On the basis of miscibility study, span 80 and transcutol P were selected as surfactant and co-surfactant, respectively. Span 80 has a HLB value of 4.3. Transient negative interfacial tension and fluid interfacial film are rarely achieved by the use of single surfactant, usually necessitating the addition of a co-surfactant. The presence of co-surfactant decreases the bending stress of interface and provides the interfacial film sufficient flexibility to take up different curvatures required to form NE over a wide range of composition (Kawakami et al., Citation2002). Thus, the cosurfactant selected for the study was Transcutol-P that again is nonionic having a HLB value of 4.2.
Table 1. Miscibility of oil phase with the surfactant and co-surfactant (1:1 ratio).
Phase diagram studies
The aim of the construction of pseudo-ternary phase diagram was to find out the existence range of NE. For the development of pseudoternary phase diagram, linseed oil: sefsol (1:1) was selected as an oil phase, Span 80 as surfactant, and Transcutol P as a cosurfactant. Pseudoternary phase diagrams () were constructed separately for each Smix (surfactant to cosurfactant ratio). The area of NE region changed slightly as the ratio of surfactant in Smix was increased. A w/o NE region was found towards the oil-rich apex of the phase diagram (Baboota et al., Citation2007).
Figure 1. Pseudoternary phase diagram of NEs.
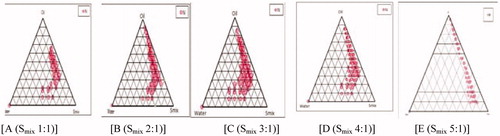
In , the Smix ratio 1:1 () had a small NE area indicating smaller emulsification of oil phase, implying that the Smix was not able to reduce the interfacial tension of the oil droplets to sufficiently low level desired to produce NE. As the surfactant concentration was increased in Smix ratio 2:1 () and in Smix 3:1 (), a higher NE region was observed, perhaps because of further reduction in interfacial tension, increased fluidity of the interface, thereby increased entropy of the system. When Smix 4:1 was studied, NE region decreased slightly as compared to 3:1 and it might have been due to the reduction of interfacial tension up to lower level. With a further increase in surfactant concentration (Smix 5:1), the interfacial tension of interfacial film increased as compared to above and more gel area and less NE area was observed, which might have been due to the presence of insufficient amount of co-surfactant for emulsification. No NE regions were found in Smix ratios of 1:2 and 1:3.
Selection of formulation from phase diagram
From the pseudo ternary phase diagrams Smix ratios 1:1, 2:1 and 3:1 showed larger area, so formulations with different composition were selected. Almost entire range of NE occurrence in the phase diagrams were covered and different water compositions with minimum surfactant and maximum oil concentration showing NE existence were selected. The water concentration was such that it dissolved the drug easily. The surfactant concentration was chosen so that it gave the maximum flux, which is an important criteria but concentration was taken to keep the concentration low so that it did not cause any irritation to the skin on application. For the preparation of drug-loaded NE, 2 mg of TCC was incorporated in the aqueous phase. Therefore, from each phase diagram NE formulations containing different concentration of water were selected which contained minimum to maximum Smix concentration ().
Table 2. Composition of various TCC-loaded NEs.
Physical stability studies
NEs have been reported to be thermokinectically stable systems which are produced at a particular concentration of oil, surfactant/co-surfactant and water, with no phase separation, creaming or cracking. NE formulations selected from phase diagram () were subjected to stress stability testing such as centrifugation, freeze thaw cycle and heating cooling cycle. In physical stability testing some formulations became turbid and in some phase separation occurred. One reason of this instability in NE may be due to the Ostwald ripening in which molecules move as a monomer and coalescence of small droplets takes place, resulting in the formation of large droplets by diffusion processes driven by the gain in surface-free energy. The other reason may be that when temperature quench occurs during stress stability study, instability of NE occurs due to separation of oil phase and droplet distribution of smaller size is favored by the change in curvature free energy (Tadros et al., Citation2004). Only those formulations, which showed no phase separation, creaming, cracking, coalescence and phase inversion during stress stability tests, were selected for further studies ().
Table 3. Physical stability studies of TCC-loaded NE.
Characterization of NE
Formulation which passed the physical stability test was evaluated for droplet size, polydispersity index, viscosity, refractive index, pH and surface morphology.
Droplet size
The main objective of this study was to determine the size of w/o NE droplets. All NE were formed by keeping a surfactant oil ratio constant with different concentration of water. W/O NE with droplets size between 100 and 170 nm were obtained. The droplet size increased when water concentration increased. The average droplet size and polydispersity index of the formulation (C1) was found to be 117 nm and 0.285, respectively, indicating nano ranges of droplets with minimum variation in particle size.
Refractive index, pH and viscosity of NE
Refractive index basically signifies the chemical interaction among the drug and excipients, and indicates the isotropic nature of NE. No significant difference between the refractive index of placebo (1.473) and drug-loaded NE was observed, so it was concluded that the NE formulations were chemically stable and remained isotropic in nature, thus showing no interaction between excipient and drug. The values of refractive index of all formulations were similar to the refractive index of oil phase (Linseed: sefsol oil) (1.479), which indicated that developed NEs were of w/o type. pH of the formulations which are applied topically must not be too high or low as it leads to skin irritation. pH of the formulations were found to be in the range of 5.15–5.42, which was very close to skin pH (pH 4.5–5.5). It was found that viscosity of the formulation depends upon the amount of surfactant and co-surfactant mixture. As the amount of Smix decreased in a formulation, viscosity also decreased.
Surface morphology by TEM
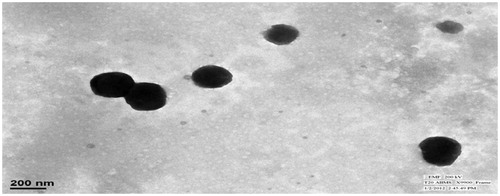
The TEM studies were carried out to get more insight about the morphology of the NE system. NE consisted of spherical globules with diameter ranging from 100 to 170 nm and appeared dark with bright surroundings ().
Figure 2. TEM image of formulation C1.
In vitro skin permeation studies
The permeation of TCC across the porcine skin was investigated from NE formulations using automated Franz diffusion cell (SFD 6, Logan Inst, Avalon, NJ). In vitro skin permeation studies were performed to compare the permeation of TCC from different NE formulations and aqueous solution of TCC (control) all having same quantity (2 mg) of TCC. A steady increase in the concentration of TCC was observed in the receptor chamber with time. Statistical comparison of the flux throughout 24 h showed that the NE preparation of TCC provided flux higher than the control which had low cumulative amount of TCC at 24 h after the application. All the NEs formulations showed better results as compared to control because of small globule size and existence of TCC in molecular level in the form of NE. In vitro skin permeation profile of C1 was significantly different from other NE formulations due to lowest droplet size. NE acted as drug reservoirs, where drug was released from the inner phase to outer phase and then further into the skin (Shakeel et al., Citation2007) ().
Table 4. Mean droplet size. polydispersity index, viscosity, refractive index and pH of NE formulation.
Permeation data analysis
The graph between cumulative amount of TCC permeated and time was plotted for each NE formulation (). Permeability parameters like permeation rate at the steady state (flux), Kp and Er were significantly increased in NE as compared to the control as shown in . The permeability parameters were significant for formulation C1 as compared to other formulation. Er was found to be highest (5 times) in formulation C1 compared to other formulations. The value of Jss and Kp for formulation C1 was found to be 30.63 ug/cm2/h and 15.32 cm/h2 and could have been due to the presence of permeation enhancers such as transcutol P (, ).
Figure 3. In vitro skin permeation profile of TCC from different w/o NEs and aqueous solution of TCC (control).
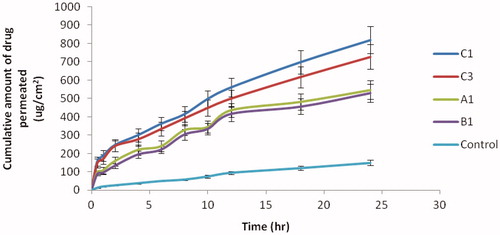
Table 5. Permeability parameters for different formulations.
Assessment of skin permeation mechanisms
FTIR analysis
The thin cross-section of the SC allows an intact sheet of SC to be analyzed by FTIR. The resulting spectrum is typified by absorbance originating from lipids, proteins and water. These absorption bands were due to the C–H stretching of the alkyl groups present in both proteins and lipids. The bands at 2920 cm−1 and 2850 cm−1 were due to the carbon–hydrogen stretching modes, respectively. The bands at 2955 cm−1 and 2870 cm−1 were due to the asymmetric and symmetric CH3 vibrations respectively (Babua and Pandit, Citation2005). They are the excellent indicator of the conformational status of long alkyl chains of ceramides, cholesterol and fatty acids, which are the major components of the SC lipids.
Two strong bands at 1634 cm−1 and 1547 cm−1 were due to amide I and amide II stretching vibrations of SC proteins. The amide I bands arise from C–O stretching vibration and amide II bands from C–N bending vibration. The amide I band indicates the conformation of amide linkage in proteins and lipids, representing various secondary structures of keratin.
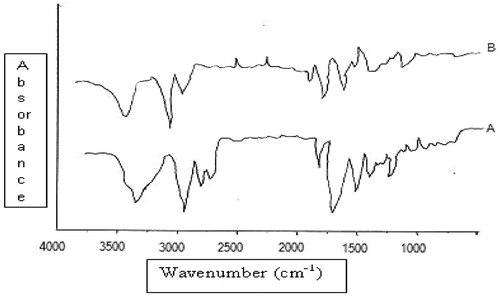
There was clear difference in the FTIR spectra of untreated and NE treated SC with prominent decrease in asymmetric and symmetric CH-stretching of peak height was shown in . Moreover, the rate limiting step for transdermal delivery is lipophilic part of SC in which ceramides are tightly packed as bilayer due to hydrogen bonding. Amide group of ceramides are attached to each other by hydrogen bonding and form a tight network of hydrogen bonding at the head of ceramides. These networks of hydrogen bond impart stability and provide strength to lipid bilayers, hence barrier property of SC. When skin was treated with NE, it disrupted hydrogen bonding between ceramides leading to breaking of hydrogen bonding network at the head of ceramides due to the penetration of NE into the lipid bilayers of the SC (Shakeel et al., Citation2008). The tight hydrogen bonding between ceramides caused split in the peak at 1650 cm−1(amide I), as shown in the formulation treated skin spectrum. Treatment with NE resulted in minimization of peak, which suggested breaking of hydrogen bonds by NE ().
Figure 4. FTIR Analysis of porcine skin. Change in lipid & amide vibrations after 24 h treatment with (A) control andf (B) NE.
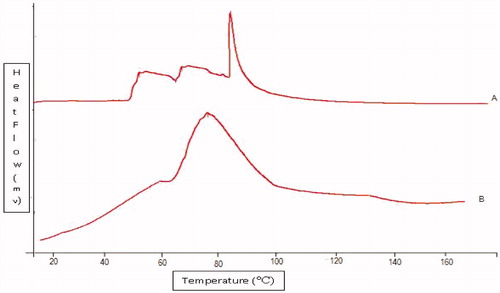
DSC studies
DSC thermogram of untreated porcine SC revealed three endotherms. The three endotherms recorded at 60 °C (T1), 75 °C (T2) and 95 °C (T3) are due to intercellular lipid, a lipid–protein complex associated with the corneocyte membrane and intercellular keratin, respectively (Babita1 et al., Citation2006). It was observed that both T1 and T2 endotherms completely disappeared in thermograms of SC treated with NE formulation. This indicated that the components of NE enhanced skin permeation of TCC through disruption of lipid bilayers. NE formulation also decreased the endotherm T3 to lower melting point (78 °C), suggesting keratin denaturation and possible intracellular permeation mechanism in addition to the disruption of lipid bilayers was shown in . Thus, it was concluded that the intracellular transport is a possible mechanism of permeation enhancement of TCC (Veddi & Chan, Citation2002) ().
Figure 5. DSC thermogram of control SC and NE treated SC for 24 h. (A) control (B) NE.
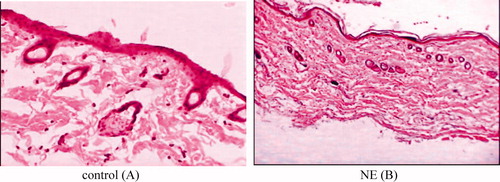
Histopathological studies
The photomicrographs of untreated porcine skin (control) showed normal skin with well-defined epidermal and dermal layers. Keratin layer was well formed and lied just adjacent to the top most layer of the epidermis. Dermis was devoid of any inflammatory cells. Skin appendages were within normal limits (). When the skin was treated with NE formulation (C1) for 24 h, definite changes were observed in the skin morphology. The disruption and extraction of the lipid bilayers was clearly evident as distinct voids and empty spaces visible in the epidermal region (). The extraction of the SC lipids might have caused dehydration of SC with significant loss of moisture. These observations support the in vitro skin permeation data. There were no apparent signs of skin irritation (erythema and oedema) observed on visual examination of the skin specimens treated with NE formulation, indicating the absence of any skin irritation as consequence of NE treatment (Shakeel et al., Citation2008). These results indicated that developed NE is safe for transdermal delivery of TCC ().
Figure 6. Histological findings of skin biopsies control (A), treated with NE (B).
CLSM study
CLSM provides information about the localization and the permeation pathway of fluorescent model compound in the tissue. The major advantage of CLSM is that, the distribution of the fluorescent model compound in the sample can be visualized without cryo-fixing or embedding the tissue. However, in the case of penetration studies with enhancer, the major disadvantage of CLSM is that, it cannot resolve intra and intercellular distribution of permeation path (Ogiso et al., Citation1994; Nike et al. Citation1997). TCC loaded with Rhodomine b in aqueous solution was taken as control and its permeation at different time interval through porcine skin was monitored as shown in . The permeation of NE at different time interval is shown in . The control formulation after 2 h treatment () showed a higher deposition of the fluorescent compound in superficial layers of SC. With the increase in time of treatment, the fluorescence intensity of Rhodamine b decreased () and after 12 h minimal fluorescence intensity was found (), indicating that control formulation did not provide reservoir for the drug for a prolonged time and permeation occurred only at the superficial level and not beyond that.
Figure 7. Laser scanning confocal micrograph of control in different times. (a) 2 h in vitro treatment with control; (b) 6 h in vitro treatment with control; (c) 12 h in vitro treatment with control.
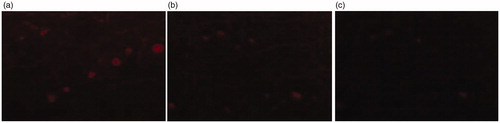
Figure 8. Laser scanning confocal micrograph of NE in different times. (a) 2 h in vitro treatment with NE; (b) 6 h in vitro treatment with NE; (c) 12 h in vitro treatment with NE.
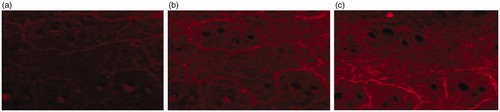
clearly showed that permeation rate of NE in SC, epidermis and dermis depended on the time of treatment. After 2 h application of TCC NE containing Rhodomine b, a significant enhanced fluorescence intensity in SC, hair follicles, sweat gland, epidermis and dermis layer was seen in comparison to control (). As expected, NE showed the highest deposition of fluorescent substance in deeper skin layers as the time of treatment increased (). The TCC NE, penetrated into deeper layers and were able to diffuse uniformly further in the dermis to a great extent after 6 h application time. The NE formulation provided a reservoir for the drug for the prolonged time as indicated in . It was found that after 12 h of treatment the fluorescence of Rhodomine b was still observed. Previous studies have reported that NEs mainly increase the fluidity of the intercellular lipids of the SC leading to enhanced percutaneous permeation of drug after transdermal application (Chanzeg et al., Citation2006). CLSM results also indicated that sweat gland and hair follicle provided the path for transdermal permeation of w/o NEs ( & ).
Conclusion
NE-containing TCC were successfully formulated by pseudo ternary phase diagram method. Surface morphology studies demonstrated the spherical shape of the globule. The utility of w/o NE as vehicles for transdermal delivery of TCC was studied. The optimized formulation showed significantly improved in vitro permeation as compared to the control. The NEs were shown to increase the transdermal delivery of TCC 5-fold over the control. The superior flux appears to be mainly due to the nano size of globules and due to the components of NEs which itself acts as the permeation enhancers, leading to larger concentration gradients towards the skin. CLSM study also indicated the better permeation of NEs of TCC as compared to control.
Overall, these results indicated that w/o NEs are good carriers for transdermal delivery of antiinflammatory drug TCC. However, further, in vivo investigations are required to evaluate improved anti-inflammatory efficacy of TCC.
Acknowledgements
The authors are grateful to AIIMS, Delhi, India, for providing facility to conduct TEM analysis of NE formulations, and to JNU, Delhi, India, for providing the facility to conduct CLSM study.
Declaration of interest
Authors have no any conflict of interest including any financial, personnel or other relationships with other people or organizations. The authors alone are responsible for the content and writing of the paper.
The work novel and has not been published and it is not under consideration for publication elsewhere.
The authors are thankful to University Grant Commission (UGC), Government of India for providing financial assistance to this project.
References
- Acharjyask MP, Panda P, Annapurna MM. (2010). Spectrophotometric methods for the determination of thiocolchicoside in bulk and pharmaceutical dosage forms. J Pharm Educ 1:51–7
- Ahad A, Aqil M, Kohli K, et al. (2012). Formulation and optimization of nanotransfersomes using experimental design technique for accentuated transdermal delivery of valsartan. Nanomed Nanotechnol Biol Med 8:237–49
- Artusi M, Santi P, Colombo P, Junginger HE. (2003). Buccal delivery of thiocolchicoside: in vitro and in vivo permeation studies. Int J Pharm 250:203–13
- Babita1 K, Kumar V, Rana V, et al. (2006). Thermotropic and spectroscopic behavior of skin: relationship with percutaneous permeation enhancement. Curr Drug Deliv 3:95–113
- Baboota S, Shakeel F, Ahuja A, et al. (2007). Design development and evaluation of novel nanoemulsions formulations for transdermal potential of celecoxib. Acta Pharm 8:316–32
- Babua RJ, Pandit JK. (2005). Effect of penetration enhancers on the release and skin permeation of bupranolol from reservoir type transdermal delivery systems. Int J Pharm 288:325–34
- Basch E, Bent S, Collins J, et al. (2007). Flax and flaxseed oil (Linum usitatissimum): a review by the Natural Standard Research Collaboration. J Soc Integr Oncol 5:92–105
- Chanzeg M, Chander J, Dinda AK. (2006). Transdermal permeation of tetracaine hydrochloride by lecithin microemulsion: in vivo. Collids Surfaces B Interferes 48:58–66
- Craig DQM, Barker SA, Banning D, Booth SW. (1995). An investigation into the mechanisms of self-emulsification using particle size analysis and low frequency dielectric spectroscopy. Int J Pharm 114:103–10
- Elena P, Paola S, Maria RG. (2001). Transdermal permeation of apomorphine through hairless mouse skin from microemulsion. Int J Pharm 226:47–61
- Gregory RJ, Himes R. (2011). Water-in-oil microemulsions for effective transdermal delivery of proteins. Expert Opinion Drug Deliv 8:537–46
- Hwang TL, Fang CL, Chen CH, Fang JY. (2009). Permeation enhancer-containing water-in oil nanoemulsions as carriers for intravesical cisplatin delivery. Pharma Res 26:2314–23
- James MJ, Gibson RA. (2000). Dietary polyunsaturated fatty acids and inflammatory mediator production. Am J Clin Nutr 71:343S–8S
- Janbores JM. (1987). Review of the toxicology, pharmacodynamics and pharmacokininectic of thiocolchicoside, a GABA agonist muscle relaxant with anti-inflammatory and analgesic actions. Acta Therapeutica 13:221–35
- Kawakami K, Yoshikawa T, Moroto Y, et al. (2002). Microemulsion formulation for enhanced absorption of poorly soluble drugs. I. Prescription design. J Control Release 81:65–74
- Kieffer FB, Wegrich P, Schwarzentench R, et al. (2000). Percutaneous absorbance of sunscreens in vitro interspecies comparision, skin models and reproducibility aspects. Skin Pharacol Appl Skin Physical 13:324–35
- Kong M, Chen XG, Kweon DK, Park HJ. (2011). Investigation on skin permeation of hyaluronic acid based nanoemulsion as transdermal carrier. Corbohydrates Polym 86:837–43
- Kumar A, Ahuja A, Ali J, Baboota S. (2012). Curcumin loaded nano globules for solubility enhancement: preparation, characterization and ex vivo release study. J Nanosci Nanotech 12:1–10
- Nike A, Guy RH, Potts RO, Guy RH (Eds.). (1997). Mechanism of transdermal drug delivery. New York: Marcel Dekker, Inc
- Ogiso T, Paku T, Masahiro I, Tanino T. (1994). Mechanism of the enhancement effect of n-octyl-beta-D-thioglucoside on the transdermal penetration of fluorescein isothiocynate-labled dextran and the molecular weight dependence of water-soluble penetrants through stripped skin. J Pharm Sci 83:1676–81
- Prausnitz MR, Langer R. (2011). Transdermal drug delivery. Nae Biotechnol 26:1261–8
- Ramachandran WHC, Bielinska AU, Kingzett K, et al. (2001). Topical transfection using plasmid DNA in a water-in-oil nanoemulsion. Int J Pharm 221:23–34
- Sandov KP, Bouvier MY, Chrctien P, et al. (1994). Single dose bioavailability of oral and intramuscular thiocolchicoside in healthy volunteers. Biopharm Drug Dispos 15:259–63
- Schaefer H, Redelmier TE. (1996). Skin barrier: principle of percutaneous absorption. : Karger AG
- Schmook FP, Meingassner JG, Billich A. (2001). Comparision of human skin or epidermis model with human and animal skin in vitro percutaneous absorption. Int J Pharm. 215:51–6
- Shakeel F, Baboota S, Ahuja A, et al. (2007). Nanoemulsion as vehicles for transdermal delivery of aceclofenac. AAPS PharmSciTech 8:191–9
- Shakeel F, Baboota S, Ahuja A, et al. (2008). Celecoxib nanoemulsion: skin permeation mechanism and bioavailability assessment. J Drug Target 16:733–40
- Sharma S, Kumar A, Sahni JK, et al. (2011). Nanoemulsion based hydrogel containing omega 3 fatty acids as a surrogate of betamethasone dipropionate for topical delivery. Adv Sci Lett 4:1–11
- Shen Q, Wang Y, Zhang Y. (2011). Improvement of colchicine oral bioavailability by incorporating eugenol in the nanoemulsion as an oil excipient and enhancer. Int J Nanomed 6:1237–43
- Simon GA, Molibach HI. (2000). The pig as an experimental animal model for percutaneous permeation in man qualitative and quantitative observation an overview. Skin Pharacol Appl Skin Physical 13:229–34
- Tadros T, Izquierdo P, Esquena J, Solans C. (2004). Formation and stability of nanoemulsions. Adv Collids Interface Sci 108–109:303–18
- Veddi HK, Chan SY. (2002). Terpenes in propylene glycol as skin-penetration enhancers: permeation and partition of haloperidol, Fourier transform infrared spectroscopy and differential scanning calorimetry. J Pharm Sci 91:1639–51
- Wang JJ, Hung CF, Yeh CH, Fang JY. (2008). The release and analgesic activities of morphine and its ester prodrug, morphine propionate, formulated by water-in-oil nanoemulsions. J Drug Target 16:294–301
- Yannic BS, Naik A, Guy RH, et al. (2005). Transdermal iontophoretic delivery of vapreotide acetate across porcine skin in vitro. Pharma Res 22:1305–12