
Abstract
In order to enhance the interaction between nanocarrier and gastrointestinal epithelial cells, we developed nanoparticles (NPs) modified with targeting ligand FQSIYPpIK (FQS), which specifically interact with integrin αvβ3 receptor expressing on the intestinal epithelium. The targeting NPs were prepared by coating the insulin-loaded poly(lactide-co-glycolide)–monomethoxy-poly(polyethylene glycol) micelle cores with FQS modified trimethyl chitosan chloride. In in vitro study, the fabricated NPs showed ameliorated drug release profile and improved enzymatic stability compared with micelles alone. In the integrin αvβ3 receptor over-expressed Caco-2 cells model, FQS modified NPs exhibited significantly accelerated intracellular uptake due to the active ligand–receptor mediation. Meanwhile, the targeting NPs also showed enhanced transport across the Caco-2 monolayer cells via both transcellular and paracellular pathways. Besides, orally administered FQS modified NPs produced a prominent hypoglycemic response and an increase of the serum insulin concentration in diabetic rats. Both in vitro and in vivo results demonstrated the FQS peptide modified NPs as promising intestinal cell-targeting nanocarriers for efficient oral delivery of insulin.
Introduction
Oral administration of therapeutic drug is considered to be the most convenient and preferred choice for patients owing to good patient compliance and safety. However, the oral delivery of biomacromolecular agents, such as insulin, has shown extremely low bioavailability (<1%), which not only attributed to their vulnerable tertiary structures, but also due to their poor permeation ability to cross intestinal epithelium (Frokjaer & Otzen, Citation2005; Gupta et al., Citation2013; Shan et al., Citation2015). In the past decade, nanocarriers have opened a new perspective for oral delivery of biomolecules (Gupta et al., Citation2013). Even so, the intestinal epithelium still presents as a formidable barrier for the effective transportation of drug to the systemic circulation.
To enhance the translocation amount of therapeutic drug, a number of advanced functionalized nanoparticles (NPs) have been explored. Some researchers developed NPs with specific ligands to increase the cellular internalization efficiency through receptor-mediated endocytosis pathway (Russell-Jones, Citation2001). Among those intestinal epithelium cells, M cells are the mostly studied target because of their special physiological functions (Kunisawa et al., Citation2012). Some ligands such as lectins, ulexeuropaeus agglutinin 1, RGD and CKSTHPLSC peptide have been reported to target to different receptors of M cells (Clark et al., Citation2001; Zhang et al., Citation2005; Garinot et al., Citation2007; Yoo et al., Citation2010). However, the M cells account for only small number of intestinal cells and the targeting ligands usually were used to transport vaccine, thus limits their application. Apart from the M cells, goblet cells have also been studied as potential targets for oral drug delivery (Kang et al., Citation2008). Our group recently reported a goblet cell-targeting NPs by conjugating N-trimethyl chitosan chloride (TMC) with CSKSSDYQC peptide, which specifically recognized goblet cells and posed a preferable hypoglycemic effect as compared with the unmodified ones (Jin et al., Citation2012; Zhang et al., Citation2014b), whereas goblet cells account for only 12% of intestinal cells. To obtain a NP with higher targeting efficiency, much attention has been paid to the enterocytes which are in the majority of intestinal epithelium. Biotin (vitamin B7) and a novel 7peptide (HAIYPRH) which targets to biotin receptor and transferrin receptor on enterocytes, respectively, were used to modify NPs and showed enhanced drug absorption (Du et al., Citation2013; Zhang et al., Citation2014a). Nevertheless, only limited kinds of targeting ligands and receptors on intestinal epithelium cells have been reported. It is important to find more effective ligands to fulfill the epithelium targeting. Recently, FQSIYPpIK (FQS) peptide, identified from PNA-encoded peptide library, exhibited high affinity to integrin αvβ3 receptor which is a transmembrane glycoprotein composed of two identical subunit monomers expressing on the Caco-2 cells (Svensen et al., Citation2011; Hsu et al., Citation2013; Guo et al., Citation2014), implying FQS peptide could be used as a potential epithelium-targeting ligand for oral delivery. However, it has been barely reported.
Therefore, in the present study, we attempted to design an intestinal epithelium cell targeting NPs. These NPs possessed a self-assembling micelle core which formed by poly(lactide-co-glycolide)–monomethoxy-poly(polyethylene glycol) (PLGA–mPEG) and FQS modified TMC as coating materials. We hypothesized that the NPs could on one hand protect the insulin from the harsh environment of the gastrointestinal tract, on the other hand could enhance the drug absorption by ligand mediation. The Caco-2 cells were used as the cell model and the expression of integrin αvβ3 receptor was investigated. The endocytosis, transcytosis and the in situ absorption of NPs were evaluated. Pharmacological and pharmacokinetic studies were conducted in streptozotocin (STZ) induced diabetic Sprague-Dawley rats.
Materials and methods
Materials
PLGA–mPEG copolymers [PLGA18000–mPEG2000 (50:50)] were purchased from DaiGang Bio-pharmaceuticals Co., Ltd. (Shandong, China). Chitosan (deacetylation degree > 90% and molecular weight of 40 kDa) was provided by AK Biotech Co., Ltd. (Shandong, China). Porcine insulin was purchased from Wanbang Bio-Chemical Co., Ltd. (Jiangsu, China). FQSIYPpIK peptide was chemically synthesized by Chinese Peptide Co., Ltd. (Hangzhou, China). BCA Protein Assay Kit was obtained from Kaiji Bio-pharmaceuticals Co., Ltd. (Sichuan, China). Fluorescein isothiocyanate (FITC), rhodamine-conjugated ulexeuropaeus agglutinin I lectin (Rho-UEA-I) and 3-(4,5-dimethyl-thiazol-2-yl)-2,5-diphenyl tetrazolium bromide (MTT) were all purchased from Sigma Aldrich (St. Louis, MO). 1-[3-(Dimethylamino)propyl]-3-ethylaarbodiimide hydrochloride (EDC·HCl) was gained from Meapeo Co., Ltd. (Shanghai, China). N-Hydroxysuccinimide (NHS), N-methylpyrrolidone, iodomethane and acetonitrile were all obtained from Kelong Chemical Co., Ltd. (Chengdu, China). All other agents were of analysis grades. Rabibit anti-ITGB3 Polyclonal Antibody and Cy3-Goat Anti-Rabbit were purchased from ABclonal Technology (Shanghai, China).
Caco-2 cells were gained from Institute of Biochemistry and Cell Biology (Shanghai, China). Male Sprague-Dawley rats weighing 220 ± 20 g were purchased from Experimental Animal Center of Dashuo (Sichuan, China). The rats were housed at a room temperature of 22 ± 2 °C and a relative humidity of 50 ± 10%.
Polymer synthesis
TMC was synthesized as previously described (Jin et al., Citation2012). Briefly, TMC was obtained by methylation the amine groups of chitosan (CS) with methyl iodide (CHI3) in sodium hydroxide (NaOH) using N-methylpyrrolidone (NMP) as solvents. The reaction was preceded for 45 min at 60 °C. The product was purified by dialysis and then lyophilized (Free Zone 2.5 L, LABCONCO Inc., Kansas City, MO). The degree of quaternization (DQ) was calculated from the integration of 1H NMR. The obtained TMC was conjugated with FQS peptide via amide bond formed among the residual primary amino groups on TMC and carboxyl groups on FQS peptide. TMC (0.25 mmol), EDC·HCl (0.3 mmol) and NHS (0.3 mmol) were dissolved in 10 ml water. Then, FQS peptide (0.05 mmol) was added in the solution. The reaction was conducted for 3 days at room temperature in dark. Subsequently, the product was dialyzed (MW cut-off 8000–14 000 Da), lyophilized and stored at 4 °C. The obtained TMC-FQS was identified by 1H NMR and the conjugation efficiency was monitored by the high-performance liquid chromatography (HPLC, Agilent 1200 series, Santa Clara, CA), and the content of the conjugated peptide was determined through the amino acid detection (835-50, Hitachi Co., Tokyo, Japan).
Preparation and characterization of insulin-loaded NPs
The insulin-loaded NP was prepared via a two-step approach according to the previous study. Insulin-loaded PLGA–mPEG micelles were prepared with a dialysis strategy with modifications (Hu et al., Citation2014). Briefly, PLGA–mPEG and insulin were dissolved in a solution of dimethyl sulfoxide (DMSO), and then the solution was added dropwisely into phosphate buffer (pH 7.4, 0.02 M). Thereafter, the mixture was stirred for 30 min at room temperature, and the resultant solution was then dialyzed (MWCO: 100 000) against deionization water for 8 h at 4 °C to obtain micelles. Subsequently, the ionic crosslinking method was used to coat TMC or TMC-FQS to the prepared micelles (Jin et al., Citation2012). Tripolyphosphate (TPP, 5 mg/ml) and magnesium sulfate (MgSO4, 5 mg/ml) were added into the TMC or TMC-FQS aqueous solution to form the mixture, and then the micelles solution was added dropwisely to the mixture with stirring for 10 min. The NPs prepared with TMC or TMC-FQS were termed as T-NPs or FQS-NPs, respectively.
Micelles and NPs were characterized for their size and zeta potential with dynamic laser scattering (Malvern Instruments Ltd., Malvern, UK), and the morphologies of the samples were visualized by Transmission Electron Microscope (HITACHI, H-600). The entrapment efficiency (EE%) of insulin micelles was calculated as the percentage of the loaded insulin over the original feeding amount of insulin as previously described (Kim et al., Citation2009). Briefly, the free form insulin was removed with a dialysis membrane (MWCO: 100 000), and the amount of drug loaded in micelles was determined by HPLC. The EE% of NPs was counted as the percentage of the loaded drug in the NPs excluding the micelles in the supernatant solution, over the original content of drug in the micelles. The EE% of micelles (1) or NPs (2) was calculated as following:
(1)
(2)
In vitro drug release and enzymatic stability study
Release of FITC-insulin from NPs was performed by the method described by the literature with minor modification (Zhang & Ma, Citation2009). The release profiles of FITC-insulin from micelles and NPs were studied at 37 °C in four different media including artificial gastric fluid (pH 2.5, pH 1.2) and artificial intestinal liquid (pH 6.8, pH 7.4) using the dialysis method. Briefly, 1.5 ml of the drug-loaded samples was added to a dialysis tube (molecular weight cut-off size: 100 000 Da) and then the dialysis tube was immersed 500 ml artificial gastric juice or artificial intestinal liquid incubated at 37 °C for 8 h. At certain time intervals, 100 μl of medium was withdrawn and the same volume of the fresh solution was added immediately. Tests were performed in triplicate. The concentration of FITC-insulin in collected samples was analyzed by Varioskan Flash Multimode Reader (Thermo Fisher Scientific, Waltham, MA) after adding with 50 μl DMSO to break down the NPs.
Evaluation of the enzymatic stability of insulin in different samples, insulin degradation study was performed in the presence of pepsin and trypsin. Typically, 0.5 ml of free insulin solution or different insulin-loaded samples (0.6 mg/ml of insulin) were added to 1.5 ml of trypsin solution (1.5 mg/ml, pH 7.4) and pepsin solution (2.5 mg/ml, pH 1.2), respectively, then incubated at 37 °C (Varshosaz et al., Citation2003). Aliquots (100 μl) were withdrawn at determined time and added with 50 μl ice-cold HCl solution (0.1 M) and 100 μl NaOH solution (0.1 M) to terminate the enzymatic reaction, respectively. Fifty microliters of DMSO was then added to break down the micelles. The sample was centrifuged at 13 000 rpm for 15 min and the intact insulin remained were determined by HPLC. We also investigated the enzymatic degradation of FQS in the presence of trypsin. Trypsin solution was added to an equal volume of FQS solution (2 mg/ml). The mixtures were incubated at 37 C in a shaking water bath, and aliquots (100 μl) were withdrawn after specified time intervals. The enzymatic reaction was stopped immediately by the addition of 100 μl ice-cold HCl (0.1 M), and the amount of remained FQS was determined by HPLC (Makhlof et al., Citation2011).
Cell studies
Cell culture
Caco-2 human colon adenocarcinoma cells were cultivated in 75 cm2 culture flasks using DMEM (Gibco, Grand Island, NY) supplemented with 10% fetal bovine serum, 1% non-essential amino acids (Hyclone, Logan, UT), 1% l-glutamine, penicillin (100 IU/ml) and streptomycin (100 mg/ml) at 37 °C, 95% relative humidity and 5% CO2. Cells were split at a ratio of 1:3 after reaching 90% confluence (Sadeghi et al., Citation2008).
Receptor expression study
Caco-2 cells were cultured on coverslips for 4 days at 37 °C prior to study. The medium was removed and cells were rinsed with PBS, fixed with 4% paraformaldehyde for 20 min at room temperature and blocked with 5% bull serum albumin (BSA) for 1 h at 37 °C. Subsequently, cells were incubated with rabbit monoclonal antibodies to integrin beta 3 (ABclonal) at 4 °C overnight, and adding PBS for negative control. A Cy3-conjugated Goat Anti-Rabbit IgG was used as a secondary antibody and incubated with cells for 1 h at 37 °C. The cells were then stained with DAPI for nuclei identification, and the fluorescent images of cells were acquired using a confocal laser scanning microscope (CLSM, Live 5 DUO, Carl Zeiss, Jena, Germany) (Du et al., Citation2013).
Cytotoxicity studies
Cell viability of various sample suspensions was assessed using the MTT assay with Caco-2 cells (Huang et al., Citation2014). Briefly, Caco-2 cells were seeded onto 96-well plate at a density of 5 × 10⁴ cells/ml and allowed to grow 3 days in DMEM medium as described earlier. Prior to the test, the medium was removed from the wells, and cells were washed twice with PBS. And then 200 μl sample suspensions were added to the culture media. After 3 h of incubation at 37 °C, 20 μl of MTT solution (5 mg/ml in PBS, pH 7.4) was added and incubated for another 4 h. Subsequently, the MTT medium was removed carefully and 200 μl of DMSO was added and incubated for 1 h with moderate shaking for absorbance determination. Each assay was performed on eight samples (n = 8), and cell viability was expressed as the percentage of cells without treatment (negative controls).
Cellular uptake experiment
The cellular uptake of under different conditions was quantified by the bicinchoninic acid (BCA) method. In brief, cells were seeded in a 96-well plate at a density of 1 × 10⁴ per well 4 days prior to study, and then incubated with test sample for 3 h at 37 °C. Subsequently, the cells were treated with lysis buffer, and the cell-associated fluorescence intensity and proteins concentration were determined by Varioskan Flash Multimode Reader and BCA assay kit (KeyGen Biotech Co., Ltd., Nanjing, China), respectively. The amounts of uptake were expressed as the quantity of FITC-insulin over the total protein.
In order to estimate the targeting effect of FQS peptide, cells were pre-treated with FQS peptide for 30 min at 37 °C, and then incubated with sample solutions. Additionally, to further ensure the receptor of FQS peptide, cells were pre-incubated with integrin beta 3 antibody (ABclonal) at 37 °C for 30 min prior to the addition of test sample, and then stained the nuclear by DAPI and observed using CLSM.
To further investigate the endocytic pathways involved in the endocytosis of micelles and NPs, the cells are pre-incubated with various specific endocytotic inhibitors listed in for 1 h and then test sample was added to the medium for an additional 3 h. Thereafter the cells were conducted by the BCA method. The results of the inhibition tests were presented as the percentage of uptake as compared with the 37 °C untreated control.
Transport of NPs across Caco-2 monolayer
To further investigate the transport of FQS peptide modified NPs across the epithelial cells, the Caco-2 cells were cultured as previously described (Jin et al., Citation2012). Briefly, caco-2 cells were monolayer that was incubated for 17 days after being seeded on the Transwell® chambers (0.4 μm in pore size, 0.33 cm2 of cell growth area, Costar), mimicking the intestinal epithelium.
Before studies, the culture medium was replaced with an equal volume of Hank's balanced salt solution containing calcium and magnesium chloride (HBSS) and allowed to equilibrate at 37 °C for 30 min (Sajeesh et al., Citation2010), then HBSS was removed and the cells were incubated with 200 μl of sample solutions at concentration of 150 μg/ml for FITC-insulin. At the predetermined time (0, 1, 2 and 3 h), 200 μl of samples was taken from the basolateral chamber and supplemented with equal volumes of HBSS. The amount of transported FITC-insulin was determined using Varioskan Flash multimode reader, and the apparent permeability coefficient (Papp, cm/s) was calculated by the following equation:
where Papp is the apparent permeability coefficient (cm/s), dQ/dt is the steady state flux (μg/s), C0 is the initial concentration of F-insulin in apical side, and A is the surface area of the membrane filter (0.33 cm2).
Additionally, the influence of the tight junctions after the NPs treatment was studied by monitoring the changes of transepithelial electrical resistance (TEER) values of the cell monolayer. After incubation, the NPs were replaced with culture medium, and the TEER value was monitored for another 21 h. The changes in TEER values were measured with a Millicell®-Electrical Resistance System (Millipore, Billerica, MA), and data were presented as a percentage relative to baseline value.
Visualization of tight junctions
Immunofluorescent staining of ZO-1 protein was achieved to visualize the status of tight junction between the cells after the incubation with test samples (Rekha & Sharma, Citation2009). Briefly, the Caco-2 cell monolayer incubated with test samples for a period of 3 h followed by cell washing with PBS, and then fixed with 4% paraformaldehyde for 20 min, washed with PBS and permeabilized with 0.2% Triton X-100 for 10 min. Triton X-100 solution was thereafter removed and blocked with 5% BSA. Subsequently, this solution was aspirated and replaced with mouse anti-ZO-1 mAb (Abcam®) antibody, diluted in 5% BSA/PBS to a final concentration of 1 μg/ml at 4 °C overnight, and incubated with Cy3 labeled anti-rabbit IgG (ZSGB-BIO) at 37 °C for 30 min. The stained cells were mounted on slides and visualized using CLSM.
In situ absorption and in vivo pharmacological and pharmacokinetic study
The absorption of FITC-insulin in intestinal villus was also qualitatively studied using in situ intestinal loop model as previously described (Jin et al., Citation2012). Briefly, Sprague-Dawley (SD) rats weighing 220 ± 20 g were fasted overnight before experiments allowed access to water. The rats were anesthetized with pentobarbital sodium (0.04 mg/kg), and then a midline laparotomy was done to expose the intestine, and 2-cm sections intestinal loop were made and washed with physiological saline, then ligated at both ends. 0.2 ml of different sample solutions with equal fluorescent was injected into the loop. At 3 h after administration, the rat was sacrificed by cervical dislocation and the sections of loops were removed, mildly washed with PBS. Thereafter, the removed loops were fixed with 4% PFA for 3 h and then dehydrated in 30% sucrose overnight. Samples were embedded in optimal cutting temperature compound and cryo-sectioned at 6 μm thickness. Mucus droplets of goblet cells were labeled with Rho-UEA-I and the tissue-sections were observed by CLSM.
The hyperglycemic effect and serum insulin concentration following the oral administration of samples were tested on diabetic rats. All the experiments were approved by the Institutional Animal Care and Use Committee of Sichuan University. Male SD rats weighting 180–220 g were used. Diabetes was induced in normal rats through injection of STZ (70 mg/kg) dissolved in a 10 mM citrate buffer (pH 4.5) as previously described (Liu et al., Citation2008). One week after the diabetic inducing, the blood glucose level was determined using a glucose meter (JPS-6, Yicheng Biotech. Co. Ltd., Beijing, China). Rats were considered to be diabetic when their fasting glycemia was higher than 16.0 mM. The animals were randomly divided into six groups with four each. The diabetic rats were fasted overnight before experiments with free access to water. Then the different samples were administered intragastrically to diabetic rats, including free insulin solution (50 IU/kg), micelles (50 IU/kg), unmodified T-NPs (50 IU/kg) and FQS-NPs (50 IU/kg). One group of rats was administered with insulin solution (5 IU/kg) by subcutaneous injection. Blood samples were collected from the tail veins of rats prior to drug administration and at different time intervals (1, 2, 4, 6 and 8 h) after dosing. The blood glucose levels were then determined, and tested with glucose meter. The total decrease (D %) in serum glucose levels was calculated using a modified method as follows:
where AUC is the total area under the curve of plasma glucose concentration versus time.
For the analysis of serum insulin level, blood samples were centrifuged (3000 rpm, 5 min) and subsequently quantified using an insulin ELISA kit (R&D System, Inc., Minneapolis, MN). The following formula was calculated the relative bioavailability (FR %) of test samples after oral administration.
Statistical analysis
All analyses were carried out in triplicate (n = 3), unless otherwise stated, and all data were presented as means ± SD. A one-way ANOVA (SPSS program 16.0, Chicago, IL) was used to determine statistical significance. A p value less than 0.05 was considered as statistically significant, while a p value less than 0.001 was considered to be highly significant.
Results and discussion
Characterization of synthesized polymers
To improve the water solubility of chitosan, we modified the chitosan by methylation of amino group with iodomethane. The quaternization degree of TMC was determined by 1H nuclear magnetic resonance (Figure S1) and calculated to be 22.91%. TMC-FQS was synthesized by coupling the free amino groups of TMC with the carboxyl groups in the fifth amino acid of FQS peptide. The characteristic peaks at 6.752 and 7.023 ppm belonging to four protons of benzene ring of phenylalanine and tyrosine in FQS peptide sequence demonstrated the FQS was successfully conjugated to TMC (Figure S2). To further confirm the chemical conjugation of TMC-FQS, the HPLC analysis was performed. As shown in Figure S3, the peak of free FQS peptide was around 12.5 min. After chemical conjugation, the peak was disappeared, indicating that FQS had been successfully conjugated to the polymer. The amino acid detection analysis also indicated the successful conjugation of TMC-FQS and the content of FQS peptide in polymer was calculated to be 0.045 mmol/g.
Preparation and characterization of micelles and NPs
To avoid the insulin degradation, we prepared micelles with 89.2 nm in size and a negatively charged surface. To further enhance the stability and absorption of insulin, the micelles were coated with TMC or FQS-TMC with adding TPP and MgSO4 as crosslinking agents, the NPs were termed as T-NPs and FQS-NPs, respectively (). The size of T-NPs and FQS-NPs increased to nearly 200 nm and the zeta potentials increased from −12.6 to ∼16 mV (). The inversion of surface charges indicated that the TMC/TMC-FQS were successfully coated on the surface of micelles. Besides, the size of FQS-NPs was slightly larger than unmodified NPs, which was probably caused by the peptide modification. The TEM examination showed that the morphology of micelles and NPs was spherical in shape and their diameters were identical with that obtained by dynamic light scattering (). As shown in , the EE% of micelle, T-NPs and FQS-NPs were 91.5%, 84.1% and 72.6%, respectively.
Figure 1. (A) Schematic illustration of the T-NPs structure. (B) Particle size and zeta potential of micelles, T-NPs and FQS-NPs (mean ± SD, n = 3). (C) Transmission electron microscope of micelles, T-NPs and FQS-NPs.
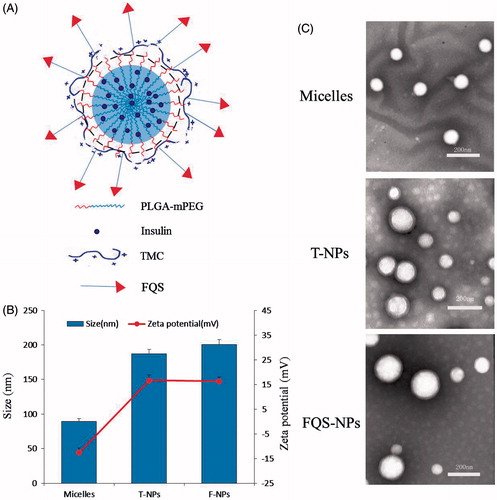
Table 1. Characterization of insulin-loaded Micelles, T-NPs, FQS-NPs (mean ± SD, n = 3).
Table 2. Specific endocytotic inhibitors applied in the uptake mechanic experiment and their functions and concentrations.
In vitro insulin release from the NPs and enzymatic stability
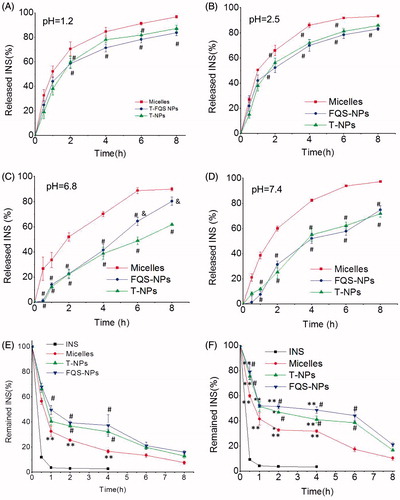
Orally delivered formulations destine to be exposed to the harsh digestive environment after administration. As it is well-known, the luminal pH varies from highly acidic in the stomach (pH 1.2–3.0) to slightly basic in the intestine (pH 6.5–8.0) (Wang & Zhang, Citation2012). Therefore, we perform the insulin release from the micelles and NPs in artificial gastric juice and artificial intestinal liquid at 37 °C, respectively. As shown in , both the FQS modified and non-modified NPs exhibited a better controlled and sustained release profile in different environments, compared with micelles groups. Besides pH, there are abundant enzymes in the GI tract (Peppas & Kavimandan, Citation2006). depicts the percentage of intact insulin remained in presence of pepsin and trypsin, respectively. Compared with free insulin, the enzymatic stability of insulin was significantly improved for all test samples. After incubation with pepsin for 2 h or with trypsin for 6 h, FQS-NPs and T-NPs exhibited a stronger protective ability with above 35% or 40% of remained insulin, which was obviously higher than that of micelles (around 20% and less than 20%, p < 0.05). The results suggested that NPs had better ability of protecting insulin from degradation. Moreover, we also investigate the enzymatic degradation of FQS in the presence of trypsin. As shown in Figure S4, 95% of FQS peptide was remained after incubation with trypsin for 8 h, indicating the stability of FQS in the enzymatic environment.
Figure 2. Stability of NPs. (A)–(D) The in vitro release profile of micelles/NPs in different pH solutions (mean ± SD, n = 3). (E) Degradation profiles of insulin as a function of time in pepsin solution (mean ± SD, n = 3). (F) Degradation profiles of insulin as a function of time in trypsin solution (mean ± SD, n = 3). *indicates p < 0.05 versus INS; **indicates p < 0.01 versus INS. #indicates p < 0.05 versus micelles; ##indicates p < 0.01 versus micelles. &indicates p < 0.05 versus TMC NPs; &&indicates p < 0.01 versus TMC NPs.
Receptor expression and cellular internalization in Caco-2 cells
In vitro cytotoxicity of test samples was investigated by an MTT assay. All the test samples were found to have no significant effect on the cell viability at the concentration of insulin at a range of 50–150 μg/mL, and we supposed that the results obtained in the following study were not ascribed to the impairment of cell viability (Figure S5).
The integrin αvβ3 receptor is essential for the receptor-mediated endocytosis in our study. To confirm whether Caco-2 cell model expresses the integrin αvβ3 receptor, further experiment was carried out. As shown in , obvious expression of integrin αvβ3 receptor was observed in Caco-2 cells, while it was not seen expression in the control. To verify the effect of FQS modification on cellular internalization, the endocytosis of FITC-insulin loaded formulations was investigated. Interestingly, all the samples exhibited a time- and concentration-dependent endocytosis (). Moreover, according to these results, we found that both the micelles and NPs significantly enhanced the cellular uptake amount of FITC-insulin. Compared with micelles, coating with chitosan derivatives showed the more amounts of insulin internalized and the FQS-NPs showed the highest uptake efficiency which was 1.84-fold (p < 0.05) and 4.70-fold (p < 0.05) higher than that of T-NPs and free FITC-insulin at 150 μg/mL, respectively.
Figure 3. (A) Characterization integrin αvβ3 receptor expression in Caco-2 cells. The expression of integrin αvβ3 in Caco-2 cells was analyzed by CLSM. Black represents the staining of integrin αvβ3. White represents the fluorescence of DAPI. (B) Cellular uptake was measured by the BCA method at different incubation time (mean ± SD, n = 3). (C) Cellular uptake was measured by the BCA method at different concentration (mean ± SD, n = 3). (D) Competition experiments conducted using the BCA method (mean ± SD, n = 3). (E) Competition experiments conducted using confocal microscope. Before uptake experiments, the experiment group was incubated with integrin αvβ3 antibody for 30 min prior to incubation with preparation. The control group instead with PBS without integrin αvβ3 antibody. Then cells were incubated with INS, micelles and two kinds of NPs. Scale bars for images are 20 μm. Green represents the fluorescence of FITC-INS; Red represents integrin αvβ3 receptor labeled by Cy3-Goat Anti-Rabbit IgG and blue represents nuclei stained with DAPI. *indicates p < 0.05 versus INS; **indicates p < 0.01 versus INS. #indicates p < 0.05 versus micelles; ##indicates p < 0.01 versus micelles. &indicates p < 0.05 versus TMC NPs; &&indicates p < 0.01 versus T-NPs. ^indicates p < 0.05 versus control of FQS-NPs.
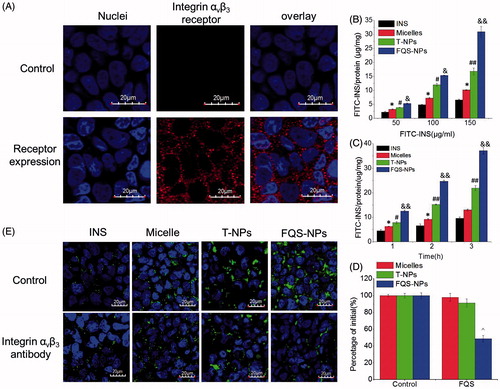
According to the results described above, we hypothesized that the increased cellular uptake might be responsive to the ligand–receptor interaction but not non-specific adhesion. Thus, a competitive experiment was carried out to verify this assumption. As shown in , the addition of free FQS peptide evidently limited the uptake of FQS-NPs and only half of FITC-insulin was internalized into cells, compared to the group without free FQS. It is worthy to note that, free FQS did not have any effects on the cellular uptake of micelles and unmodified NPs. To further confirm this result, we also investigated the cell uptake of FQS-NPs with integrin beta 3 antibody to saturate the integrin αvβ3 receptors on Caco-2 cells. As seen in , only FQS-NPs exhibited decreased fluorescence intensity of FITC-insulin in the presence of integrin beta 3 antibodies. Furthermore, as shown in , obvious expression of integrin αvβ3 receptor was observed in Caco-2 cells. All these results indicated that the modification with FQS peptides could significantly enhanced the cellular internalization ratio via specific FQS-αvβ3 interplay.
Endocytosis pathway studies
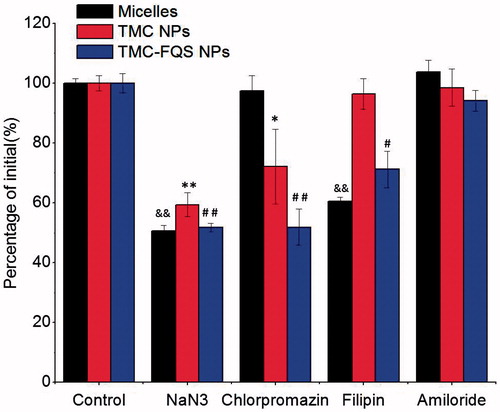
To further investigate the uptake mechanism of the micelles and NPs, we evaluated the cellular uptake of insulin with specific inhibitors (). Sodium azide (NaN3), an energy depletion reagent, is famous for comprehensive active transport inhibition (Behrens et al., Citation2002). As shown in , the presence of NaN3 remarkably suppressed the cellular uptake of all test samples. These results indicated that the involvement of energy-dependent active transport process for micelles and NPs. However, in the presence of chlorpromazine, the cellular uptake of T-NPs and FQS-NPs remarkably decreased to 72.1% (p < 0.05) and 51.9% (p < 0.01) (), respectively, while there was no significant change in micelles group, suggesting that the endocytosis of T-NPs/FQS-NPs was specifically clathrin-mediated (Mo et al., Citation2011). This phenomenon might be caused by the different surface properties possessed between NPs and micelles. Filipin can specifically inhibit caveolae endocytosis through binding to cholesterol or disorganizing caveolins (Jin et al., Citation2012). shows that the uptake of micelles and FQS-NPs decreased to 60.5% (p < 0.01) and 71.2% (p < 0.05), respectively, while it failed to inhibit the uptake of T-NPs, indicating caveolae-mediated endocytosis may be involved in the internalization of micelles and FQS-NPs, rather than T-NPs. Different endocytosis pathway was existed between FQS-NPs and the unmodified ones, which might due to the specific ligand–receptor interaction. Similar results also have been reported by others that ligands conjugated to the surface of engineered NPs can influence the mode of cellular internalization (Yun et al., Citation2013). Amiloride was reported to inhibit constitutive and stimulated macropinocytosis due to the blockage of sodium-proton exchange (Nakase et al., Citation2004). As shown in , cellular uptake of all test samples had no significant change after the treatment of amiloride, indicating that macropinocytosis seemed to be irrelevant in the endocytosis of neither micelle systems nor the NPs.
Figure 4. Cellular uptake of FITC-INS at different conditions in the Caco-2 cells (mean ± SD, n = 3). &indicates p < 0.05 versus control of micelles; &&indicates p < 0.01 versus control of micelles. *indicates p < 0.05 versus control of TMC-NPs; **indicates p < 0.01 versus control of TMC-NPs. #indicates p < 0.05 versus control of TMC-FQS NPs; ##indicates p < 0.01 versus control of TMC-FQS NPs.
In vitro transport study
The ability of different formulations transported FITC-insulin through epithelial cell monolayer was further evaluated. As shown in , the amounts of FITC-insulin permeated through Caco-2 cell monolayer were greatly increased for micelles and NPs, compared with free insulin. NPs modified with FQS showed the highest amount of insulin transport. This is accordance with the apparent permeability coefficient (Papp, ). FQS showed a Papp of 7.42 × 10⁻⁷ cm/s, which was 1.90-fold and 3.35-fold higher than T-NPs (p < 0.05) and micelles (p < 0.05). These results indicated the ligand–receptor interaction facilitated insulin crossing Caco-2 cell monolayers.
Figure 5. (A) The concentration of FITC-INS after administration with FITC-INS, micelles, TMC-NPs and FQS-NPs across Caco-2 monolayer cells (mean ± SD, n = 3). (B) The Papp of FITC-INS after administration with FITC-INS, micelles, T-NPs and FQS-NPs across the Caco-2 monolayer cells (mean ± SD, n = 3). (C) Effect of FITC-INS, micelles and NPs on Caco-2 cell layer TEER values (mean ± SD, n = 3). (D) ZO-1 expressions imaged by confocal microscopy with different samples for 1 h at 37 °C. Control group: the group without incubation with test samples. White arrow represents the opening of tight junctions after 3 h incubation with T-NPs and FQS-NPs. White represents ZO-1 labeled by Cy3-Goat Anti-Rabbit. *indicates p < 0.05 versus FITC-INS; **indicates p < 0.01 versus FITC-INS. #indicates p < 0.05 versus micelles; ##indicates p < 0.01 versus micelles. &indicates p < 0.05 versus TMC NPs; &&indicates p < 0.01 versus TMC NPs.
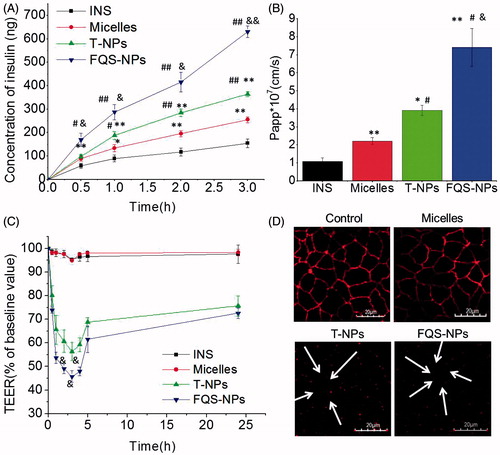
Furthermore, to study the effects of test samples on paracellular permeability, the TEER values were calculated. As shown in , micelles and free insulin had no noticeable influence on the TEER value, while after incubation of T-NPs and FQS-NPs, the TEER values significantly reduced. The FQS-NPs showed the lower TEER value (320 Ω, p < 0.05) at 3 h compared with unmodified NPs, which may be due to the ligand–receptor interaction inducing more FQS-NPs adhering to surface of cells than T-NPs. This result was in agreement with the transport study that FQS modified NPs possessed the optimal ability of transepithelial transport. Additionally, it worth to be noticed that a gradual recovery in TEER values was observed after the incubated test samples were removed (), which is similar with former study that TEER values were reach 80% of initial after removing the chitosan NPs (Lin et al., Citation2008). These observations suggest that the T-NPs and FQS-NPs could open the TJs of Caco-2 cell monolayers reversibly and facilitate the permeation of insulin across intestinal epithelium.
Subsequently, we investigated the changes of TJs via CLSM analysis (). Zonulaoccludens-1 (ZO-1), a tight junction associated protein, plays an important role in tight junction functional regulation (Rekha & Sharma, Citation2009). The fluorescence density of ZO-1 is usually used to assess the changes of TJs. As shown in , before incubation with test samples (control), ZO-1 revealed a continuous ring between adjacent cells. However, after the treatment with T-NPs and FQS-NPs, the staining of ZO-1 was discontinuous (white arrowheads), suggesting the opening of tight junctions. The fluorescence intensity did not have significant changes with micelles, indicating that the tight junctions were integrate. These results were consistent with the changes of TEER values.
In situ absorption, in vivo hypoglycemic effect and pharmacodynamics study
The aim of oral delivery is to convey the drug across the epithelium on intestinal villi and enter the villus capillary. Therefore, we firstly evaluated the in situ absorption of FITC-insulin (green) in intestinal villi via CLSM. Tissue sections were 6 μm thickness, and the intestinal villi were stained with Rho-UEA-I (Jin et al., Citation2012). As shown in , it was found that there was almost no trace of fluorescence in the case of FITC-insulin solution, and it was clear that the green fluorescence of FQS-NPs was stronger than T-NPs and micelles group. These results clearly indicated that the FQS modified NPs had a higher potential to facilitate the insulin permeation across intestinal epithelium. The findings echo previous transport study which test samples cross the Caco-2 cell monolayer ().
Figure 6. (A) Localization of FITC-INS, FITC-INS loaded micelles and NPs prepared using TMC and TMC-FQS in villi at 3 h. (B) Blood glucose levels in diabetic rats following subcutaneous insulin injection at an insulin dose of 5 IU/kg and oral administration of INS, INS-loaded micelles, T-NPs and FQS-NPs at an insulin dose of 50 IU/kg (mean ± SD, n = 4). (C) Plasma insulin level in diabetic rats following oral administration of INS, INS-loaded micelles, T-NPs and FQS-NPs at an insulin dose of 50 IU/kg (mean ± SD, n = 4), and subcutaneous injection of INS Sol. (5.0 IU/kg) as a positive control (mean ± SD, n = 4). Black refers to the mucus droplets of goblet cells, and White refers to FITC-INS. *indicates p < 0.05 versus FITC-INS; #indicates p < 0.05 versus micelles; &indicates p < 0.05 versus TMC NPs.
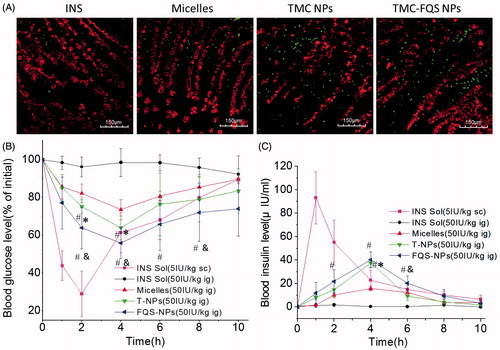
The hypoglycemic effect and the pharmacokinetics of insulin-loaded NPs and micelles after oral administration were evaluated on diabetic rats. As shown in , oral administration of free insulin solution failed to reduce the blood glucose level. The micelles slightly reduced the blood glucose level (73.61%) and both NPs showed obvious hypoglycemic effects. Compared with T-NPs (63.96%), FQS-NPs exhibited a stronger hypoglycemic effect, and the blood glucose level decreased to 55.90% (p < 0.05). The serum insulin concentration–time profiles are shown in . The subcutaneous (s.c.) injection of free insulin led to a rapid increase in serum insulin concentration. The orally administrated of micelles and NPs resulted in a slower rise of serum insulin level and reaching maximum concentration at 4 h post-ingestion. Among these orally administrated samples, FQS-NPs demonstrated the highest serum insulin concentration (40.30 IU/mL). As shown in , the AUC of FQS-NPs was 187.55 mg/L h with the relative bioavailability of 7.58%, which is 25-fold and 1.42-fold higher than that of orally administrated of free insulin (0.30%) and T-NPs (5.34%). During this experiment, the fasting blood glucose did not return to the initial level after 8 h, same as other previous reports, which might be the consequence of the dual effects of hunger and hypoglycemic agents (Suzuki et al., Citation1998; Cui et al., Citation2006). Another distinct feature of the micelles and NPs was their mild efficacy that lasted for a prolonged time period, which was better than s.c. insulin administration that causes an abrupt drop in blood glucose levels. Therefore, the intestinal cell-targeting system developed in the present study might be a potent nanocarrier for oral insulin delivery.
Table 3. Pharmacokinetic parameters of insulin in diabetic rats after orally administrated with insulin loaded samples or insulin solution, or subcutaneous injected with insulin solution (mean ± SD, n = 4).
Conclusions
In this study, we developed a nanocarrier with structure consisted of graft copolymer micelles and epithelium-targeting TMC-based NPs. The developed NPs possessed significantly enhanced drug protection ability and ameliorated drug release profile compared with micelles. This study also demonstrated that integrin αvβ3 receptor is expressed on the Caco-2 cells. FQS-modified NPs could increase the cellular uptake of insulin and the competition experiments demonstrate that the increased cellular uptake in Caco-2 cells was due to a receptor-mediated mechanism. Endocytosis pathway study indicated that FQS modified NPs could change the cellular uptake mechanism of non-modified NPs. Furthermore, these targeted NPs distributed more in rat intestinal villi in in situ study and demonstrated better hypoglycemic effect in vivo. It is therefore concluded that the FQS modified NPs could specifically interact with αvβ3 receptors in intestinal endothelial cells, and increase their cellular uptake and intestinal villi distribution as a result. The results suggested that FQS peptide was a potent intestine cell-targeting agent and could be used as a promising ligand for oral delivery of peptides and proteins.
Supplementary material available online
Supplementary Figures S1-S5
Supplementary Figures S1-S5
Download PDF (349.3 KB)Declaration of interest
The authors report no conflicts of interest. The authors alone are responsible for the content and utility of the paper.
This work was supported by the national natural science foundation of China (81173010).
References
- Behrens I, Pena AIV, Alonso MJ, et al. (2002). Comparative uptake studies of bioadhesive and non-bioadhesive nanoparticles in human intestinal cell lines and rats: the effect of mucus on particle adsorption and transport. Pharm Res 19:1185–93
- Clark MA, Blair H, Liang L, et al. (2001). Targeting polymerised liposome vaccine carriers to intestinal M cells. Vaccine 20:208–17
- Cui F, Shi K, Zhang L, et al. (2006). Biodegradable nanoparticles loaded with insulin–phospholipid complex for oral delivery: preparation, in vitro characterization and in vivo evaluation. J Control Release 114:242–50
- Du W, Fan Y, Zheng N, et al. (2013). Transferrin receptor specific nanocarriers conjugated with functional 7 peptide for oral drug delivery. Biomaterials 34:794–806
- Frokjaer S, Otzen DE. (2005). Protein drug stability: a formulation challenge. Nat Rev Drug Discov 4:298–306
- Garinot M, Fievez V, Pourcelle V, et al. (2007). PEGylated PLGA-based nanoparticles targeting M cells for oral vaccination. J Control Release 120:195–204
- Guo Z, He B, Jin H, et al. (2014). Targeting efficiency of RGD-modified nanocarriers with different ligand intervals in response to integrin αvβ3 clustering. Biomaterials 35:6106–17
- Gupta S, Jain A, Chakraborty M, et al. (2013). Oral delivery of therapeutic proteins and peptides: a review on recent developments. Drug Deliv 20:237–46
- Hsu L-W, Ho Y-C, Chuang E-Y, et al. (2013). Effects of pH on molecular mechanisms of chitosan–integrin interactions and resulting tight-junction disruptions. Biomaterials 34:784–93
- Hu X, Yang F-F, Quan L-H, et al. (2014). Pulmonary delivered polymeric micelles – pharmacokinetic evaluation and biodistribution studies. Eur J Pharm Biopharm 88:1064–75
- Huang A, Su Z, Li S, et al. (2014). Oral absorption enhancement of salmon calcitonin by using both N-trimethyl chitosan chloride and oligoarginines-modified liposomes as the carriers. Drug Deliv 21:388–96
- Jin Y, Song Y, Zhu X, et al. (2012). Goblet cell-targeting nanoparticles for oral insulin delivery and the influence of mucus on insulin transport. Biomaterials 33:1573–82
- Kang SK, Woo JH, Kim MK, et al. (2008). Identification of a peptide sequence that improves transport of macromolecules across the intestinal mucosal barrier targeting goblet cells. J Biotechnol 135:210–16
- Kim H, Akagi T, Akashi M. (2009). Preparation of size tunable amphiphilic poly(amino acid) nanoparticles. Macromol Biosci 9:842–8
- Kunisawa J, Kurashima Y, Kiyono H. (2012). Gut-associated lymphoid tissues for the development of oral vaccines. Adv Drug Deliv Rev 64:523–30
- Lin YH, Sonaje K, Lin KM, et al. (2008). Multi-ion-crosslinked nanoparticles with pH-responsive characteristics for oral delivery of protein drugs. J Control Release 132:141–9
- Liu H, Gong T, Fu HL, et al. (2008). Solid lipid nanoparticles for pulmonary delivery of insulin. Int J Pharm 356:333–44
- Makhlof A, Tozuka Y, Takeuchi H. (2011). Design and evaluation of novel pH-sensitive chitosan nanoparticles for oral insulin delivery. Eur J Pharm Sci 42:445–51
- Mo R, Jin X, Li N, et al. (2011). The mechanism of enhancement on oral absorption of paclitaxel by N-octyl-O-sulfate chitosan micelles. Biomaterials 32:4609–20
- Nakase I, Niwa M, Takeuchi T, et al. (2004). Cellular uptake of arginine-rich peptides: roles for macropinocytosis and actin rearrangement. Mol Ther 10:1011–22
- Peppas NA, Kavimandan NJ. (2006). Nanoscale analysis of protein peptide absorption: insulin absorption using complexation and pH-sensitive hydrogels as delivery vehicles. Eur J Pharm Sci 29:183–97
- Rekha MR, Sharma CP. (2009). Synthesis and evaluation of lauryl succinyl chitosan particles towards oral insulin delivery and absorption. J Control Release 135:144–51
- Russell-Jones GJ. (2001). The potential use of receptor-mediated endocytosis for oral drug delivery. Adv Drug Deliv Rev 46:59–73
- Sadeghi AMM, Dorkoosh FA, Avadi MR, et al. (2008). Permeation enhancer effect of chitosan and chitosan derivatives: comparison of formulations as soluble polymers and nanoparticulate systems on insulin absorption in Caco-2 cells. Eur J Pharm Biopharm 70:270–8
- Sajeesh S, Bouchemal K, Marsaud V, et al. (2010). Cyclodextrin complexed insulin encapsulated hydrogel microparticles: an oral delivery system for insulin. J Control Release 147:377–84
- Shan W, Zhu X, Liu M, et al. (2015). Overcoming the diffusion barrier of mucus and absorption barrier of epithelium by self-assembled nanoparticles for oral delivery of insulin. ACS Nano 9:2345–56
- Suzuki A, Morishita M, Kajita M, et al. (1998). Enhanced colonic and rectal absorption of insulin using a multiple emulsion containing eicosapentaenoic acid and docosahexaenoic acid. J Pharm Sci 87:1196–202
- Svensen N, Diaz-Mochon JJ, Bradley M. (2011). Decoding a PNA encoded peptide library by PCR: the discovery of new cell surface receptor ligands. Chem Biol 18:1284–9
- Varshosaz J, Pardakhty A, Hajhashemi V-I, et al. (2003). Development and physical characterization of sorbitan monoester niosomes for insulin oral delivery. Drug Deliv 10:251–62
- Wang X-Q, Zhang Q. (2012). pH-sensitive polymeric nanoparticles to improve oral bioavailability of peptide/protein drugs and poorly water-soluble drugs. Eur J Pharm Biopharm 82:219–29
- Yoo M-K, Kang S-K, Choi J-H, et al. (2010). Targeted delivery of chitosan nanoparticles to Peyer's patch using M cell-homing peptide selected by phage display technique. Biomaterials 31:7738–47
- Yun Y, Cho YW, Park K. (2013). Nanoparticles for oral delivery: targeted nanoparticles with peptidic ligands for oral protein delivery. Adv Drug Deliv Rev 65:822–32
- Zhang J, Ma PX. (2009). Polymeric core–shell assemblies mediated by host–guest interactions: versatile nanocarriers for drug delivery. Angew Chem Int Ed 48:964–8
- Zhang N, Ping QN, Huang GH, et al. (2005). Investigation of lectin-modified insulin liposomes as carriers for oral administration. Int J Pharm 294:247–59
- Zhang XW, Qi JP, Lu Y, et al. (2014a). Biotinylated liposomes as potential carriers for the oral delivery of insulin. Nanomed Nanotechnol 10:167–76
- Zhang J, Zhu X, Jin Y, et al. (2014b). Mechanism study of cellular uptake and tight junction opening mediated by goblet cell-specific trimethyl chitosan nanoparticles. Mol Pharm 11:1520–32