
Abstract
Gastro retentive drug delivery system techniques were adopted to deliver drugs having narrow absorption window from a particular site in the GIT. Therefore, gastro retentive dosage forms were retained in the stomach, thus improving absorption and bioavailability would be improved consequently. In this study, cinnarizine (CNZ) was employed as the model drug. CNZ is a poorly soluble basic drug, suffering from low and erratic bioavailability. This is attributed to its pH-dependant solubility (highly soluble at pH < 4). CNZ is characterized by short half-life (3–6 h). Accordingly, floating CNZ emulsion gel calcium pectinate beads were developed. A mixture design was employed to study the effect of the percent of LM pectin (A), the percent of GMO (B) and the percent of Labrafac Lipophile (C) simultaneously on the percent of drug released and loaded. The optimized floating CNZ emulsion gel calcium pectinate beads and Stugeron® (the marketed reference product) were compared through a pharmacokinetic study carried on healthy human volunteers. Fortunately, simple floating CNZ emulsion gel calcium pectinate beads were prepared with zero-order release profile for 12 h. A promising in-vivo CNZ controlled release dosage form with higher bioavailability, when compared to once daily administration of Stugeron® tablets was achieved.
Introduction
Oral controlled release (CR) dosage forms generally have a transit time of 1–3 h in the stomach, 3–5 h in the intestine and 4–11 h in the colon. However, some drugs require more retention time in the stomach for better results (Masaoka et al., Citation2006).
Gastro retentive dosage form can remain for several hours in the gastric region, thus prolonging the gastric residence time of some drugs. Improved bioavailability, reduction of drug waste and improved drugs solubility that are less soluble in a high-pH environment is a predicted result for prolonged gastric retention (Arora et al., Citation2005).
Cinnarizine (CNZ; class II of BCS) possess antihistaminic activity and mainly used for the control of vomiting due to motion sickness (Fernandez et al., Citation2009). CNZ-administering patients suffer from poor compliance due to its dosage regimen of 25 mg three times daily (Shidhaye, Citation2009).
CNZ is a weak basic drug possessing higher solubility at lower pH (0.29 mg/ml in 0.1 N HCl) and lower solubility at higher pH (0.002 mg/ml in phosphate buffer pH 7.2). Its main site of absorption is the stomach (upper part of GIT). In attempt to solve the above-mentioned problems of CNZ (model drug), floating drug delivery system for continuous delivery of CNZ in the stomach was suggested (Streubel et al., Citation2006).
Polysaccharides are widely used in oral drug delivery systems because of the simplicity to obtain the desired drug delivery system and drug release profile as a result of the insolubility of cross-linked beads in gastric environment (Roy & Shahiwala, Citation2009). Ionotropic gelation is based on the ability of polyelectrolytes to cross link in the presence of counter ions to form beads. In a work by Sriamornsak et al. (Citation2008), a new emulsion gelation method was used to prepare oil-entrapped calcium pectinate gel (CaPG) beads as a carrier for intragastric floating drug delivery.
The aim of this research was to statistically optimize simple CNZ emulsion gel calcium pectinate beads using ionotropic gelation method. A mixture design was employed to optimize and study the effect of the percent of LM pectin (A), the percent of GMO (B) and the percent of Labrafac Lipophile (C) simultaneously on the percent of drug released and loaded. A pharmacokinetic study was carried out on healthy human volunteers to compare the optimized CNZ emulsion gel calcium pectinate beads and Stugeron® as the marketed reference product.
Materials and methods
Materials
CNZ HCl was supplied as a gift sample by Minapharm Pharmaceuticals Ltd. (Cairo, Egypt); LM pectins with DE of 36% (GENU pectin type LM101 AS) and 28% (GENU pectin type LM104 AS-FS) were obtained as gift sample from CP Kelco (Lille Skensved, Denmark) and are referred to as GP36 and GP28, respectively; Peceol [Glyceryl monoleate (GMO), liquid, HLB = 3], Labrafac Lipophile WL 1349 [(LL), liquid, medium chain triglycerides, HLB = 1] were obtained as gift sample from Gattefosse (St Priest, Cedex, France); hydrated calcium chloride, ethanol and sodium citrate were obtained from El-Nasr Company for Chemicals and Pharmaceuticals (Cairo, Egypt); hydrochloric acid (HCl) of analytical reagent grade and Stugeron® 25 mg tablets were purchased from the Egyptian market.
Preparation of CNZ-loaded emulsion gel calcium pectinate beads using ionotropic gelation method
CNZ-emulsion gel calcium pectinate beads were prepared by ionotropic gelation according to Sriamornsak’s method (Sriamornsak et al., Citation2008). Briefly, LM-pectin 101, LM-pectin 104, GMO, LL and distilled water were well stirred on a magnetic stirrer (model SP 72220-26, Barnstead/Thermolyne, Dubuque, IA) at 500 rpm, an o/w emulsion was formed and then CNZ was dispersed. The formed o/w emulsion is then dripped via 23 gauge syringe in 100 ml 0.034 M CaCl2 solution at a rate of 2 ml/min. The formed emulsion gel calcium pectinate beads were then filtered, collected and washed with distilled water for three times. Finally, the emulsion gel calcium pectinate beads were dried at 40 °C for 12 h in glass vials.
Experimental design
A mixture experiment is a special type of response surface experiment in which the factors are the components of a mixture, and the response is a function of the proportions of each ingredient (Mura et al., Citation2005).
The peculiar characteristic of a mixture design is that the single components cannot be changed independently of one another since their sum must add up to 100%. This means that mixture factors are expressed as the fraction of the total and their experimental ranges lie between 0 and 100% (Lewis et al., Citation1999; Mura et al., Citation2005).
Experimental design offers the benefit of obtaining highest amount of information with the lowest number of trials, which refers to the simultaneous study of the effect of different variables on the responses and interaction between them (Furlanetto et al., Citation2006).
In the present study, the mixture experimental study was designed based on a three component system: the pectin base (A) (a mixture of LM-101/LM-104, 1:1 w/w), and the oil phase which is composed of: (B) (GMO) and (C) (Labrafac Lipophile WL-1349). The drug content was kept constant at 100 mg/10 g of the prepared calcium pectinate beads. The restrictions imposed on the mixture component proportions are shown in . Four responses were studied: the percent of drug released after 1, 5 and 8 h (Y1, Y2 and Y3, respectively) and the percent of drug loaded (Y4). Seven formulae were suggested by Minitab® software (version 16.1.1), duplicate experimentation was carried out. The results were expressed as mean ± standard deviation (SD).
Table 1. Independent and dependent variables of the D-optimal mixture design.
Drug loading
Five hundred milligrams CNZ-pectin beads were initially sonicated with 3 ml (1% w/v) sodium citrate solution until complete dissolution, then 7 ml ethanol was added to the above solution to gel the solubilized calcium pectinate and further solubilize CNZ. This solution was filtered through millipore filter 0.2 µm. The filtrate was assayed for drug content by a validated UV spectrophotometer method at 253 nm using UV–visible spectrophotometer (Shimadzu, Japan) using ethanol as a blank after suitable dilutions (El-Kamel et al., Citation2003).
% Yield
The actual weight of beads was determined and compared to the theoretical one. The total yield was then calculated according to the following equation:
(1)
In-vitro drug release study
The release of CNZ from floating beads was determined in a USP paddle type (II) dissolution apparatus (Hanson Research, Chatsworth, CA). A weighed amount of beads equivalent to 25 mg drug was placed in the dissolution apparatus. Nine hundred milliliters of the 0.1 N HCl (pH 1.2) was used as the dissolution medium. The dissolution fluid was maintained at 37 ± 0.5 °C at a rotation speed of 100 rpm. Five milliliters samples were withdrawn at specified intervals, passed through a 0.2-μm membrane filter (Millipore, Billerica, MA), and the initial volume of the dissolution fluid was maintained by adding 5 ml of fresh dissolution fluid after each withdrawal. Samples were analyzed using a UV–visible spectrophotometer (Shimadzu, Japan) at 253 nm.
Determination of swelling properties
The swelling property of the beads was determined by placing the beads in the dissolution media (0.1 N HCl) for 8 h, and the swollen beads were collected, blotted with filter paper to remove absorbed water and then weighed immediately on an electronic balance. The percentage of swelling was then determined as in Equation (Equation2(2) ) (Badve et al., Citation2007):
(2)
Analysis of the D-optimal mixture design
The responses of all model formulations were treated by Minitab® software (version 16.1.1). Suitable models for mixture designs consist of three components which include linear, quadratic and special cubic models.
For linear model:
(3)
For quadratic model:
(4)
For special cubic model:
(5)
where Y is the dependent responses, b1–b123 are the coefficients of the respective values to their interaction terms.
The best fitting mathematical model was selected based on the comparisons of several statistical parameters including the standard deviation (SD), the multiple correlation coefficients (R2), adjusted multiple correlation coefficients (adjusted R2) and the predicted residual sum of square (PRESS) provided by Minitab® Software. Among them, PRESS indicates how well the model fits the data, and for the chosen model it should be small relative to the other models under consideration (Huang et al., Citation2004; Basalious et al., Citation2010).
Scanning electron microscope
Optimized floating CNZ emulsion gel calcium pectinate beads were investigated using scanning electron microscope to visualize its surface morphology at different magnification powers. The sample for scanning electron microscope (SEM) was prepared by sticking the beads on a double adhesive tape, which stuck to an aluminum stub. The stubs were then coated with gold to a thickness of about 300 Å using a sputter coater (Jain & Gupta, Citation2009). These samples were then randomly scanned, and photomicrographs were taken.
Floating time (floating behavior)
The gel beads (n = 20 beads) were placed in conical flasks with 50 ml 0.1 N HCl (pH 1.2). The flask was shaken at 100 rpm at 37 °C in a shaking incubator. Their buoyancy was observed for 8 h.
In-vivo pharmacokinetic study
Experimental design was adopted for the evaluation of pharmacokinetics parameters of the optimized formula (CNZ emulsion gel calcium pectinate beads) compared to the commercially available immediate release tablets Stugeron® containing 25 mg CNZ (reference product) after single administration. Six healthy human volunteers were employed in the study, and none of them were on treatment 1 week before the study. The study was fully explained to the volunteers before being carried out. The study followed the ethics for treatment of human volunteers approved by Cairo University Ethical Committee. An informed consent was signed by each volunteer after they had understood the aim of their participation in the study.
The study was performed on two periods. Period I: Stugeron® tablets were administrated by three human volunteers (group I), the other three human volunteers (group II) administered optimized CNZ calcium pectinate beads equivalent to 25 mg CNZ. Twelve hours fasting with free access to water was demanded from the human volunteers. The volunteers administered the formulae orally with 200 ml water. A wash out period of 1 week separated the two periods. Period II: the two groups were interchanged.
Blood samples (5 ml) for assay of plasma concentrations of CNZ were obtained via the indwelling cannula immediately prior to dosing and at the time of 0.5, 1.0, 1.5, 2.0, 2.5, 3.0, 3.5, 4.0, 6.0, 8.0, 10.0, 12.0 and 24 h after oral administration. Heparinated polyethylene tubes were used and were centrifuged immediately at 3000 rpm for 5 min. The plasma obtained was frozen at −20 °C in labeled polypropylene tubes till LC-MS/MS analysis. LC-MS/MS method for quantitative determination of CNZ was previously described by the author’s in another work (Abouelatta et al., Citation2015). Briefly, plasma concentrations of CNZ were analyzed using a validated LC-MS/MS method. LC system (Agilent 1260®, Germany) coupled with triple quadropole MS/MS detector (Agilent 6410®, Germany) was used. The chromatographic separation was carried out on a C18 Poroshell®120, 4.6 × 50 mm, 2.7 μm. The mobile phase was composed of 10 mM ammonium acetate pH 3.3: acetonitrile [35:65] (v/v). The flow rate was set as 0.4 ml/min, and sildenafil was used as an internal standard (Abouelatta et al., Citation2015).
After oral administration of the two treatments of CNZ, pharmacokinetic parameters were determined from plasma concentration time profiles by means of non-compartmental analysis using Kinetica® (version 5, Thermo Fischer Scientific, Waltham, MA). Maximum CNZ concentration (Cmax, ng/ml) and the time required to reach maximum CNZ concentration (Tmax, h) were obtained from the individual plasma concentration time curves. The elimination rate constant (K, h−1) was obtained from the slope of the linear regression of the log-transformed plasma concentration–time data in the elimination phase. Elimination half-life (t1/2, h) was calculated from the formula 0.693/K. The area under the plasma concentration–time curve (AUC0 to ∞) was subdivided into AUC0 to 24 (determined as the area under the plasma concentration–time curve up to the last measured sampling time and calculated by the linear trapezoidal rule) and area under the curve from Ct to infinity (AUCt to ∞); where AUC0 to ∞ = AUC0 to 24 + Ct/K (Ct is the last sample concentration at time t).
The pharmacokinetic parameters (Cmax; AUC0–24 and AUC0−∞) of the optimized CNZ-loaded emulsion gel calcium pectinate beads and the reference treatment (Stugeron®) were compared statistically using ANOVA with a level of significance of 0.05, and a p value smaller than 0.05 was considered significant.
Results and discussion
Analysis of the D-optimal mixture design
D-optimal mixture design can be considered as a tailored form of classic mixture designs. These designs are more robust to constraints and can produce complex designs with many design constraints. Correlation between effect estimates can be adopted by D-optimal design, and this shows the difference between standard and classical design of experiments (factorials and fractional factorials) and D-optimal design matrices (Lewis et al., Citation1999). The Minitab® software (version 16.1.1) suggested seven formulae prepared in duplicate. The observed responses are recorded in . The observed responses (Y1, Y2, Y3 and Y4) were fitted to the previously mentioned models (Linear, Quadratic or special cubic) as shown in , and the model is selected according to the lowest predicted sum of squares (PRESS). The equations fitting each of the studied factors (A, B and C) to the observed responses (Y1, Y2, Y3 and Y4) according to its preferred model are shown in .
Table 2. The formulations of the mixture design and their characterization results.
Table 3. Regression results of the measured responses.
Table 4. The selected equations describing each response of floating CNZ emulsion gel calcium pectinate beads.
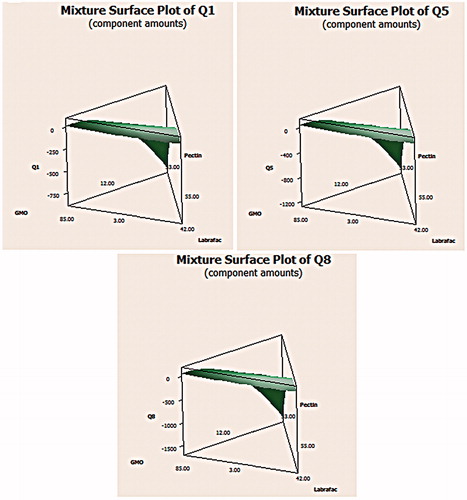
The release of CNZ from oil entrapped emulsion gel calcium pectinate beads was observed to vary depending on the composition of each batch as shown in . It was clearly found that some formulations showed biphasic release pattern characterized by an initial burst release 52.62% in half an hour followed by gradual slow release to reach 100% after 8 h. On contrary to that, some formulations showed gradual release varying from 7.28 to 16.16% in the first half an hour of release and reached up to 70% CNZ released after 8 h. The 3D surface plot in showed that the percent of drug released after 1 h (Y1) had followed the quadratic model, whereas the percent of drug released after 5 and 8 h (Y2 and Y3) was found to follow the linear model as shown in . When the percent of pectin (A) was increased in the formula, an antagonistic effect on the percent of drug released at different time intervals was increased. This could be attributed to the formation of loose gel as a result of low-pectin concentrations. CNZ could be easily released due to the absence of steric entanglements and thus absence of strong barrier. Gel strength could be considered the determining factor in case of CNZ release from pectinate matrices which depend mainly on the diffusion of the drug through the pores of the polymer network (Sriamornsak & Nunthanid, Citation1999). Whereas on increasing the oily phase represented by GMO and LL (B and C), a synergistic effect on the percent of drug released at different time intervals was observed. The significance of LL was found to be larger than that of GMO at the different time intervals. This might be referred to its nature as a medium chain triglyceride which is well reported as a bioavailability enhancer in case of poor water soluble drugs (Wang et al., Citation2008). By the use of pectinate and employing oil entrapment technique, drug could be maintained in the stomach to allow better absorption.
Figure 1. In-vitro release profile of CNZ from emulsion gel calcium pectinate beads formulae in 0.1 N HCL.
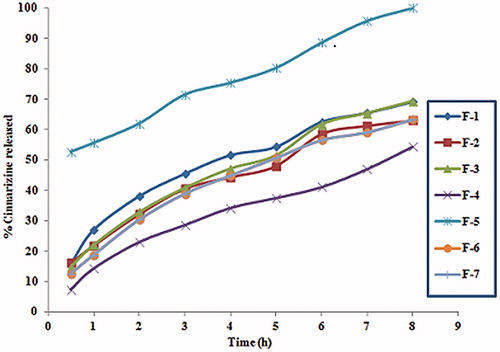
Figure 2. The 3D surface plot of floating CNZ calcium pectinate bead formulations at different time intervals.
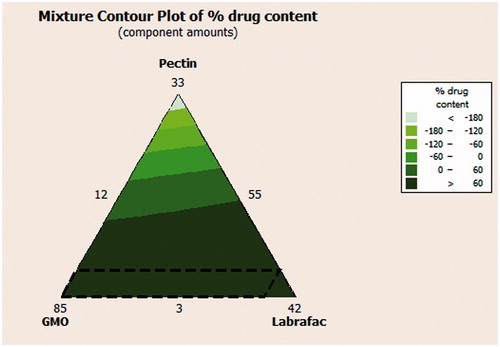
Referring to the percent of drug loaded, the mean percent of loaded drug was observed to range from 76.92 to 96.45%, as well as the percent yield varied from 80.01 to 86.92% which indicated good recovery percent. The 2D contour plot in revealed that the percent of drug loaded (Y4) was found to follow the quadratic model as shown in . The percent of pectin (A) in the formula played an antagonistic role on the amount of CNZ loaded. On the other hand, increasing the amounts of the oily phase (GMO and LL) (B and C), the percent of CNZ loaded was increased; thus, a synergistic effect was observed. The previously mentioned observations might be due to increased pectin where Ca2+ in CaCl2 solution became saturated causing pre-gelation, a rapid reaction between pectin molecules and calcium ions, resulting in non-homogeneous gel structure (Pawar et al., Citation2008). On the other hand, wetting of drug particles with the liquids having lipid nature (GMO and LL) enhanced drug loading (Patel et al., Citation2012).
Figure 3. The 2D contour plot describing the percent of drug entrapped.
Optimization
The aim of the optimization of pharmaceutical formulations is generally to determine the levels of the variable from which a robust product with high-quality characteristics may be produced (Basalious et al., Citation2010). The Minitab® software (version 16.1.1) automatically suggested one optimum formula after correlating both dependant and independent factors based on desirability function. The suggested optimized formula was characterized to have zero-order release profile for 12 h with maximum loading efficiency. shows the constraints used in the optimization process.
Table 5. The observed and predicted values for the optimized formulation.
As shown in , the optimized formula values were 3.28% LM-pectin (A), 70.54% GMO (B) and 26.17% Labrafac Lipophile (C).
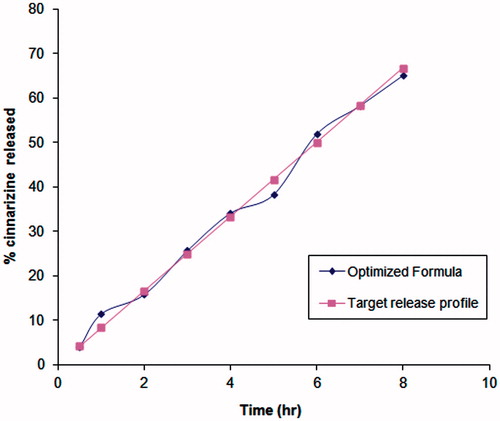
A check point batch was prepared according to the predetermined software values. The release profile for the check point batch was compared to the target release profile as shown in . Minimum residual was observed between both the expected and the observed values of the studied responses as shown in . Therefore, the previously mentioned results indicate the validity of the design.
Figure 4. Release of CNZ from the optimized floating emulsion gel calcium pectinate beads formulation.
Swelling index
The swelling of CNZ-loaded calcium pectinate beads was carried out in 0.1 N HCl. SI is represented in and . It was observed that on increasing the percent of pectin in the formula, the SI was decreased. This could be attributed to the protonation of pectin at acidic pH forming an insoluble form of minimum swelling (Badve et al., Citation2007).
Figure 5. 3D surface plot showing swelling index of CNZ-loaded calcium pectinate beads.
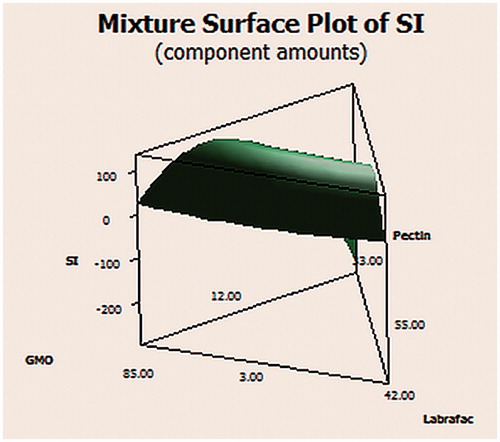
Table 6. Floating CNZ emulsion gel calcium pectinate beads in the mixture design and optimized formula with their % SI.
Morphological examination and SEM
The photo of emulsion gel calcium pectinate beads loaded with CNZ showed that the beads were white, translucent and almost spherical after drying. The beads become somehow less spherical as a result of gradual water diffusion during drying as shown in . SEM micrographs at different magnification powers were shown in for the optimized CNZ-loaded calcium pectinate beads. CNZ emulsion pectinate beads are almost spherical with smooth external surface. On further magnification, an intact smooth surface was observed as well as pores on the surface were noticed which might be representing the oil droplets (Sriamornsak et al., Citation2004).
Figure 6. A light photo for the optimized CNZ-loaded calcium pectinate beads.
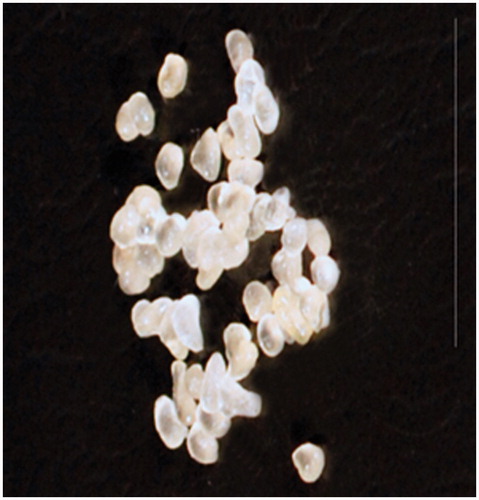
Figure 7. SEM micrographs of CNZ-loaded calcium pectinate beads at different magnification powers. (a,b) Before release in 0.1 N HCl. (c,d) after 8 h release in 0.1 N HCl.
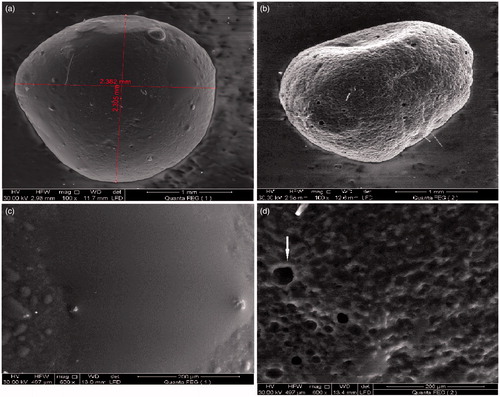
After 8 h release, SEM micrographs showed sponge-like structure corresponding to the egg-box model which is rigid and water insoluble (Sriamornsak et al., Citation2004). On magnification, the external surface showed honey-comb-like structure with large wide pores which might be due to swelling of the beads in the release media, and these pores were suggested to be the way through which the drug was released into the media.
Floating time (floating behavior)
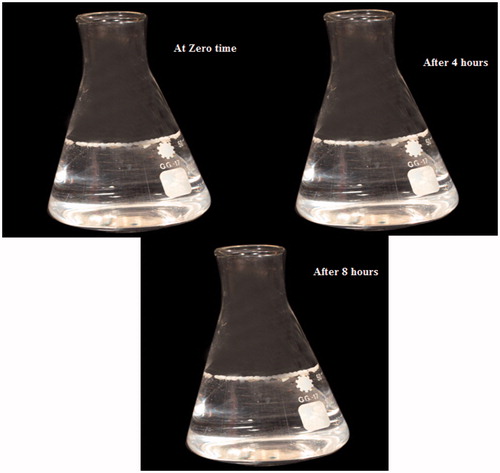
The emulsion gel calcium pectinate beads could float immediately with no lag time and remained floating for 8 h (Sriamornsak et al., Citation2008) as shown in . The beads floated with an oil amount of 30% (w/w). It was observed that GMO swelled in water and the swollen mass floated for a prolonged period of time (Kumar et al., Citation2004). Good in-vitro floating behavior in 0.1 N HCl was observed. The floating properties of the emulsion gel beads may be attributed to the low-apparent density of the beads containing oils (Sriamornsak et al., Citation2004). This implied that the beads will have the tendency to exhibit a good in-vivo floating effect (Sriamornsak et al., Citation2008).
Figure 8. CNZ-loaded calcium pectinate beads in 0.1 N HCL at zero time, after 4 and 8 h.
In-vivo pharmacokinetic study
Chromatograms showing blank human plasma and optimized CNZ-loaded emulsion gel calcium pectinate beads after oral administration are attached in and . Mean plasma concentrations of CNZ–time curves achieved after single administration of both Stugeron® 25 mg, and the optimized calcium pectinate emulsion gel beads equivalent of 25 mg CNZ is shown in . clarifies the pharmacokinetic parameters following the oral administration of both formulae. Optimized CNZ-loaded emulsion gel calcium pectinate beads showed that there was significant difference (p < 0.05) in case of AUC0 to ∞ compared to the commercially available Stugeron tablets, while insignificant difference (p > 0.05) was declared in case of Cmax, Tmax and AUC0 to 24.
Figure 9. LC-MS/MS chromatograms of blank human plasma.
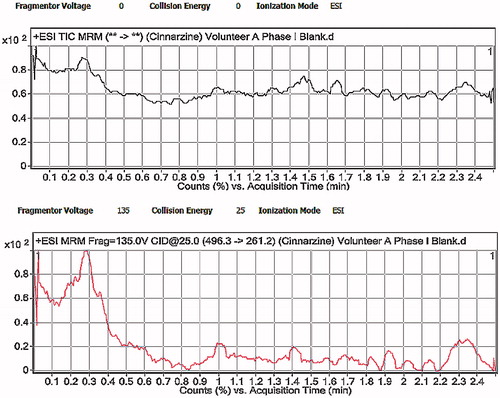
Figure 10. LC-MS/MS chromatograms of human plasma after oral administration of CNZ optimized formula.
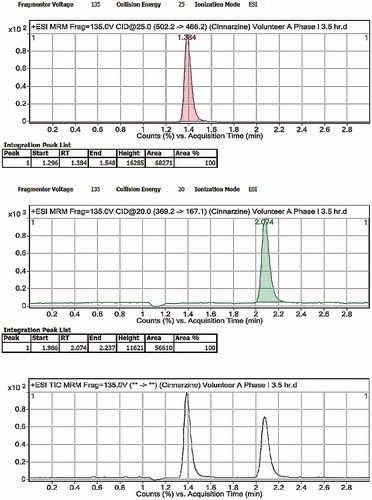
Figure 11. Plasma concentration–time curve of Stugeron® tablets and optimized CNZ emulsion-loaded calcium pectinate beads.
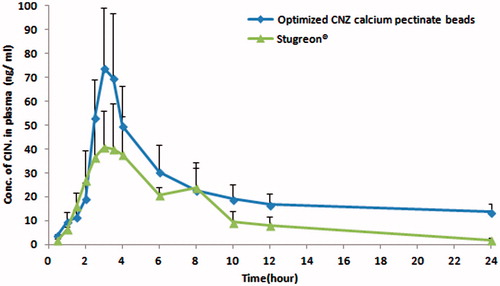
Table 7. Mean pharmacokinetic parameters of Stugeron® tablets and optimized CNZ calcium pectinate beads.
The mean AUC0 to24 and the AUC0 to ∞ of the optimized CNZ-loaded emulsion gel calcium pectinate beads was found to be 1.79 and 3.80 times that of Stugeron® tablets, respectively. The increased Cmax and higher AUC indicate a slow and prolonged release of the optimized CNZ-loaded emulsion gel calcium pectinate beads formula with higher bioavailability in comparison with the commercially available Stugeron® tablets. According to the previously mentioned results, the optimized CNZ-loaded emulsion gel calcium pectinate beads offered in-vivo prolonged release for CNZ over 12 h with higher bioavailability compared to once daily administration of commercially available Stugeron® tablets. On increasing residence of CNZ in the acidic medium of the stomach, gradual release of CNZ in the stomach was observed leading to increased bioavailability of the drug and prolonged plasma concentration profile.
Conclusion
The achieved optimized CNZ emulsion gel calcium pectinate beads were suggested to be a selected candidate for continuous delivery of CNZ in the stomach that would be potentially suitable for once daily administration, with excellent floating properties, high-loading efficiency and zero-order release pattern. A promising in-vivo CNZ controlled release dosage form with higher bioavailability, when compared to once daily administration of Stugeron® tablets, was achieved.
Acknowledgements
The authors would like to thank PharmaSolutions Research Center, Cairo, Egypt, for performing the in-vivo study section.
Declaration of interest
The authors report no declaration of interest. Only the authors are responsible for the content and writing of this paper.
References
- Abouelatta SM, Aboelwafa AA, Khalil RM, Elgazayerly ON. (2015). Floating lipid beads for the improvement of bioavailability of poorly soluble basic drugs: in-vitro optimization and in-vivo performance in humans. Eur J Pharm Biopharm 89:82–92
- Arora S, Ali J, Ahuja A, et al. (2005). Floating drug delivery systems: a review. AAPS PharmSciTech 6:E372–90
- Badve SS, Sher P, Korde A, Pawar AP. (2007). Development of hollow/porous calcium pectinate beads for floating-pulsatile drug delivery. Eur J Pharm Biopharm 65:85–93
- Basalious EB, Shawky N, Badr-Eldin SM. (2010). Snedds containing bioenhancers for improvement of dissolution and oral absorption of lacidipine: I. Development and optimization. Int J Pharm 391:203–11
- El-Kamel AH, Al-Gohary OM, Hosny EA. (2003). Alginate-diltiazem hydrochloride beads: optimization of formulation factors, in vitro and in vivo availability. J Microencapsul 20:211–25
- Fernandez S, Chevrier S, Ritter N, et al. (2009). In vitro gastrointestinal lipolysis of four formulations of piroxicam and cinnarizine with the self emulsifying excipients labrasol and gelucire 44/14. Pharm Res 26:1901–10
- Furlanetto S, Cirri M, Maestrelli F, et al. (2006). Study of formulation variables influencing the drug release rate from matrix tablets by experimental design. Eur J Pharm Biopharm 62:77–84
- Huang YB, Tsai YH, Yang WC, et al. (2004). Once-daily propranolol extended-release tablet dosage form: formulation design and in vitro/in vivo investigation. Eur J Pharm Biopharm 58:607–14
- Jain SK, Gupta A. (2009). Development of gelucire 43/01 beads of metformin hydrochloride for floating delivery. AAPS PharmSciTech 10:1128–36
- Kumar MK, Shah MH, Ketkar A, et al. (2004). Effect of drug solubility and different excipients on floating behaviour and release from glyceryl monooleate matrices. Int J Pharm 272:151–60
- Lewis GA, Mathieu D, Phan RTL. (1999). Pharmaceutical experimental design. New York: Dekker
- Masaoka Y, Tanaka Y, Kataoka M, et al. (2006). Site of drug absorption after oral administration: assessment of membrane permeability and luminal concentration of drugs in each segment of gastrointestinal tract. Eur J Pharm Sci 29:240–50
- Mura P, Furlanetto S, Cirri M, et al. (2005). Optimization of glibenclamide tablet composition through the combined use of differential scanning calorimetry and d-optimal mixture experimental design. J Pharm Biomed Anal 37:65–71
- Patel D, Dasgupta S, Dey S, et al. (2012). Nanostructured lipid carriers (NLC)-based gel for the topical delivery of aceclofenac: preparation, characterization, and in vivo evaluation. Sci Pharm 80:749
- Pawar AP, Gadhe AR, Venkatachalam P, et al. (2008). Effect of core and surface cross-linking on the entrapment of metronidazole in pectin beads. Acta Pharm 58:78–85
- Roy P, Shahiwala A. (2009). Multiparticulate formulation approach to pulsatile drug delivery: current perspectives. J Control Release 134:74–80
- Shidhaye SS. (2009). Sustained release floating drug delivery system of in-situ gelling suspension of cinnarizine. J Pharm Res 2:449
- Sriamornsak P, Asavapichayont P, Nunthanid J, et al. (2008). Wax-incorporated emulsion gel beads of calcium pectinate for intragastric floating drug delivery. AAPS PharmSciTech 9:571–6
- Sriamornsak P, Nunthanid J. (1999). Calcium pectinate gel beads for controlled release drug delivery: II. Effect of formulation and processing variables on drug release. J Microencapsul 16:303–13
- Sriamornsak P, Thirawong N, Puttipipatkhachorn S. (2004). Morphology and buoyancy of oil-entrapped calcium pectinate gel beads. AAPS PharmSciTech 6:E24
- Streubel A, Siepmann J, Bodmeier R. (2006). Drug delivery to the upper small intestine window using gastroretentive technologies. Curr Opin Pharmacol 6:501–8
- Wang S, Sun M, Ping Q. (2008). Enhancing effect of Labrafac Lipophile wl 1349 on oral bioavailability of hydroxysafflor yellow a in rats. Int J Pharm 358:198–204