
Abstract
A nano-liposomal carrier was prepared for the anti-inflammatory drug prednisolone acetate (PA). The drug showed remarkable loading in the nano-carriers. The drug-loaded nano-liposmes with average sizes of about 186 nm and zeta potentials of −20 mV were obtained. Our drug release studies showed an apparently zero-order trend with only 18% of the drug released in the first 120 h. Fourier transform infrared (FT-IR) spectroscopy and differential scanning calorimetry (DSC) analyses showed no chemical interaction between the drug and carrier. Transmission electron microscopy (TEM) imaging showed near-spherical drug-containing nano-carriers. The intramuscular (IM) trial of the nanoformulation compared with the free drug showed both pharmacokinetic (lower Cmax, higher area under the curve (AUC)) and pharmacodynamic (higher and longer lasting anti-inflammatory effect, both macroscopically and biochemically) superiority for the nano-liposomal drug above the free prednisolone in rats.
Introduction
Glucocorticoids belong to one of the main important classes of immunosuppressive and anti-inflammatory drugs widely used in treatment of many diseases such as allergies, asthma, autoimmune diseases and sepsis (McDonough et al., Citation2008; Leroy et al., Citation2015). However, chronic use of these drugs often leads to severe systemic side effects like immunosuppression, thinning of the skin, osteoporosis, induction of diabetes and adrenal failure, thus decreasing patient’s quality of life (Saag, Citation2002; Schiffelers et al., Citation2006; van den Hoven et al., Citation2011; Leroy et al., Citation2015).
Nowadays, liposomes are considered as promising nano-carriers in design and fabrication of efficient drug delivery systems (Samad et al., Citation2007; Allen & Cullis, Citation2013; Paliwal et al., Citation2015). The nano-carriers are fluid lipotropic vesicles consisting of a hydrophilic core surrounded by one or more bilayers made of natural or synthetic amphiphilic lipids. The vesicular membrane enables the encapsulation of pharmacologically active agents, either in the layer itself for lipophilic compounds, or in the aqueous core for hydrophilic compounds. It has been reported that the therapeutic activity of glucocorticoids could be improved through encapsulation of the drugs into the drug carriers (Mishina et al., Citation1994; Liao et al., Citation2001; Ozbakir et al., Citation2014). Accordingly, many people have tried to employ the drug-loaded vesicular nanostructures for the treatment of inflammatory disorders (Ozbakir et al., Citation2014).
Prednisolone, a steroidal anti-inflammatory agent, is widely used in human and veterinary medicine. The drug generates anti-inflammatory effects by binding to glucocorticoid receptors, thus triggering signal transduction pathways (De Bosscher & Haegeman, Citation2009). Prednisolone has poor pharmacokinetic profile, thereby rendering it ineffective in treatment and necessitates high dosages and frequent administration, which in turn, causes an array of adverse systemic effects, including diabetes mellitus, osteoporosis and hypertension(Czock et al., Citation2005). In order to overcome the above-mentioned problems and to improve the pharmacokinetic profile, development of the slow-release dosage forms of the drug is highly desirable (Schmidt et al., Citation2003; Schiffelers et al., Citation2005; Lobatto et al., Citation2015; van der Valk et al., Citation2015). On the other hand, encapsulation of prednisolone in long-circulating liposomes can potentially increase drug levels at the site of the action thus improving the therapeutic efficacy (Metselaar et al., Citation2004; Schiffelers et al., Citation2006). Although there are many examples regarding the use of prednisolone encapsulated liposome (PEL) in the treatment of chronic diseases, the application of PEL in the acute inflammations with intramuscular (IM) administration has not been fully investigated and their pharmacokinetic (PK) and pharmacodynamic (PD) studies are still lacking (Metselaar et al., Citation2003; Schmidt et al., Citation2003; Banciu et al., Citation2006; Banciu et al., Citation2008; Hofkens et al., Citation2011; Hofkens et al., Citation2013; Ozbakir et al., Citation2014; Lobatto et al., Citation2015; van der Geest et al., Citation2015).
The aim of this investigation was to prepare, characterize and evaluate a slow-release PEL drug delivery system along with PK and PD studies in order to obtain an efficient liposomal form of prednisolone in treatment of acute paw inflammation as a model disease. To gain further insight into the potency of PEL, effects of both free prednisolone and the PEL on interleukin 6 (IL-6) levels as a typical indicator of the inflammation were also investigated.
Materials and methods
Materials
Phosphatidylcholine (Lipoid, NY) was purchased locally. Prednisolone acetate (PA) was kindly donated by Behdashtkar Pharmaceutical Laboratories (Rasht, Iran). Lactose monohydrate (Merck, Darmstadt, Germany) and carrageenan (Sigma, St Louis, MO) were all purchased locally. All other chemicals and solvents were from general lab or high performance liquid chromatography (HPLC) purity grades as needed, and were purchased locally.
Animals
Male Wistar rats (Razi Institute, Karaj, Iran) weighing 250 ± 20 g were used in this study. The animals were kept in standard cages with free access to water and standard rat chow. The animals were cared for in accordance with the guidelines of the Zanjan University of Medical Sciences.
Preparation of the PEL
The “ethanol injection” method was used as straightforward, cost-effective and one of the popular procedures for the preparation of the PEL (Meure et al., Citation2008). For this purpose, 30 mL ethanolic solution of phosphatidylcholine and PA with concentrations of 16.6 mg/mL for both components was prepared and, then, was added gradually with a rate of 0.65 mL/min (B. Braun, Perfusor® compact S, Infusion Pumps, Melsungen, Germany) to a volume of 50 mL of distilled water in ambient temperature. The aqueous receiving phase was mixed at a rate 140 g (Heidolph, 2102 control, Schwabach, Germany) during the addition of the ethanol phase and 60 min afterward. The prepared nanodispersion was, for some parts of the study, freeze-dried after the addition of 0.5 g/100 mL lactose using a freeze-dryer (Eyela, model FDU-2100, Tokyo, Japan).
Characterization of the PEL
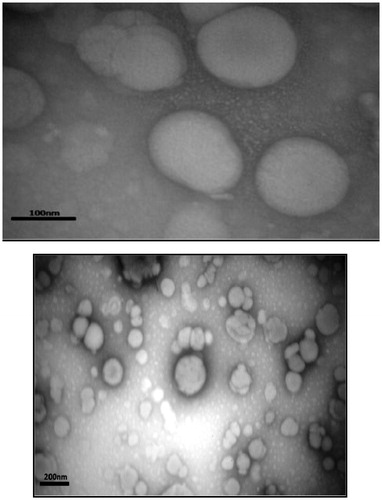
Particle size and zeta potential of the PEL were measured by dynamic light scattering (Malvern Instruments, Worcestershire, UK, model Nano ZS) after dilution with deionized water. Fourier transform infrared (FT-IR) spectra were collected on a FT-IR spectrometer (Bruker, Tensor 27, Biotage, Germany). The spectra were recorded from 4000 cm−1 to 400 cm−1. Differential scanning calorimetry (DSC) analysis, calibrated by indium, was carried out at a heating rate of 10 °C/min and the weight range of 4–10 mg over the temperature range of 0–300 °C (Mettler Toledo, model Star SW 9.30, Greifensee, Switzerland). Transmission electron microscopy (TEM) of the PEL was studied using an electron microscope (Zeiss, model EM10C 80 KV, Jena, Germany). The sample was immobilized on copper grids, stained using uranyl acetate (1%), dried at room temperature and then observed directly using TEM.
Drug loading parameters
To evaluate the drug loading in the PEL, two widely used parameters including loading efficiency and efficiency of entrapment were used. In order to determine the drug loading parameters, a typical drug-loaded nanodispersion sample was prepared and immediately after the preparation, 1 mL aliquot was filtered through a nanofilter (Viva products, model VNO1H229, MA) assembled on a centrifuge micro tube (Millipore, Centriplus YM-100, Billerica, MA) using a micro tube centrifuge at 42 000 g for 15 min (Sigma, model 3K30, Dorset, UK). The filtrate was analyzed spectrophotometrically at 240 nm for the drug concentration which is, in fact, the unloaded drug concentration. The loading parameters of PA in our nano-liposomes were calculated as:
Drug release
The drug release behavior of the PEL was studied in phosphate-buffered saline (PBS) with PH = 7.4. Briefly, 3 mL aliquots of the PEL was placed into a dialysis bag (cut-off 12 kDa) and dialyzed against 50 mL of PBS at 37 °C under mild stirring. Immediately after immersion (time zero) and at 1, 2, 4, 8, 12, 24, 48, 72, 96 and 120 h, a 1 mL sample was taken from the dialysate and analyzed for drug concentration spectrophotometrically at 240 nm. A control sample containing PA with the same concentration was put at the same condition as the positive control with unrestricted release. Finally, the drug release profile was made by plotting the percentage drug release at each time point against the corresponding times.
Stability of the PEL
In order to evaluate the stability of PEL, a typical sample of the drug containing nanodispersion was prepared and divided to two portions. One portion was put in ambient temperature and another at 4 °C. The particle size and zeta potential distribution of the PEL were monitored by DLS, as specified, at 0, 1, 2, 4, 8, 12, 24 and 48 h times. The samples then, were both freeze-dried and the dried forms were re-dispersed in distilled water and the particle size and zeta potential distribution of the re-dispersed samples were determined as described earlier in this article.
HPLC assay
The concentrations of prednisolone in animal plasma samples were determined using a reversed-phase HPLC method (Dési et al., Citation2008). Briefly, the rat plasma samples were vortex-mixed with an equal volume of acetonitrile for 5 min for protein precipitation and the resulting suspension was, then, centrifuged at 13 000 g for 10 min. Fifty micro-liter of the supernatant was injected to chromatograph. A double-reciprocating HPLC pump (Waters 1525 Binary HPLC Pump, MI) was used for solvent delivery. A C18 column (Perfectsil, MZ-Analysentechnik, Mainz, Germany; 250 × 4.6 mm, particle size 5 μm) equipped with a pre-column with the same packing was used as the stationary phase. A mobile phase consisting of water and acetonitrile (75:25; V:V) was run through the column with a flow rate of 1 mL/min. The analyte detection was made using a UV detector (Waters 2487 Dual λ Absorbance Detector, MI) at a wavelength of 240 nm. The outputs of the detector were processed using compatible software.
Pharmacokinetic studies
For pharmacokinetic study, 12 male Wistar rats with the mean weight of 250 ± 20 g were kept under standard feeding condition with 12-h light–dark timer. The day before the experiments, the rats were anesthetized by intraperitoneal (IP) injection of a ketamine-xylazine cocktail (xylazine 10 mg/kg and ketamine100 mg/kg). Next, a polyethylene-silicone rubber cannula was inserted in the right jugular vein using a standard surgical protocol (Waynforth & Flecknell, Citation1980). On the other hand, the PEL was dispersed in sterilized and deionized water (SDW) and the free drug PA was dissolved in hydro-alcoholic vehicle (80:20; H2O:EtOH).. Both the drug-containing formulations had 40 μg/mL PA. The rats were kept overnight while caged singly with free access to water and chow. In the day of drug trial, six rats received the PEL in an equivalent dose of 16 μg/kg PA as IM injection via the thigh muscle and the control group of another six rats received the equal dose of free drug dissolved in ethanol. At the time immediately before injection and after 1, 2, 3, 4, 6, 8, 12, 24, 48 and 72 h, 0.5 mL blood samples were collected via the cannula in pre-heparinized poly propylene microtubes and after centrifuging the samples in 1000 g for 15 min the plasma fractions were kept at −18 °C until the time of drug assay.
Pharmacodynamic studies
For pharmacodynamic analyses of the developed nanoformulation, 60 male Wistar rats with the mean weight of 250 ± 20 g were kept under standard feeding condition and 12-h light–dark timer, and were divided into 10 groups (A–J), each containing six rats, as following:
Healthy control: IM injection of dimethyl sulfoxide (DMSO) plus 100 μL subcutaneous (SC) injection of SDW in paw;
Healthy control: IM injection of SDW plus 100 μL SC injection of SDW in paw;
Inflammation with no treatment: IM injection of DMSO plus 100 μL SC injection of carrageenan (0.1% in saline) in paw;
Inflammation with no treatment: IM injection of SDW plus 100 μL SC injection of carrageenan (0.1% in saline) in paw;
Inflammation with low-dose PA: IM injection of 2.5 mg/kg PA solution in DMSO plus 100 μL SC injection of carrageenan (0.1% in saline) in paw;
Inflammation with mid-dose PA: IM injection of 5 mg/kg PA solution in DMSO plus 100 μL SC injection of carrageenan (0.1% in saline) in paw
Inflammation with high-dose PA: IM injection of 10 mg/kg PA solution in DMSO plus 100 μL SC injection of carrageenan (0.1% in saline) in paw
Inflammation with low-dose PEL: IM injection of the PEL equivalent to 2.5 mg/kg PA dispersed in SDW plus 100 μL SC injection of carrageenan (0.1% in saline) in paw;Inflammation with mid-dose PEL: IM injection of the PEL equivalent to 5 mg/kg PA dispersed in SDW plus 100 μL SC injection of carrageenan (0.1% in saline) in paw;
Inflammation with high-dose PEL: IM injection of the PEL equivalent to 10 mg/kg PA dispersed in SDW plus 100 μL SC injection of carrageenan (0.1% in saline) in paw.
The PEL as well as the free drug PA were injected as two IM doses via the thigh muscle 12 h and 1 h before the induced inflammation. Subcutaneous injection of carrageenan was used to induce the inflammation in the rat paw. The thickness of paws was measured by caliper (Jade, digital caliper, UK) within 0, 1, 2, 3 and 4 h after the injections to confirm the inflammation. In order to measure the inflammation, the thicknesses of paws within the times were subtracted from the thickness before the injection. On the other hand, the IL-6 levels in animal sera were used as an indicator of the inflammation (Metselaar et al., Citation2003). In order to determine the IL-6 level, blood samples were collected from retro orbital sinus into heparinized microtubes, immediately after carrageenan injection and also 12 h thereafter. The sera were separated and kept frozen at −70 °C until the measurements of IL-6. The serum concentrations of IL-6 were measured using a commercially available ELISA kit (Bioscienes, Rat IL-6 ELISA Set, CA) read by an ELISA reader (BioTek, model ELX800, Winooski, VT).
Statistical analysis
Descriptive data were expressed as mean ± SEM. Comparison of different groups was carried out by the nonparametric Kruskal–Wallis test. All analyses were performed using IBM SPSS statistics software, version 22 for Windows (SPSS Inc., Chicago, IL). In all comparisons p < 0.05 was considered significant.
Results and discussion
Size and zeta potential distribution
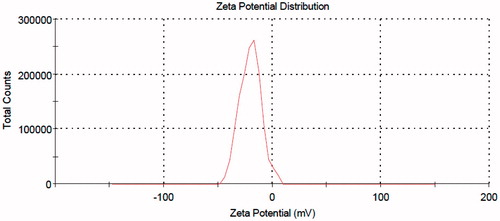
When liposomes are used as drug carrier, it is well known that their physicochemical properties such as particle size and surface charge may potentially influence their in vivo bio-fate and drug release kinetic (Fatouros & Antimisiaris, Citation2002). As shown in , the intensity-based size distribution of the prepared PELs is 186 nm. Accordingly, the size of the PA-loaded nano-carrier is ideal in terms of the objective of the study, both assuring a good drug payload and an appropriate residence time in the site of injection. Furthermore, all the number, intensity and volume-based size distribution curves are very close to each other, thus showing that the size of vesicles follows a normal distribution with no over- or under-sized entities within the samples. The zeta potential distribution of the PELs is presented in . The measurement shows a near-normal distribution with highly narrow data dispersion and a negative mean value of −20 mV, as expected from the phospholipid used in the liposome preparation (phosphatidylcholine). Being in the range of between +30 mV and −30 mV may probably assure an acceptable avoidance of the nanoparticles from reticuloendothelial system (RES) (Needham & Ponce, Citation2002) provided that the other determinants such as size and hydrophilicity play the same game.
Figure 1. Particle size distribution of the PELs.
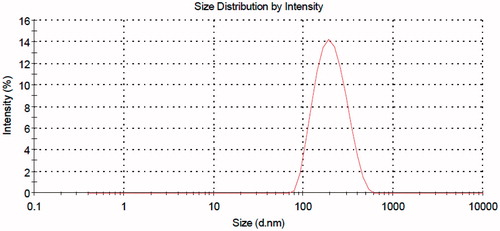
Figure 2. Zeta potential distribution of the PELs.
FT-IR
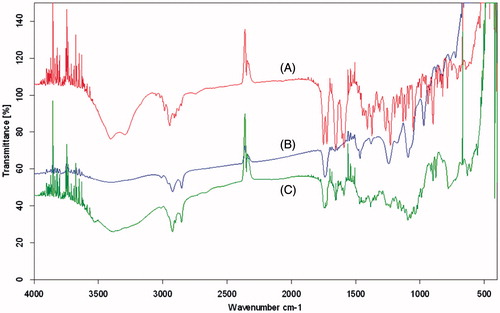
It is well known that FT-IR spectroscopy can provide some information about the possible interaction(s) between the different functional groups. The FT-IR spectrum of phosphatidylcholine showed the prominent absorption bands at 2923 cm−1 (for C–H stretching vibration of methylene group), 1742 cm−1 (for C=O stretching vibration), and 1467 cm−1 (for C–H stretching vibration of methyl group). Also, the adsorption bonds in 1243 cm−1 and 1092 cm−1 were attributed to P=O stretching vibration and P–O–C stretching vibration, respectively (Wang et al., Citation2006). Regarding the FT-IR spectrum of PA, characteristic bands of the OH groups can be observed at 3200–3500 cm−1. Two carbonyl stretching peaks appear as very strong bands at 1724 cm−1 and 1654 cm−1 () (Zakeri-Milani et al., Citation2011). The comparison of the FT-IR spectra of PEL, PA and phosphatidylcholine indicated no detectable chemical interaction between drug and the carrier (). It means that our carrier encapsulated the drug via reversible non-covalent binding, thereby avoiding any harmful effect on the biological activity of the drug. On the other hand, the drug release seems to occur via these reversible relatively weak interactions according to the environmental factors, which is much more reliable and flexible than the covalent interactions.
Figure 3. FT-IR spectrum of (A) PA, (B) phosphatidylcholine and (C) PEL.
Differential scanning calorimetry
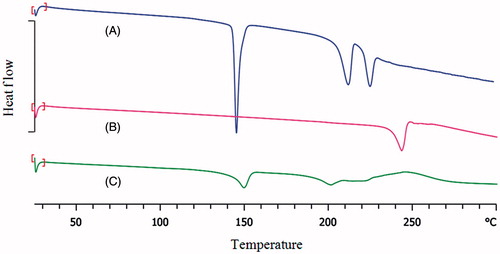
Differential scanning calorimetry DSC was used to study physical state of PA encapsulated in the PEL. The DSC thermograms of PA, lactose and PEL are shown in . As shown, crystalline PA exhibited clear endothermic peak at 244 °C, in agreement with the melting point of the crystalline drug (Malaekeh‐Nikouei et al., Citation2012). DSC thermal profile of lactose monohydrate showed three endothermic peaks. The first endotherm is the dehydration of the monohydrate (145 °C), which is followed by the endotherm for the melting of the anhydrous form (209 °C) (Ticehurst et al., Citation1996). The endothermic peak appeared at 221 °C can be attributed a phase transition (Karn et al., Citation2014). However, no melting peak of PA observed in the DSC thermogram of the PEL, can be attributed to non-crystalline state of the drug. The non-crystallinity might be attributed to the presence of hydrogen bonding between functional groups of the liposome and the drug.
Figure 4. DSC thermogram of (A) lactose, (B) PA and (C) PEL.
TEM
TEM image of the PA-loaded liposomal nano-carriers are shown in . As seen, the PELs are near-spherical, as expected, with the sizes confirmed by the DLS technique.
Figure 5. TEM micrographs of the PELs.
Drug loading
The drug loading parameters of the PEL are shown in . As indicated, the drug was loaded acceptably in the nano-carrier, which ensured the administration of the sufficient doses using a minimal amount of the carrier. Considering the steroidal structure of prednisolone, it can be well concluded that the drug uses both the possible loading positions of the liposomes, i.e. bi-layer lipid walls and the phospholipid–water interfaces for encapsulation.
Table 1. Drug loading parameters of the PEL.
Drug release
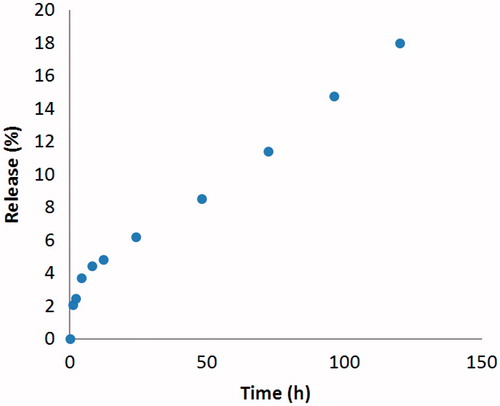
The release profile of PA from the nano-liposomes to PBS within a time period of 120 h has been shown in . As it is shown by these data, the drug release profile shows a remarkable near-zero-order kinetic with a very low initial burst. The maximum of drug release that occurred in the final test time was about 18%. This finding was, to some extent, desirable in terms of the objective of this study which was to obtain an extravascular slow release system as drug depot. In fact, this system ensures the lack of fast drug escaping from the system. Therefore, the drug release will mainly depend on the carrier disintegration in the biological system. The control sample showed complete drug exit from the dialysis sac early at 15 min upon dialysis, with almost whole calculated drug concentration remaining intact till the end of sampling which, in turn, ensure no significant impact of the release test condition on the release data.
Figure 6. Release profile of PA from PEL in PBS.
Stability of the PEL
Pharmaceutical formulations face several stability challenges during preparation, storage or even after administration, before the included drug can be delivered to the targeted site of action. One of the most important features of liposomes is their chemical stability (Zuidam et al., Citation2003, Gaafar et al., Citation2014). Two main indicators of physical stability of the nanostructures are the particle size and surface charge. According to the results obtained from particle stability studies, the PEL size and surface charge remained unchanged for 48 h in both 4 °C and 25 °C (). Also, upon freeze-drying, the mean value of zeta potential and size distribution showed no statistically significant change. Therefore, the early times of storage of the prepared PEL did not seem to cause a significant concern on the physical structure of the PA-loaded nano-carriers and, also, there was no apparent harmful effect of the freeze-drying on the size distribution of the liposomes.
Table 2. Mean diameter and zeta potential of the PEL in different times and temperatures.
Pharmacokinetic studies
shows the plasma concentration versus time profiles of prednisolone and the PEL. The pharmacokinetic parameters are listed in . The Cmax value of the PEL was much lower than that of prednisolone. In contrast, the Tmax and AUC0–72 values of the PEL were nearly 2- and 2.5-fold longer than that of the free drug, respectively ( and ). As shown in , the drug concentration in rat plasma receiving PA was non-detectable only after 12 h from the IM injection, whereas the animals receiving PEL had still detectable drug in their plasma till 72 h. These findings, mainly avoiding the high drug concentrations in early times and having drug in blood circulation for more extended times were very promising in terms of obtaining an efficient long-acting delivery system for the drug.
Figure 7. Plasma concentration – time profiles of prednisolone in male Wistar rats following IM administration of 16 μg/kg of the PA and PEL (N = 6).
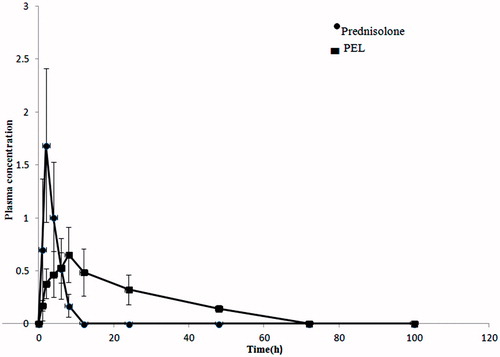
Table 3. Pharmacokinetic parameters of prednisolone in male Wistar rats following IM administration of 16 μg/kg of the PA and PEL (N = 6).
Pharmacodynamic studies
Acute inflammation in paws
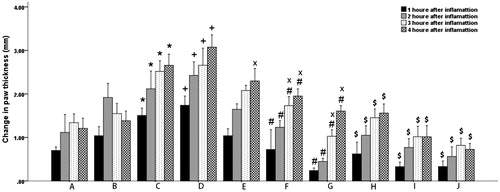
A comparison between the inflammations occurring in different groups of rats at different times following the drug administration is presented in . From these data, it is obvious that first, the inflammation has occurred in all test groups, second both the PA and PEL are efficacious in controlling the paw thickness changes as indicators of inflammation, third and most importantly, the PEL is remarkably more effective in controlling the inflammation in the long term.
Figure 8. Time-dependent paw thickness changes (1–4 h) of different animal groups following the induction of inflammation.
(*p < 0.05 compared with the A, +p < 0.05 compared with the B, #p < 0.05 compared with C, sp < 0.05 compared with D, ×p < 0.05 compared with PA).
IL-6 levels
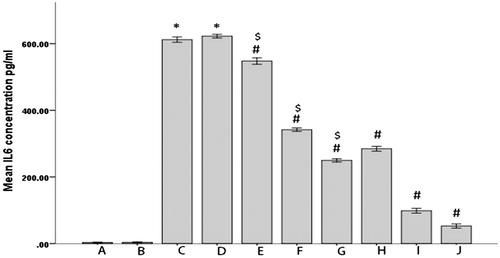
To study the effects of PEL and PA on the inflammation, we determined IL-6 levels in different groups of rats in two time points of 0 and 12 h ( and ). As indicated, first the IL-6 levels show no significant differences between groups before inflammation induction (). Second, the occurrence of inflammation is strongly confirmed by the huge elevations in IL-6 levels in all groups but no inflammation controls (). Third, both the drug forms were clearly efficient in lowering the interleukin level (). Fourth and most noteworthy, the PEL was remarkably more efficient in lowering IL-6 levels (). Fifth and in agreement to the data obtained by the rats’ paw test, the dose increment from 2.5 mg/kg to 10 mg/kg caused significantly more reduction in IL-6 levels ().
Figure 9. Serum IL6 levels in different groups of rats just before the induction of inflammation.
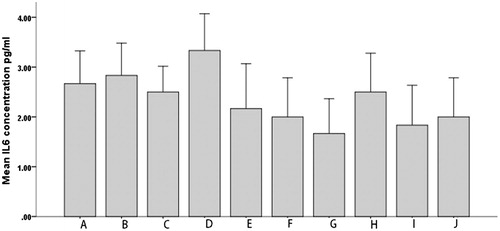
Figure 10. Serum IL6 levels in different groups of rats 12 h after the induction of inflammation.
(*p < 0.05 compared with A and B, #p < 0.05 compared with C and D, sp < 0.05 compared with PA).
Conclusion
The nano-liposomal form of anti-inflammatory drug PA was prepared using the straightforward and cost-effective classic ethanol injection method. The drug loading parameters in the PEL were remarkable (EE percent being >90%). The drug release in PBS occurred slowly and smoothly with about 18% of the drug released in 120 h. The FTIR and DSC tests showed no chemical interactions between the drug and the carrier. Upon the IM administration, the pharmacokinetic evaluation of the PEL compared with the free drug showed remarkable advantage for the nanoformulation with no initial burst of plasma concentration, but a more prolonged (about 2.5-fold) drug residence in blood circulation. Finally, the PEL nanoformulation showed higher and more prolonged anti-inflammatory effect, both macroscopically and biochemically, in inflamed rats.
Acknowledgements
The authors would like to thank Behdashtkar Pharmaceutical Laboratories (Rasht, Iran) for their kind donation of PA.
Declaration of interest
The authors report no conflicts of interest. The authors alone are responsible for the content and writing of this article.
References
- Allen TM, Cullis PR. (2013). Liposomal drug delivery systems: from concept to clinical applications. Adv Drug Deliver Rev 65:36–48
- Banciu M, Metselaar JM, Schiffelers RM, Storm G. (2008). Antitumor activity of liposomal prednisolone phosphate depends on the presence of functional tumor-associated macrophages in tumor tissue. Neoplasia 10:108–17
- Banciu M, Schiffelers RM, Fens MH, et al. (2006). Anti-angiogenic effects of liposomal prednisolone phosphate on B16 melanoma in mice. J Control Release 113:1–8
- Czock D, Keller F, Rasche FM, Häussler U. (2005). Pharmacokinetics and pharmacodynamics of systemically administered glucocorticoids. Clin Pharmacokinet 44:61–98
- De Bosscher K, Haegeman G. (2009). Minireview: latest perspectives on antiinflammatory actions of glucocorticoids. Mol Endocrinol 23:281–91
- Dési E, Kovács Á, Palotai Z, Kende A. (2008). Analysis of dexamethasone and prednisolone residues in bovine milk using matrix solid phase dispersion-liquid chromatography with ultraviolet detection. Microchem J 89:77–81
- Fatouros DG, Antimisiaris SG. (2002). Effect of amphiphilic drugs on the stability and zeta-potential of their liposome formulations: a study with prednisolone, diazepam, and griseofulvin. J Colloid Interf Sci 251:271–7
- Gaafar PM, Abdallah OY, Farid RM, Abdelkader H. (2014). Preparation, characterization and evaluation of novel elastic nano-sized niosomes (ethoniosomes) for ocular delivery of prednisolone. J Liposome Res 24:204–15
- Hofkens W, Schelbergen R, Storm G, et al. (2013). Liposomal targeting of prednisolone phosphate to synovial lining macrophages during experimental arthritis inhibits M1 activation but does not favor M2 differentiation PLoS One 8:e54016
- Hofkens W, Van Den Hoven JM, Pesman GJ, et al. (2011). Safety of glucocorticoids can be improved by lower yet still effective dosages of liposomal steroid formulations in murine antigen-induced arthritis: comparison of prednisolone with budesonide. Int J Pharm 416:493–8
- Karn PR, Jin SE, Lee BJ, et al. (2014). Preparation and evaluation of cyclosporin a-containing proliposomes: a comparison of the supercritical antisolvent process with the conventional film method. Int J Nanomedicine 9:5079
- Leroy C, Rigot JM, Leroy M, et al. (2015). Immunosuppressive drugs and fertility. Orphanet J Rare Disease 10:136
- Liao J, Hayashi K, Horikoshi S, et al. (2001). Effect of steroid-liposome on immunohistopathology of IgA nephropathy in ddY mice. Nephron 89:194–200
- Lobatto ME, Calcagno C, Otten MJ, et al. (2015). Pharmaceutical development and preclinical evaluation of a GMP-grade anti-inflammatory nanotherapy. Nanomedicine 11:1133–40
- Malaekeh‐Nikouei B, Ghaeni FA, Motamedshariaty VS, Mohajeri SA. (2012). Controlled release of prednisolone acetate from molecularly imprinted hydrogel contact lenses. J Appl Polym Sci 126:387–94
- Mcdonough AK, Curtis JR, Saag KG. (2008). The epidemiology of glucocorticoid-associated adverse events. Curr Opin Rheumatol 20:131–7
- Metselaar J, Van Den Berg W, Holthuysen A, et al. (2004). Liposomal targeting of glucocorticoids to synovial lining cells strongly increases therapeutic benefit in collagen type II arthritis. Ann Rheum Dis 63:348–535
- Metselaar JM, Wauben MH, Wagenaar, et al. (2003). Complete remission of experimental arthritis by joint targeting of glucocorticoids with long-circulating liposomes. . Arthritis Rheum 48:2059–66
- Meure LA, Foster NR, Dehghani F. (2008). Conventional and dense gas techniques for the production of liposomes: a review. AAPS PharmSciTech 9:798–809
- Mishina EV, Binder J, Kupiec-Weglinski JW, Jusko WJ. (1994). Effect of liposomal methylprednisolone on heart allograft survival and immune function in rats. J Pharmacol Exp Ther 271:868–74
- Needham D, Ponce A. (2002). Nanoscale drug delivery vehicles for solid tumors, nanotechnology for cancer therapy. CRC Press, Taylor & Francis, 677–719
- Ozbakir B, Crielaard BJ, Metselaar JM, et al. (2014). Liposomal corticosteroids for the treatment of inflammatory disorders and cancer. J Control Release 190:624–36
- Paliwal SR, Paliwal R, Vyas SP. (2015). A review of mechanistic insight and application of pH-sensitive liposomes in drug delivery. Drug Deliv 22:231–42
- Saag KG. (2002). Glucocorticoid use in rheumatoid arthritis. Curr Rheumatol Rep 4:218–25
- Samad A, Sultana Y, Aqil M. (2007). Liposomal drug delivery systems: an update review. Curr Drug Deliv 4:297–305
- Schiffelers RM, Banciu M, Metselaar JM, Storm G. (2006). Therapeutic application of long-circulating liposomal glucocorticoids in auto-immune diseases and cancer. J Liposome Res 16:185–94
- Schiffelers RM, Metselaar JM, Fens MH, et al. (2005). Liposome-encapsulated prednisolone phosphate inhibits growth of established tumors in mice. Neoplasia 7:118–27
- Schmidt J, Metselaar JM, Wauben MH, et al. (2003). Drug targeting by long‐circulating liposomal glucocorticosteroids increases therapeutic efficacy in a model of multiple sclerosis. Brain 126:1895–904
- Ticehurst M, York P, Rowe R, Dwivedi S. (1996). Characterisation of the surface properties of α-lactose monohydrate with inverse gas chromatography, used to detect batch variation. Int J Pharm 141:93–9
- Van Den Hoven JM, Hofkens W, Wauben MH, et al. (2011). Optimizing the therapeutic index of liposomal glucocorticoids in experimental arthritis. Int J Pharm 416:471–7
- Van Der Geest T, Metselaar JM, Gerrits D, et al. (2015). FDG PET/CT imaging to monitor the therapeutic effect of liposome-encapsulated prednisolone in experimental rheumatoid arthritis. J Control Release 209:20–6
- Van Der Valk FM, Van Wijk DF, Lobatto ME, et al. (2015). Prednisolone-containing liposomes accumulate in human atherosclerotic macrophages upon intravenous administration. Nanomedicine 11:1039–46
- Wang F, Yang Z, Zhou Y, et al. (2006). Influence of metal ions on phosphatidylcholine–bovine serum albumin model membrane, an FTIR study. J Mol Struct 794:1–11
- Waynforth HB, Flecknell PA. (1980). Experimental and surgical technique in the rat. London: Academic press
- Zakeri-Milani P, Nezhadi SH, Barzegar-Jalali M, et al. (2011). Studies on dissolution enhancement of prednisolone, a poorly water-soluble drug by solid dispersion technique. Adv Pharm Bull 1:48
- Zuidam N, Van Winden E, De Vrueh R, Crommelin D. (2003). Stability, stage, and sterilization of liposomes. In: Liposomes. Oxford: Oxford University Press, 149–65