Abstract
Objective: This study analyzed the influence of the acquisition method in image-free computer-assisted total knee arthroplasty (CAS-TKA), and the reproducibility of implant planning using BoneMorphing®, a 3D morphometric model obtained by a 3D-to-3D elastic registration of statistical models to sparse point clouds acquired directly on the bone surface with a pointer.
Materials and Methods: Five surgeons (one expert, four trainees) each performed a CAS-TKA hybrid protocol based on morphometric models and landmarks on a cadaveric knee 10 times. In addition, several additional landmarks were digitized during each acquisition. The reproducibility of the implant positioning and sizing, as determined by an implant planning algorithm with morphometric models, was compared to direct digitization accuracy.
Results: Femoral and tibial implant positioning parameters with the hybrid protocol resulted in intra-surgeon standard deviations (SDs) of less than ± 1.4° for rotation and 1.9 mm for translation for all surgeons in all directions except for tibial axial rotation (the only parameter determined by a digitized landmark and not recomputed in the 3D model). The variability in individual landmark digitization varied from 2 to 5 mm SD for certain landmarks, with ranges of 15–25 mm across all surgeons. The comparison study showed an improvement in femoral rotation reproducibility with the morphometric model when using the posterior condylar axis. Tibial implant reproducibility for each method was comparable, with the morphometric model giving better results in well-digitized areas such as the tibial plateau.
Conclusion: A CAS-TKA protocol based on a deformed statistical model offers reproducible implant positioning. Some landmarks, such as distal condyles, show sufficient reproducibility in the direction of interest, while others, such as the anterior tibial tubercle, can lead to hazardous implant positioning. This should be taken into consideration when designing a CAS-TKA system with bony landmarks. In areas where a sufficient number of points have been digitized with good coverage, such as on the distal and posterior femoral condyles or the tibial plateau areas, the information derived from the 3D model is more accurate and reproducible than that derived from digitization. Good training and a guiding user interface are essential to guarantee coverage quality.
Introduction
Image-free navigation systems are currently the most popular and widely used computer-assisted surgical (CAS) systems for total knee arthroplasty (TKA) Citation[1]. These systems rely solely on intra- operative measurements to plan the placement of the femoral and tibial components for restoring proper knee alignment and soft tissue balance Citation[2].
The pose of the implant on the bone can be described by three translations and three rotations: the distal proximal (DP), medio–lateral (ML), and antero-posterior (AP) translations, and the axial rotation (AR), flexum–recurvatum (FR), and varus–valgus (VV). Each of these six pose parameters has to meet one or more criteria such as tangency of the implant to the anterior cortex or 0° of varus–valgus. The set of criteria can differ depending on the implant () or the surgeon, who can also adapt them intra-operatively to account for ligament balancing or patellar tracking Citation[3]. For instance, some implants recommend 3° of femoral AR with respect to the posterior condylar axis, whereas others are aligned with Whiteside's line. Femoral rotation can also be computed intra-operatively for ligament balancing purposes, e.g., to equalize flexion and extension gaps.
Table I. Non-exhaustive list of the different criteria that could be required for the six femoral implant positioning parameters.
CAS-TKA systems often use what could be called fitting functions to decide whether an implant pose meets the different criteria. These fitting functions require axis and surface information specific to the patient's anatomy. For instance, to give 3° of external femoral rotation, the system requires inputs of the femoral mechanical axis as well as a medio-lateral direction defining 0° of rotation. If the femoral implant is to be placed tangent to the anterior cortex, surface information on the anterior cortex is required. Image-free navigation systems normally obtain this anatomical information from either kinematic acquisitions, direct digitization of bony landmarks using a pointer (i.e., point-based systems), or morphometric 3D bone surface models (BoneMorphing®, Praxim medivision, La Tronche, France). The latter use 3D-to-3D elastic registration of statistical models to sparse point clouds acquired directly on the bone surface with a pointer Citation[4].
Morphometric models offer an excellent 3D visualization, which is important in making a CAS system intuitive and easy to use, but may also present a potentially more robust and precise alternative to direct digitization of landmarks, as the relevant information can be obtained from the 3D patient-specific model. Geometrical features of certain landmarks allow them to be directly extracted from the 3D morphed surface model. The posterior condylar axis, for example, can be re-calculated from the most posterior points. Other information such as tangency and sizing can also be derived from the 3D models. This method should be more reproducible as it does not require the surgeon to have precise knowledge of the landmarks' locations. The ability to directly digitize landmarks is also linked to user 3D perception, as he has to look mentally for the most extreme points in the anatomical directions. However, the more robust and precise computation of automated landmarks versus manual landmarks has not been demonstrated so far.
The objectives of this study were three-fold. The first objective was to assess the reproducibility of implant planning using 3D morphometric models as a function of the human factor during acquisition. In particular, we posed the following research questions: (1) For a unique set of femoral and tibial implant positioning criteria, if a surgeon performs several acquisitions, to what degree will the planning proposed by the system differ? (2) Does the planning differ from one user to another? As the same set of criteria is used for each acquisition, the resulting variability is directly linked to variability in the acquisition of the bony landmarks or sparse point clouds.
The second objective was to assess the inter- and intra-surgeon variability in acquiring commonly used bony landmark points with a digitizing probe.
The final objective was to compare the reproducibility of the implant planning information acquired by direct digitization with a probe with that extracted from the deformed 3D model. In addition, we compared the reproducibility of determining the trans-epicondylar axis using a new method that finds the most prominent points on the medial and lateral epicondyles of the 3D model.
Materials and methods
The experiments were carried out on a Surgetics® system (Praxim medivision, La Tronche France, www.surgetics.com), using a research software application modified specifically for this study. The software was adapted from a dedicated TKA application using the morphometric model approach.
Preliminary studies were first carried out on a synthetic knee joint (Sawbones) with three people performing a total of 30 trials Citation[5]. The results presented here were obtained in a cadaver experiment in which five surgeons (designated Surgeons A, B, C, D and E) each performed two sets of five consecutive acquisitions. One surgeon was a senior expert surgeon with extensive experience in CAS systems, whereas the others were orthopedic residents who were barely familiar with navigation.
Femoral (F) and tibial (T) rigid bodies, each equipped with three passive markers, were fixed on the bones using two threaded pins per rigid body, and care was taken to ensure that the rigid bodies did not move between trials. The surgeon's behavior was observed for each trial. Tests in which there were obvious failures to respect the acquisition protocol were noted and removed from the dataset before analyzing the results, leaving a total of 35 acquisitions which are presented here.
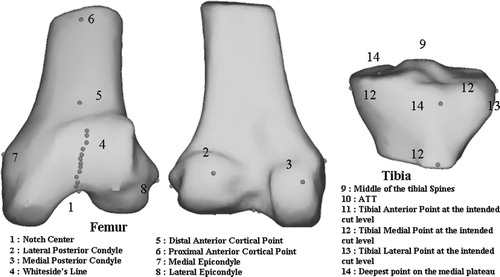
All data are presented in a unique and anatomical reference frame for each bone segment to facilitate both intra- and inter-surgeon comparison of the results. Prior to the experiment, one expert surgeon defined these two anatomical reference frames for the femur and tibia (RefAnatFExpert and RefAnatTExpert, respectively), and the data collected in the 35 trials were transformed into this coordinate system before being saved for reproducibility analysis. These expert anatomical frames were computed using the same method used for the future experiments. They comprised the hip center, the posterior condyles, and the top of the notch for the femur; and the ankle center, the middle of the tibial spines, and the anterior tibial tubercle (ATT) for the tibia. The most experienced CAS surgeon was chosen to perform this preliminary step and was asked to be particularly careful during the digitization.
Implant sizing and positioning reproducibility with a TKA protocol using 3D morphometric models plus landmarks
The first part of this study concerned the reproducibility of the femoral and tibial implant planning proposed by the implant positioning algorithm, using a TKA protocol based on morphometric models combined with anatomical landmarks. In the commercial version of the TKA applications, the surgeon has the option to customize the proposed planning parameter by parameter. To take into account only the influence of the acquisition of anatomical information on the reproducibility of implant planning, a set of default criteria was defined for all 35 trials and the system automatically computed the planning from this anatomical input. This implant planning (position and orientation) was given in the current anatomical reference frame acquired by the surgeon for the current trial, RefAnatF or RefAnatT, and then transferred into RefAnatFExpert and RefAnatTExpert. The suggested implant sizing was also recorded.
In the system used for the study, the implant sizing and pose are optimized simultaneously. The system chooses the combination that best meets the different criteria according to the anatomical information input.
Therefore, it would be nonsense, for example, to compare the variability of the AP translation in groups with different sizes of femoral implant, as the criterion to be met is anterior tangency. The coordinate system of the implant being located at the center of gravity of the implant and not on its anterior plane, the AP pose will differ depending on the size. Consequently, only trials with the size most frequently selected by the system are analyzed in the results.
Variability of the most commonly used TKA landmarks digitized with a pointer
The most commonly used landmarks in CAS-TKA were acquired for the study and are presented in . As most of these landmarks were not normally required in the current per-operative TKA application, additional steps in the protocol were implemented for their digitization.
Figure 1. Location on a distal femur and proximal tibia statistical 3D model of the most commonly used landmarks in TKA.
To provide visual feedback on the bony landmarks' variability and location on the femur and tibia, a dedicated 3D visualization application was implemented for results analysis. With this tool, the different landmarks acquired by all users (35 for each landmark) could be displayed on a 3D model of the bone and viewed from any direction. In the absence of a CT scan, the tibia and femur 3D models used in this tool were obtained by the deformation of a sparse point cloud gathering all points acquired by all users (∼1000*35 points for each bone). Note that this 3D model does not at all influence the collection of landmarks and serves for experiment rendering only.
Comparison of acquisition method: 3D morphometric models versus landmarks
We compared the reproducibility of several anatomical points and axes automatically extracted from the morphometric model to the equivalent landmarks directly digitized with the pointer.
Femoral AR
The femoral posterior condylar axis, the trans-epicondylar axis, and Whiteside's line are commonly used as a reference for femoral AR. The posterior condylar axis and Whiteside's line are recomputed directly by the Praxim medivision system, using both local and global surface information extracted from the 3D model. In addition, the authors also tested a new algorithm (not yet commercially available) for extracting the trans-epicondylar axis from the model. This algorithm searches for the most prominent points on the epicondyles in the medial and lateral directions, as determined by the digitized posterior condylar axis.
Tibial sizing
The sizing of the tibial implant can be based on the tibia ML size at the resection plane level. Using only landmarks, no contour information is available. In ref. 6, the sizing is given by two points digitized at the intended cut level on the medial and lateral extremity of the tibia. Additional steps for their digitization were therefore implemented. Using the 3D model, the sizing was computed using the medio-lateral size of the bone contour at the cutting plane. This plane was determined before all experiments in the expert reference frame and was then re-introduced into the trials.
Tibial anterior tangency
The AP position of the tibial implant can be imposed by a tangency of the implant to the anterior cortex. The anterior cortex position at the cut level can be determined from the most anterior point at the cut level. This point can be directly digitized at the intended cut level Citation[6] or computed at the planned cut level using the 3D model.
Tibial cut depth
Tibial cut depth is commonly determined by an offset (e.g., 6 mm) from the deepest point on the worn side of the tibia plateau. This point can be acquired using the two methods. For pertinence of the analysis, the reproducibility of this deepest point is measured only in the proximal–distal (X) direction.
Data analysis
The variability computation method depends on the dimension of the anatomical information being compared.
The information analyzed in the three above-mentioned parts of the study includes scalar values (six pose parameters, tibial ML size, cut level, etc.), 3D points (ATT, top of the notch, middle of the tibial spine), and axes (posterior condyle axis, epicondylar axis, etc.).
Scalar values
The variability is given by the SD of the data set and the range (R) is given by the maximum value minus the minimum value. Results can also be presented on notch graphs in which the median, 10th, 25th, 75th, and 90th percentiles are plotted as vertical boxes with error bars. The upper and lower dots indicate data points that are outside the 90th percentile
Points
The size of the bounding cube enclosing the data set points (called range, R) and the mean distance to the mean point (called standard deviation, SD) were computed to represent variability. Some landmarks, such as the top of the notch, can have influence in the three directions if chosen for implant centering, but others, such as the ATT that defines the sagittal plane, have only one critical direction (medio-lateral, ML). For the latter, the ranges and SDs were computed only for their corresponding critical directions (ML, AP, or DP), as described in the scalar value section.
Vector
The SD is defined bywhere Vi is the normalized direction resulting from the ith acquisition and
is the normalized direction resulting from the sum Vi.
Results
Implant sizing and positioning reproducibility with a TKA protocol using 3D morphometric mode plus landmarks
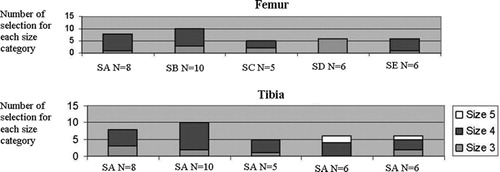
Two different implant sizes (3, n = 7, and 4, n = 28) for the femur and three (3, n = 9; 4, n = 23; and 5, n = 3) for the tibia were proposed by the system depending on the user or trial number (). This variability in sizing for the femur could be due to the bone being between two implant sizes or to a lack of surface points being acquired in some areas. The variability in tibial sizing is likely due primarily to the large variability in digitizing the ATT landmark, which determines the AP and hence the ML direction on the tibia. The variability in digitizing the ATT resulted in variability in the definition of the ML axis of ± 9.1° SD (range, R = [−15.8; 31.8°], total R = 47.8°) across all users and implant sizes. As the tibial size is determined by the maximum width of the tibial cutting plane in the ML direction, a large variability in the definition of the ML axis would result in different implant sizes as the bone contour is more or less elliptical in shape at the cut plane level. In addition, it was noted that not all surgeons acquired points on the medial and lateral surface of the tibia at the level of the cut plane, as this area was not easily accessible because of the soft tissues surrounding the joint. The deformation of the statistical model in those areas is therefore not reliable, which would also influence tibial sizing.
Figure 2. Number of trials in which the TKA implant positioning program system proposed the size in each size category (1, 2, 3, 4, or 5 for the femur (top) and 1, 2, 3, 4, 5, or 6 for the tibia (bottom)) per surgeon (SA: surgeon A; SB: surgeon B, etc.).
and report the mean and SD of each pose parameter for each user for the femoral and tibial planning, respectively, for the size 4 implant groups. Intra-surgeon variability for femoral component positioning was less than ± 1.5° or mm SD for all users and directions except one (Surgeon D, femoral AR RX, SD = ±2.2°). Variability for the group of surgeons ranged from 0.3 to 1.6° or mm SD for each direction. Intra-surgeon variability for tibial component positioning was less than ± 2.0° or mm SD for all surgeons in every direction expect for tibial AR. The latter, which was determined by direct digitization of the ATT landmark and was not recomputed in the 3D model, as mentioned above, showed significantly poorer reproducibility (SD of the union dataset = 9.1°) than the other tibial positioning parameters (SD of the union dataset was less than 1.3 mm for translation and 0.5° for rotation).
Table II. Mean and standard deviation for each of the five surgeons for the six datasets corresponding to the six degrees of freedom of the femoral implant positioning.
Table III. Mean and standard deviation for each of the five surgeons for the six datasets corresponding to the six degrees of freedom of the tibial implant positioning.
Variability of the most commonly used TKA landmarks digitized with a pointer
The relative positions of all digitized landmarks on the femur and tibia are displayed in . The relatively large variability of the ATT landmark, which is directly responsible for the tibial rotation variability, is evident. The range and SD, as defined previously, are presented for each surgeon for selected bony landmarks in (results pertaining to the other landmarks are presented in the following section). The top of the femoral notch and the middle of the tibial spines (landmarks commonly used to determine the femoral mechanical axis in landmark-based systems) had a variability of ± 2.2 mm SD each, with ranges of 15.5 and 13.43 mm, respectively, for the entire group. The group variabilities in digitizing the medial posterior condyle and medial epicondyle were 3.3 and 5.0 mm SD, with ranges of 14.47 and 23.62 mm, respectively, with very similar results obtained on the lateral side.
Figure 3. 3D visualization of the large variability for different landmarks acquired manually. For visualization only, these manual landmarks have been displayed on the BoneMorphing 3D models (color version available at online).
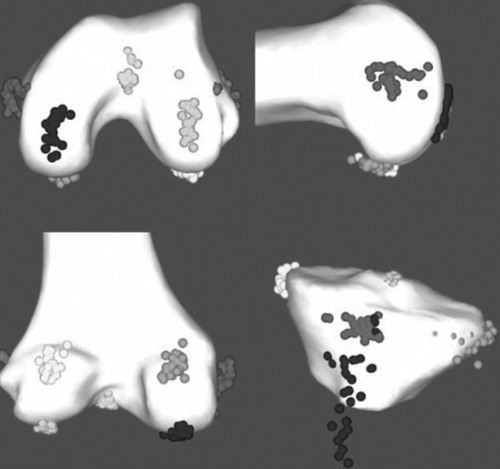
Table IV. Range of values and standard deviation in mm as described in the methods for landmarks digitized with the pointer for each operator.
Comparison of acquisition method: 3D morphometric models versus landmarks
presents the SD of the axes resulting from the posterior condylar axis, Whiteside's line, and the epicondylar axis for both methods: direct digitization with the pointer (P) and point extraction from a 3D model (BM). There was no significant difference between the variability in Whiteside's line and the epicondylar axis with either method. The axis resulting from the posterior condyles was more reproducible for all surgeons when computed from the morphometric model.
Table V. Standard deviation (°) of the femoral ML direction serving as reference for the femoral AR for each acquisition method and anatomical direction definition.
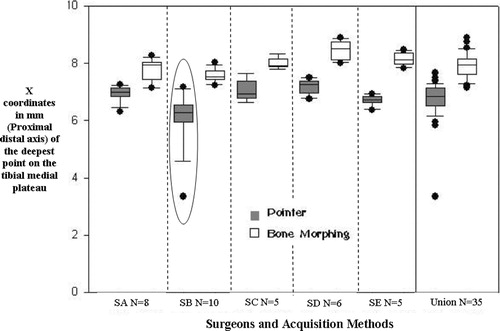
The variability in determining the tibial cutting depth using the pointer and the 3D model was sub-millimetric for both methods (), though the error range was much larger with digitization (5 versus 2 mm) due to an outlier. The mean depth value found by searching for the lowest point on the morphed tibial plateau was also significantly lower in the plateau than that found with the pointer. Using the pointer to determine the tibial proximal cut tends to underestimate the level of cut, as any error in digitization of the landmark will result in a point that is more proximal due to the shape of the glenoid. It was observed that surgeons often digitized points in the anterior part of the plateau, which was more accessible. When the cloud of points sufficiently covers the bone region of interest, as was the case for the tibial plateau, the extraction of the landmark from the 3D model is more accurate.
Figure 4. X coordinates (proximal to distal axis, in mm) of the tibial medial plateau for each surgeon and acquisition method (pointer or BoneMorphing). The last column of the graph is the dataset combining all 35 trials (SA: surgeon A; SB: surgeon B, etc.).
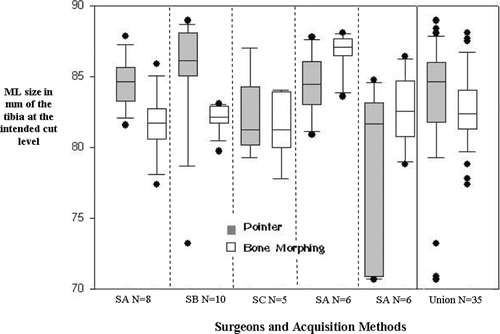
reports the comparison of the ML distance used to determine the tibial sizing, as described in the methods section. The SDs of the union of the 35 trials were also computed. The ML distance on the tibial cut showed an SD of 4.4 mm with the pointer and 2.7 mm in the 3D model for the group, with error ranges of 18.3 mm and 10.7 mm, respectively ().
Figure 5. ML size (in mm) of the tibia at the cut level for each surgeon and acquisition method (pointer or BoneMorphing). The last column of the graph is the dataset combining all 35 trials (SA: surgeon A; SB: surgeon B, etc.).
AP tangency on the tibia was 32.3 ± 3.3 26.9; 39.Citation[4] with the pointer and 33.4 ± 3.4 27.4; 40.Citation[6] with the 3D model for the group.
Discussion
The experiment showed that the studied navigation workflow using a 3D morphometric model and the indispensable landmarks led to a reproducible positioning of both implants. The less reproducible parameters in the planning were found in this protocol using only the pointer-digitized landmarks. Tibial AR, for example, showed significant variability, subsequently explained by the variability of the ATT defining the sagittal plane. So far, there is no solution to compute the ATT automatically from the model and perhaps the use of this point should be reconsidered. Surgeons have suggested digitizing a point on the tibial top crest, so some ideas are currently under investigation.
The second part of this experiment showed that some bony landmarks had an important variability when manually digitized with the pointer, and their influence on implant positioning should be seriously considered when designing a CAS system.
The third comparative study showed that the 3D model provided a significant improvement in determining the tibia ML sizing, as well as the posterior condylar axis. Both methods demonstrated good reproducibility for the height of the worn tibial plateau, although the comparison of the mean between the two methods showed that a deeper point was found in the model. This suggests that the surgeons did not really look for the lowest point, whereas it was found in the bone model. Better results and improvement were expected for Whiteside's line, and the algorithm extracting this line could probably be improved.
So far, the epicondylar axis is not reliable determined with either method. Similar studies Citation[7], Citation[8] highlighted this problem for the pointer method. In ref. 7, a single surgeon took repeated measurements of the epicondylar axis on 20 patients using manual landmarks, the maximum range of the acquisitions for each patient being in the range of 3–11.2°. The epicondylar axis was not reproducible in the 3D model method either, as its geometrical particularity is not obvious and therefore cannot be automatically computed by the method proposed in this article. Another explanation is that insufficient points were digitized in the medial and lateral areas of the femur.
Study limitations
A major limitation of the study is related to the problems inherent in reproducibility studies performed on cadavers, and this probably biased the comparison. The experiments were conducted over two days and the knee cartilage became softer as the tests continued. The pointer tip left visible markings and indentations on the bone surface when digitizing landmark points, and users tended to digitize the markings rather than look for the landmarks themselves. In addition, the experiment was long and repetitive and the attention of the user diminished over time. This also affected the quality of the clouds of points necessary for the statistical model deformation, as many users did not acquire points in the areas where landmarks were to be recomputed, such as near the epicondyles and the medial and lateral part of the tibia.
User behavior was observed while digitizing the bone surface and it seemed that imposing a minimum number of points was not sufficient, as users would simply acquire almost all the 1000 points only in those limited areas that were easily accessible, such as the distal part of the femur and the tibial plateau.
Depending on the information used for the positioning, the user interface should precisely indicate or even dictate the areas on the bone that must be digitized with high attention and density. This is especially crucial when referencing femoral AR. A view of the statistical model was displayed during point cloud acquisition to guide the evolution of the cloud. Several different points of view would probably help the digitization, particularly in the posterior condyles.
Morphometric models offer additional information and advantages not discussed in this reproducibility comparison study. The capacity to compute at any time the intersection of a plane with the 3D model enables performance of a global planning in which all parameters can be simultaneously optimized. This is a key point, as parameters are not independent: if the distal cut changes, the contour of this cut on the bone is also changed, which, depending on the implant, can result in ML positioning or sizing which itself affects the posterior gap, which affects the distal cut, and so on. A good TKA system allows the surgeon to modify the proposed default planning. With a 3D model specific for the patient's anatomy, the surgeon can always modify any pose parameter, and the others will then be automatically and optimally recomputed to best meet the criteria. Those advantages will be discussed and demonstrated in a future CT-based study.
Conclusion
A CAS-TKA system combining 3D morphometric models obtained by BoneMorphing® with indispensable and reliable landmarks offers reproducible positioning of the implant. Good extraction algorithms, maximum guidance in the acquisition, good training of the surgeons, and respect for the instructions should lead to more reproducible anatomical information when extracted from the morphometric models than when directly digitized with the pointer. Conversely, digitization of manual landmarks can lead to large variability. Last but not least, only the use of a global 3D model makes it possible to simultaneously optimize sizing and pose parameters in a rational and precise way that is adapted to the surgical or implant philosophy.
Acknowledgment
Nathalie Perrin is supported by a fellowship sponsored by the ANRT France (Convention CIFRE) and Praxim-medivision.
References
- Stindel E, Briard JL, Merloz P, Plaweski S, Dubrana F, Lefevre C, Troccaz J. Bone morphing: 3D morphological data for total knee arthroplasty. Comput Aided Surg 2002; 7(3)156–168
- Briard JL, Stindel E, Plaweski S, Dubrana F, Merloz P, Lefevre C, Troccaz J, Bertrand F, Begoc N, Solodky P, Breysse M. CT-free navigation with the LCS Surgetics Station: a new way of balancing the soft tissues in TKA based on bone morphing. Navigation and robotics in total joint and spine surgery, JB Stiehl, WH Konermann, RG Haaker. Springer, Berlin 2003; 274–281
- Whiteside LA, Saeki K, Mihalko WM. Functional medial ligament balancing in total knee arthroplasty. Clin Orthop Rel Res 2000; 380: 45–57
- Stindel E, Briard J-L, Lavallée S, Dubrana F, Plaweski S, Merloz P, Lefevre C, Troccaz J. Bone morphing: 3D reconstruction without pre- or intraoperative imaging: concept and applications. Navigation and robotics in total joint and spine surgery, JB Stiehl, WH Konerman, RG Haaker. Springer, Berlin 2003; 39–48
- Perrin N, Stindel E, Roux C. Bone morphing vs freehand localization of anatomical landmarks—consequences on the reproducibility of TKA. In:. Proceedings of the 5th Annual Meeting of the International Society for Computer Assisted Orthopaedic Surgery (CAOS-International), HelsinkiFinland, June, 2004, F Langlotz, BL Davies, D Schlenzka. 357–359
- Konermann WH, Kistner S. CT free navigation including ligament balancing: LCS-TKA and VectorVision systems. Navigation and robotics in total joint and spine surgery, JB Stiehl, WH Konermann, RG Haaker. Springer, Berlin 2003; 25–266
- De Steiger RN, Leung A. The inter-operative accuracy of the transepicondylar axis using computer assisted surgery. Proceedings of 4th Annual Meeting of the International Society for Computer Assisted Orthopaedic Surgery (CAOS-International), Chicago, IL, June, 2004
- Currie J, Varshney A, Stulberg SD, Adams A, Wood O. The reliability of anatomic landmarks for determining femoral implant rotation in TKA surgery: implications for CAOS TKA. Proceedings of the 4th Annual Meeting of the International Society for Computer Assisted Orthopaedic Surgery (CAOS-International), Chicago, IL, June, 2004