Abstract
There is currently great interest in analyzing the workflow of minimally invasive operations performed in a physical or simulation setting, with the aim of extracting important information that can be used for skills improvement, optimization of intraoperative processes, and comparison of different interventional strategies. The first step in achieving this goal is to segment the operation into its key interventional phases, which is currently approached by modeling a multivariate signal that describes the temporal usage of a predefined set of tools. Although this technique has shown promising results, it is challenged by the manual extraction of the tool usage sequence and the inability to simultaneously evaluate the surgeon's skills. In this paper we describe an alternative methodology for surgical phase segmentation and performance analysis based on Gaussian mixture multivariate autoregressive (GMMAR) models of the hand kinematics. Unlike previous work in this area, our technique employs signals from orientation sensors, attached to the endoscopic instruments of a virtual reality simulator, without considering which tools are employed at each time-step of the operation. First, based on pre-segmented hand motion signals, a training set of regression coefficients is created for each surgical phase using multivariate autoregressive (MAR) models. Then, a signal from a new operation is processed with GMMAR, wherein each phase is modeled by a Gaussian component of regression coefficients. These coefficients are compared to those of the training set. The operation is segmented according to the prior probabilities of the surgical phases estimated via GMMAR. The method also allows for the study of motor behavior and hand motion synchronization demonstrated in each phase, a quality that can be incorporated into modern laparoscopic simulators for skills assessment.
Introduction
Over the last decade, surgical workflow analysis (SWA) has received increased attention with a view to solving important challenges encountered in the operating room (OR), such as the management of the surgical process, the development of new guidance and instrumentation systems, and the study of surgical skills Citation[1], Citation[2]. Especially in the field of image guided surgery, the introduction of new technologies has yielded great benefits, not only in terms of patient safety, but also in the automation of existing procedures and the optimization of surgical interventions. As the complexity and number of procedures and specialized instruments increases, it is essential to formulate a mechanism by which key medical staff can be made aware of what is being performed in the OR and when. Thus, an SWA system should be capable of segmenting a surgical intervention into its main phases, providing information about the working steps of the surgical process. Based on this information, various modeling steps could follow for purposes such as surgical performance analysis, synchronization of related activities, and comparison of different interventional strategies Citation[3].
An established approach for segmenting surgical interventions employs multivariate vectors of signals that denote the usage of the instruments during the procedure and are manually read out from the laparoscopic video. The employment of these signals is justified by the fact that in minimally invasive surgery the laparoscopic instruments correlate strongly with the underlying workflow. Hence, two different surgical phases are unlikely to require the same set of tools. Currently, there are two main approaches based on this concept: Dynamic Time Warping (DTW) and Hidden Markov Models (HMMs). DTW originated in the field of speech recognition and aims at performing a non-linear synchronization between two time series with variable duration Citation[4]. Commonly, a number of pre-segmented signals are used to construct an “average surgery” (training set) that represents the sequential phases, with the corresponding timings, and this is used as a reference to segment a new operation. This approach has been applied successfully for the retrieval of 14 workflow phases of laparoscopic cholecystectomy (LC) using a set of 17 signals Citation[5]. A boosted segmentation has been proposed by Padoy et al. Citation[6], in which DTW is combined with advanced classifiers for surgery segmentation using an adaptive distance measure based on the discriminate power of each instrument. However, DTW-based methods are limited to offline use, as the entire surgery must be recorded beforehand.
HMMs constitute another prominent approach that also has its roots in speech recognition Citation[7]. In minimally invasive surgery HMMs have been used extensively for applications such as motion segmentation Citation[8], task recognition Citation[9], and skills assessment Citation[10]. HMMs are based on a training dataset that allows the computation of the model parameters. Bouarfa et al. Citation[11] have presented a Markov-based approach for inferring high-level tasks from a set of low-level signals of instrument usage extracted from video recordings of the tool tray view, with five surgical steps of laparoscopic cholecystectomy being segmented using a vector of 10 signals. Padoy et al. Citation[12] proposed a left-to-right HMM based on data containing visual cues computed from the endoscopic video, and this same group has proposed several variants of the HMM algorithm for analyzing the workflow of laparoscopic cholecystectomy, such as the use of a model merging approach to build the HMM topology Citation[13] and, more recently, a generalized framework that addresses data where the phases have been partially labeled Citation[3].
The idea of constructing statistical models for surgical activity modeling has also inspired the use of signals other than those denoting the temporal usage of a predefined set of instruments. For example, James et al. Citation[14] employed eye-gaze tracking for assessment and workflow recovery, with an emphasis on the detection of the clipping phase during LC. A neural network was used to perform the classification. Recently, an approach combining instrument usage and visual features extracted from the video stream has been proposed by Blum et al. Citation[15], while other techniques employ HMMs fused with multisensory tracking data (position, orientation, etc.) for evaluating the quality of surgical maneuvers Citation[16]. HMM-driven hand motion analysis has also been combined with virtual reality (VR) simulators for correlating technical errors with kinematic parameters Citation[10], Citation[17]. However, all these techniques focus mainly on the decomposition of surgical maneuvers into a set of high-level states, either for performance assessment or for recognition of short laparoscopic tasks such as knot-tying and clipping.
In an attempt to develop a method that provides a flexible means of performing phase segmentation and simultaneously analyzing surgical performance, we here describe a novel approach that is able to address these issues within a unified framework. We demonstrate that with the proposed methodology the analysis of surgical workflow is enhanced not only in terms of SWA but also in the extraction of the phase-specific hand motion couplings. The latter has not previously been addressed in the literature, and most of the aforementioned works focus on workflow recovery or OR state identification Citation[18], Citation[19]. The main contributions of the present paper can be summarized as follows:
In contrast to other approaches that commonly use multidimensional binary signals of the instrument usage, this study describes an approach based on hand kinematic signals obtained from orientation sensors attached to the handles of a VR simulator. This is a novel, yet challenging, idea for solving SWA, and to our knowledge there are no reports in the current literature that explore the pattern of surgical maneuvers for identifying the phases of a surgical intervention. In fact, most studies published so far employ binary signals, assuming that each phase is identified by a different pattern of usage of the tools employed during the intervention. This methodology is challenged by the manual extraction of the tool usage sequence and the inability to simultaneously evaluate the surgeon's skills. In contrast, our method is based on the hypothesis that each phase is characterized by a different pattern of surgical maneuvers, and it is also able to analyze surgical performance.
Our approach assumes that the maneuvers performed during each phase have a different statistical distribution, and these distributions can be modeled by a mixture of Gaussian autoregressive coefficients. This is a novel contribution to the field of SWA and differs substantially from our previous work Citation[20], in which a single multivariate autoregressive (MAR) model was employed for modeling hand kinematics of residents during the performance of basic surgical tasks for skills assessment purposes. The central issue here is the extraction of the GMMAR algorithm and its application to surgical phase segmentation. The MAR model is employed to infer the coefficients of each surgical phase, but this is only for the purpose of constructing the training set. The kinematic signals from a new surgery are processed entirely via GMMAR in order to compute the unknown coefficients (and prior probabilities) of each surgical phase at once. These coefficients are then compared to those of the training set.
In addition to phase segmentation, our work describes how to derive the hand motion synchronicity pattern during each surgical phase. This is also a novel contribution to SWA, as most of the current approaches focus on workflow recovery without further studying the surgeon's performance. Consequently, deriving the phase-specific hand motion pattern of a surgical trainee may have important educational potentialities (e.g., for performance assessment).
The paper is organized as follows. In the next section we describe the experimental data and the laparoscopic VR simulator. We begin by providing a brief introduction to the MAR models, and then extract the algorithm for computing the autoregressive coefficients from the kinematic signals of a new surgery. This is followed by a description of the proposed framework for surgical phase segmentation, after which we present the methodology behind the computation of the hand motion network for each phase segmented. The experimental results are presented in the subsequent section, followed by discussion.
Methods
Twenty-one right-handed subjects in the final year of their residency training participated in the study. The participants had some prior experience with basic skills training on a laparoscopic simulator, but not with the performance of entire operations in a virtual environment. Each participant performed a laparoscopic cholecystectomy scenario of medium difficulty on a commercial VR simulator (LapVR™, CAE, Montreal, Quebec, Canada). The duration of each operation ranged from 7 to 26 minutes. LC was selected because of its education value in general surgery.
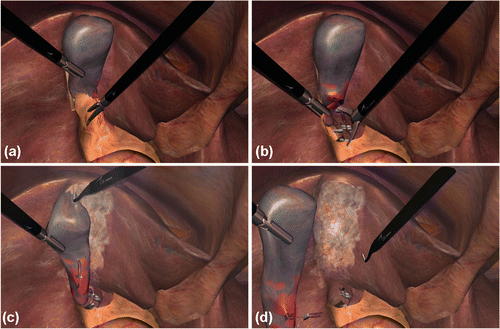
The SWA involved the segmentation of the LC procedure into 3 major phases (component task zones Citation[21]): (1) division of adhesions involving the gallbladder and adjacent organs/omentum (gallbladder dissection); (2) division of the cystic artery and duct (clipping and cutting); and (3) separation of the gallbladder from the liver bed followed by extraction (liver bed coagulation). These tasks had to be performed sequentially to complete the virtual scenario. As the simulator focuses mostly on the training and assessment of psychomotor laparoscopic skills, such as hand-eye coordination and depth perception, additional phases of the clinical protocol, such as trocar insertion/retraction, gallbladder packaging, etc. (see reference Citation[6]), were not considered in this study. Hence, pre- and postoperative tasks such as CO2 inflation and abdominal suturing were omitted, since the simulation scenario begins with the trocars inserted in the abdominal wall and finishes with the removal of the gallbladder. shows snapshots of the aforementioned phases, and depicts the completing step where the gallbladder is virtually extracted by pulling back the grasper. The validity of the LapVR™ simulator in laparoscopic skills training has been demonstrated in a prior publication Citation[22]. The average duration of the three interventional phases was 9, 3, and 8 minutes, respectively.
Figure 1. Snapshots taken during the performance of the LC operation on the LapVR simulator: (a) dissection of the gallbladder; (b) clipping/cutting of the cystic duct/artery; (c) liver bed coagulation; and (d) gallbladder removal.
To acquire kinematic data of the hand maneuvers we employed a pair of electromagnetic sensors (trakSTAR, Ascension Technology Corp., Milton, VT) attached to the handles of the laparoscopic instruments. Each sensor had 6 degrees of freedom and recorded the location and rotation of the instruments with regard to a fixed reference frame. Similarly to previous work on hand kinematics Citation[20], Citation[23], we considered the three rotational angles of each sensor (i.e., roll, pitch and yaw), based on the hypothesis that each surgical phase is characterized by a different pattern of angular movements. The sampling frequency during acquisition was set to 50 Hz, which is sufficient to describe this type of human gesture, as proposed elsewhere Citation[17]. The procedure performance was also videotaped synchronously with signal acquisition to assist interpretation of the results, and mainly to derive the objective timings of the three surgical phases.
MAR model
Prior to segmentation, the 3-variate signals were processed with MAR models to extract a training set of regression coefficients for each surgical phase (the general description of the framework is given in the Surgical phase segmentation sub-section below). Given a multivariate time series {yt} of length T, where a single observation is a d-dimensional row vector, the MAR process aims to model at each time step the target value yt as a weighted sum of the r previous values, so thatwhere ak is a d × d matrix of the regression coefficients (weights), and et is a 1 × d independent and identical distributed (IID) Gaussian noise vector with zero mean and precision Λ (the inverse covariance, d × d). The MAR process aims to estimate the total number of weights (n = rd2) and the precision matrix Λ. Provided that the noise is assumed to be Gaussian, one can express the uncertainty over the target value of yt in a conditional probability formulation given by
where
(m, Λ−1) denotes the Gaussian distribution with mean m and covariance Λ−1; xt is a single vector composed of the regressors
; and A is the matrix formed by stacking the weights such that
. If we concatenate the target observations into a single matrix Y, such that the ith row is given by yt, and similarly for the inputs xt, the log likelihood function of the observed data set O = {Y, X} is given by
where tr() denotes the trace and |Λ| is the determinant of the precision. If we then apply maximum likelihood (ML) estimation, the model parameters are estimated by the standard formulae Citation[24]:
This approach obviously requires knowledge of the optimum number of regressors, which is referred to as the model order. Selecting the order with the highest likelihood is not always a proper choice, since a higher-order model will fit the data better, but may well lead to overfitting. One way to avoid this is to incorporate prior probability densities for the model parameters, as suggested by Penny and Roberts Citation[24] and applied to hand kinematic signals in reference Citation[20]. Due to the large number of parameters required to estimate with this method, in this study we employed a simpler rule that was based on the maximum value of the Bayesian Information Criterion (BIC), which for the MAR process is given by
GMMAR model
In the GMMAR framework, each data point is assumed to have been drawn from one of K different Gaussian components (states) that corresponds to a static MAR model with parameters Aj, Λj, with j = 1, … , K. In a probabilistic form, the Gaussian mixture distribution is written as a linear superposition of the K components, such aswhere θj = {Aj, Λj} and wj denote the GMM parameters and weights of the jth component, respectively. Alternatively, if we introduce a latent variable z = {zj} that denotes one of the K components, the previous equation essentially expresses the marginal distribution of a single observation so that
where
is the prior probability of the jth component, and p(yt/z) is the state conditional distribution of the observation yt [given by Equation (2)]:
Introducing hidden variables allows the application of Expectation Maximization (EM), an algorithm suitable for finding ML solutions for models with latent variables Citation[25]. In this context, the E step aims to find the posterior distributions of the latent variables, which are also known as responsibilities. Using Bayes’ theorem and Equations (10)–(12), the responsibility of a component k for a particular data point yt is given byThen, under the current estimate of the model parameters θold, the posterior is used to estimate the expected value of the complete-data log likelihood function p(Y, Z/θ), where Z = {zt}. This expectation, denoted Q(θj, θold), is given by reference Citation[25]:
With the aid of Equations (2), (11) and (12), this expression can be rewritten as follows:
In the M step, Q is maximized separately for each of the two main sets of parameters, wj and θj. Introducing a Lagrange multiplier to enforce the constraint , the value of each component prior is given by the known formula
where we have defined Tj as
The quantity Tj is of central importance here as it denotes the effective number of points assigned to the component j, which essentially provides the length of the particular phase.
The remaining step involves estimation of the model parameters θj. Without loss of generality, we express Equation (15) as a function of the parameters of only one component so that . Based on the analytic form of the Gaussian distribution, and after some algebraic manipulations, we obtain
where we have used the following definitions:
,
. Comparing Equations (5) and (18), one can easily see that maximization of qj with respect to Aj, Λj leads to the same formulae derived for the ML estimation, with the only difference being that the rows of Y, X are replaced by ytj and xtj, respectively. In the Appendix to this paper we summarize the algorithmic steps required to estimate the parameters of interest.
Surgical phase segmentation
Having presented the MAR and GMMAR models, we are now ready to describe the overall framework employed for segmenting the LC operation. The description will be based on the schematic diagram shown in , which depicts the workflow of the framework. Starting from the training module (, top left), the collected hand signals were initially normalized and then smoothed using the empirical mode decomposition (EMD) technique Citation[26]. Similar to the concept of linear superposition in Fourier and wavelet analysis, EMD decomposes a time series into a sum of elementary subsignals (intrinsic mode functions – IMFs). Hence, each raw signal was replaced by its smoothed version, which in this case was chosen as the sum of the first five IMFs. The resulting signals from each sensor are denoted as IMFx,y,z, which correspond to the roll, pitch and yaw angles, respectively.
Figure 2. Schematic diagram of the surgical workflow segmentation algorithm. The algorithm starts by constructing the training set (top left) that contains the regression coefficients of each phase (weights; middle row). A candidate signal is then processed via GMMAR (bottom left) and the estimated mixture weights are compared to those of the training set so as to determine which phase it corresponds to. The signal is then segmented by taking into account the prior probabilities (wi) of each mixture weight (bottom right). The algorithmic steps are described in the inset.
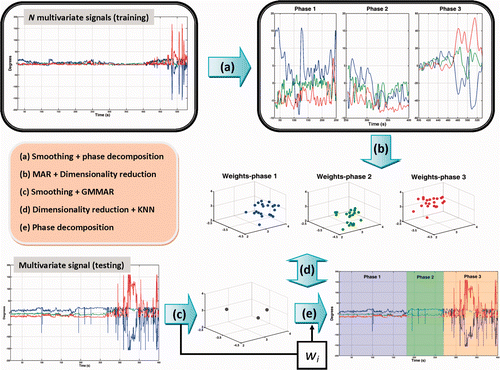
Based on the known timings of the laparoscopic phases, the multivariate signals were decomposed into a corresponding number of hand signals for each of the K = 3 surgical phases (referred to as phase hand signals) (, top right). The MAR algorithm was applied to each of these signals to obtain the regression coefficients that were representative of the underlying process for each surgical phase. The order of the fitting model was set to the maximum of the optimum order found across the three phases (r = 4), which is justified by the adequacy of higher-order models to fit processes with lower complexity.
The next step involved dimensionality reduction of the feature space using principal component analysis (PCA) (see ). Because the number of feature vectors (N = 21) was almost half the number of dimensions (n = rd2 dimensions, with r = 4 and d = 3) a PCA for high-dimensional data Citation[25] was applied, since the standard PCA generates at least n − N + 1 zero-valued eigenvalues. The dimension was then reduced further by considering only those eigenvalues that represented <99% of the total signal energy.
For segmenting a new surgery, the corresponding signals from each hand were treated separately, because we sought to evaluate whether using coefficients from only one hand is adequate to achieve robust segmentation. Moreover, data from both hands would sharply increase the computational complexity of the fitting algorithm, requiring estimation of 36 × r regression coefficients. Prior to processing, the signals were de-noised with EMD decomposition. The GMMAR algorithm was then applied with initial values for the mean and covariance equal to those obtained during MAR modeling of the training set. The optimum number of regressors was set equal to that found during training. Based on the phase durations of the training set, the initial weight for the “clipping phase” was set to half of that used for each of the other two phases. The dimensionality of the resulting coefficients of the mixtures was reduced using the same transformation process followed for the training signals (, bottom left).
In addition to the coefficients vector of each mixture component, the GMMAR algorithm generated an equal number of weights that essentially provided the length of the surgical phases. The next challenge was to match the weights with the surgical phases, which was achieved indirectly by comparing the coefficient vectors of the mixture components with the phase-specific coefficient vectors obtained during training. In particular, a nonparametric k-nearest neighbor (kNN, k = N) with a Mahalanobis distance was employed where each mixture component coefficient vector was classified according to its shortest distance to the labeled vectors in the training set. This information was transferred back (, bottom), so that each weight was assigned the label of its corresponding vector. Having obtained the labels of the weights, the duration of each phase of the test signal is obtained via Equation (16). At this point, it should be noted that this approach always provides sequential labeling of the signal data according to the value of the weights, even if this is not valid for the underlying process (i.e., even if the mixture components are not arranged in a temporal order). In the Results section we provide evidence that this is not the case, and the posteriors of the mixture components were shown to be well separated in the time domain.
Spatiotemporal pattern of hand motion connectivity
Apart from the ability to model a multivariate signal, the regression coefficients may also be used to characterize the spatio-temporal relationship among the signal sources (i.e., rotation angles). Based on our prior work Citation[20], where the concept of hand motion networks was employed to assess the connectivity of the signal components, we here exploit the same idea to analyze the hand motion connectivity pattern demonstrated in the surgical phases. As we were also interested in obtaining potential coupling between the hands, the MAR algorithm was applied to the entire multivariate signal of each subject (6D time series). The derived coefficients were used to define the strength and direction (aij vs aji) of the connections between the signal sources. A hand motion network was defined here as a set of six nodes (Lx,y,z and Rx,y,z, where L/R = left/right hand) connected with each other. A connection (drawn as an arrow) from node j to node i is the element (j, i) of the coefficient matrix ak. Hence, an edge denotes the influence of source j to source i at time k according to
, and i, j = 1, … , 6.
To keep only those connections that are significant in the network, a t-test was applied for each pair of nodes, and time lag, using the MAR coefficients of all subjects. The test was applied under the null hypothesis that the coefficients come from a zero-mean Gaussian distribution with unknown variance. Keeping only those coefficients that were significantly different from zero, the network was constructed by linking only the corresponding nodes. Two levels of significance were considered: P < 0.05 (typical) and P < 0.01 (strong). Plotting the identified significant connections as a network provided a visual representation of the inter-phase difference. We refer to the left-right (or right-left) hand connections as bridges.
Results
Signal modeling
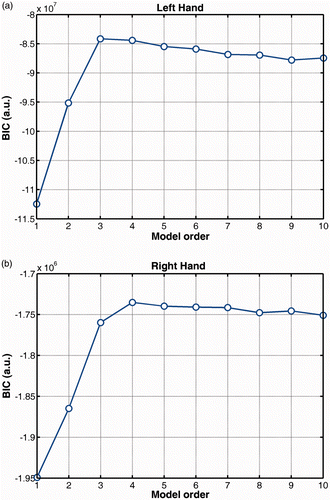
The optimum number of regressors was determined by the maximum value of the BIC function averaged across subjects. This procedure was followed separately for each surgical phase, leading to an equivalent number of BIC curves. The final order was found by averaging these curves. From it can be seen that the optimum order is and
for the left and right hand, respectively. This finding was also observed for the average BIC curves of each phase (results not shown here). For the construction of the hand motion network, the MAR process was applied to the entire 6D signal of each subject using the highest-order value between the two hands.
Figure 3. Model selection curves for the left and right hand.
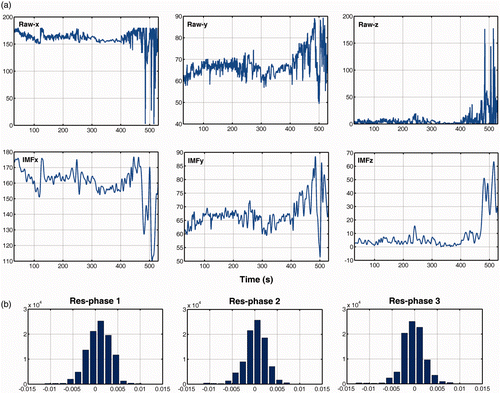
shows samples of raw signal data from the right hand and the corresponding IMFs. For clarity, the signals of the three rotation angles are illustrated by separate graphs. It is clear that the IMFs provide a smoother representation of the raw data, discarding high-frequency fluctuations that originated from the sensor's electronics. The effect of smoothing is greater towards the end of the signal, where the user performs more awkward movements in an attempt to detach the gallbladder from the liver. The signal-to-noise ratio (SNR) of the IMF components was in the order of 103, which was found to be equivalent to a hand signal contaminated with zero-mean Gaussian noise of standard deviation SD ≈ 1. The validity of the MAR model is also illustrated in the histograms of the residuals shown in . If one considers the MAR model as a white noise multivariate signal that has been filtered to generate the observed time series, a Gaussian distribution of the residuals signifies a robust modeling process. This is verified by the form of the histograms, and the small values of the residuals that range between −0.005 and 0.005, with the majority of them being close to zero.
Figure 4. (a) Examples of raw and smoothed hand signals for the three rotation angles (roll, pitch, yaw: x, y, z). (b) Histograms of the residuals computed with MAR models for each phase hand signal.
Signal segmentation
For the training set, the coefficient vectors were reduced to 3–4 and 4–6 for the left and right hand, respectively. The number of features varied because the regression coefficients of the hand signals for each phase were treated separately by PCA. In particular, it was found that the reduced number of features for the coagulation was higher than that for the other two phases, and this was probably due to the greater number of coefficients required to properly fit the signal for this phase.
The upper graphs in show examples of left and right hand-signals after smoothing, as well as the objective timings that separate the three surgical phases: dissection and clipping/cutting by the left dashed line, and clipping/cutting and coagulation by the right dashed line. At first glance, one can see that the signal activity of the right instrument is greater than that of the left one, implying that (1) the right hand is more actively engaged in the performance of the procedure, and (2) the right hand is potentially more suitable for the segmentation task due to its variable signal activity as demonstrated across the surgical phases. Specifically, in the coagulation phase, the two signals vary substantially with time, with the right hand being slightly more active. This is because of the extensive rotations required for positioning the gallbladder with the left grasper so as to apply diathermy with the right-hand instrument. In the first two phases, the left hand movements are limited, mostly due to the fact that the operator tries to hold the gallbladder steady with the grasper in order to perform dissection and clipping/cutting with the right hand.
Figure 5. Examples of smoothed hand signals along with the posterior probabilities of each Gaussian mixture component (shown in different colors) for the left (a) and right (b) hand. Dashed lines denote the objective timings separating the surgical phases. The upper graphs in (a) and (b) are filled with different colors indicating the time course of the three surgical phases as determined by the algorithm.
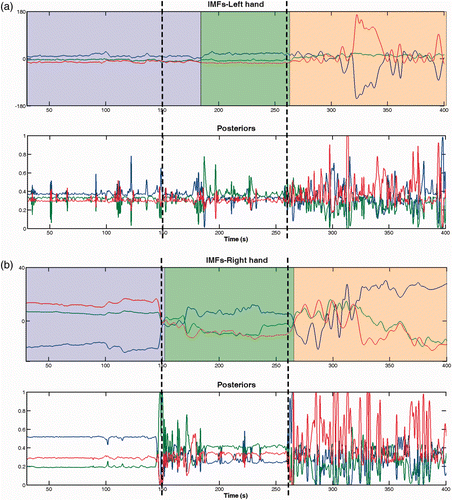
also illustrates the posteriors, which signify the responsibility of the Gaussian mixture components (corresponding to the surgical phases), for each data point in the sequence. To achieve better visualization, the responsibilities of each component are plotted in a different color. It can be seen that, within the objective limits of a particular phase, the responsibility of the corresponding component is higher than that of the other two components. For example, in the coagulation phase, the responsibility of the coagulation component, which is plotted in red, is higher than the responsibility of the other two components for most of the time points. Yet, within each of the other two surgical phases, the posterior of the coagulation is lower than the posterior of the component that corresponds to that particular phase. This can be seen to be valid for all three phases, which denotes the suitability of GMMs in modeling the hand kinematics as a mixture of components, each of which models differently the maneuvers performed during each phase. If, for a particular phase, the corresponding posterior was not higher than the other posteriors for most of that phase's duration, GMM would not be a suitable choice for data fitting.
Along with the objective timings shown in , we have also highlighted the duration of the three surgical phases obtained by the proposed algorithm. One can see that for the right hand the true and estimated durations are very close, whereas for the left hand the duration of dissection was overestimated relative to the clipping/cutting surgical phase. One may also notice the correspondence between the values of the three posteriors shown in the lower graphs and the output of the segmentation algorithm shown in the upper graphs. The algorithm segments the time sequence by comparing the effective number of points that are assigned to each component. Each of the color-filled areas on the upper graphs denotes the total number of data points for which the corresponding responsibility is the highest compared to the responsibilities of the other components.
To measure the performance of the GMM algorithm, we calculated the precision and recall metrics:where tp, fp, fn denote the number of true positive, false positive, and false negative responses for each particular phase and hand. The method was evaluated under a leave-one-out mode (i.e., 20 surgeries were used for training and one for testing).
The classification results are shown in , from which it is clear that, given a particular phase, the right hand provided better recognition, mostly due to its variable activity across the three phases. Our statistical analysis showed that using kinematic data from the right hand signal generated the best results for all three surgical phases (P < 0.03). This finding was somewhat to be expected, as the left hand was mostly used to hold the gallbladder, and consequently its signal activity did not vary much from phase to phase. Overall, the average precision/recall accuracy for the right hand was >84% (except for the precision of the second phase), while for the left hand the corresponding rate ranged from 57% to 77%. The precision for the clipping/cutting phase was much lower than that for the other phases due to the large number of false positives detected. It was observed that the duration of the second phase was usually underestimated in relation to the duration of the dissection phase (phase 1). Thus, a great number of the clipping/cutting false negatives actually corresponded to false positives of the dissection phase, implying that the second phase was mostly “contaminated” from the overestimated duration of the first phase. The recall measure of the clipping/cutting was not influenced as much, however, due to its large number of true positives.
Table I. Precision (Pre) and recall (Rec) for each surgical phase (% average ± SD).
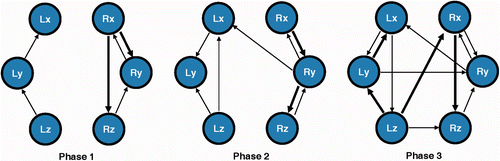
Hand motion connectivity
As described earlier, the hand motion networks were constructed from the MAR coefficients of the entire 6D signal of the subjects. For the sake of simplicity, we considered only first-order models. shows the hand motion networks for each surgical phase, where highly significant couplings (P < 0.01) are drawn as arrows with increased weight. It is clear that the synergy between the signal sources of the hands increases with phase sequence: phase 1, 6 connections; phase 2, 8 connections; and phase 3, 12 connections. Most of the connections were demonstrated between nodes of the same hand, and the number of these intra-hand connections also increased with the operational progress. This may well be due to the increasing complexity of the maneuvers required to complete each sequential phase. The right hand also demonstrated more and greater couplings in comparison to the left hand, which is to be expected, since in the first two phases the user tries to hold the gallbladder as steady as possible with the left instrument, and most of the work is performed with the right instrument. It is also worth noting that in the coagulation phase there were several bridges denoting the presence of synchronized movements between the hands. Indeed, in this phase the surgeon uses the left instrument to manipulate the gallbladder so that its position is suitable for applying diathermy with the right hand. Hence, the number of bridges may well provide an indication of the surgical phase performed.
Figure 6. Hand motion networks. Arrows indicate significant signal connections (P < 0.05); increased weight denotes strong couplings (P < 0.01).
Discussion
In this paper we have presented a method that automatically segments a laparoscopic operation into its main workflow phases and analyzes the hand motion connectivity within each of these phases. In contrast to other work that employs signals of binary values denoting instrument usage across the operation, we exploit kinematic signals obtained from motion sensors attached to the instruments. The basic module of the proposed method employs a GMMAR algorithm that models the signals as a linear superposition of Gaussian mixtures. Prompted by our recent work in which the MAR models were successfully applied for laparoscopic skills assessment in surgical trainees Citation[20], we here combine this approach with Gaussian mixture models. The proposed technique is based on the hypothesis that each phase is characterized by a different pattern of surgical maneuvers that may be modeled with a multivariate autoregressive process. By calculating the posterior probability of each Gaussian component, we have presented data showing the validity of this assumption, with a different component being found to dominate across each phase. Hence, the phase duration was determined by the effective number of data points assigned to the dominant component, which makes the segmentation process a straightforward task.
To derive the correspondence among the Gaussian components and the surgical phases, a supervised classification rule was applied, based on the distance between the MAR coefficients of the training set and those obtained by GMMAR. Theoretically, the GMMAR technique may well be applied in an unsupervised manner to derive the duration of each phase. As the posterior of each component was found to dominate uniquely across a surgical phase, the transition timings, for two consecutive phases, could be determined by the crossing point of the corresponding posteriors. However, this approach assumes that there are no spurious responses (i.e., false positives) in the sequence, which would unavoidably lead to multiple crossings of the posteriors. Consequently, a robust rule has to be defined for the selection of the most appropriate of these crossings, which is, in practice, not a trivial task. For example, if we concentrate on the right hand signal shown in , the posterior of the first component (the blue line) dominates most of the dissection phase, but there are some false positives, especially in the coagulation phase, which would be difficult to drop out in a robust manner. One potential solution could be to use the rate of the posterior probability within a sliding time window, and then select the appropriate transition based on a steep change in this metric. Future work will focus in this direction by exploring similar approaches. Unsupervised phase segmentation is expected to offer a significant advantage, as most research work to date has relied heavily on pre-segmented surgeries Citation[3], Citation[6], Citation[12], Citation[13].
The segmentation framework also included MAR models for creating a training set of regression coefficients for each surgical phase. Based on the data from the right instrument, the proposed method was capable of segmenting the laparoscopic operation with an average accuracy of >84%. The classification rates reported by other researchers based on a completely different set of data (tool usage binary sequences, eye gaze data, etc.), vary from 66% Citation[14] to 88% Citation[11] to 80-97% Citation[3]. Despite the challenging nature of the hand motion signals, the proposed method generates promising results that are close to those reported by other researchers.
Of the three phases, clipping/cutting was the most difficult to segment. The corresponding motion pattern exhibited low variability as a result of the slow and careful manipulation of the clip applicator/scissors to transect the respective anatomic structures. The left instrument was also characterized by low recognition due to its poor kinematic activity. The left instrument had a minor role as all the participants were right-handed. In contrast, the right hand played a significant role since its motion pattern was found to vary notably from one phase to another. For example, the dissection phase, where the goal is to remove the peritoneum from the gallbladder, amounts to intensive forward-backward movements of the dissector. In the clipping/cutting phase there are much slower movements, since the cystic duct/artery has to be transected with care. Finally, the coagulation phase requires a mixed set of maneuvers as the operator detaches the gallbladder from the liver.
The regression coefficients constitute a powerful feature of the MAR models, which in this study were exploited for the construction of informative motion connection patterns. By estimating the coefficients for each separate phase, we were able to obtain the hand motion connectivity network as a result of the instruments’ motion activity. This is an important concept that has not been formally explored in the field of hand kinematics in laparoscopic surgery. Our results showed that the total number of connections either within or between the nodes of the hands increases with surgical workflow. This finding probably emanates from the fact that the LC operation becomes more demanding as it progresses, requiring greater manipulations and synergy of the instruments. The concept of hand motion network was used here to investigate the connectivity difference by gathering data from all subjects. However, the same idea may be explored for segmentation of individual surgeries by comparing the resulting coefficients (i.e., connections) to those obtained from the training set.
Although the recognition results obtained by the proposed framework are promising, a profound limitation is that the hand kinematic signals originate from a simulated, rather than a clinical, setting. Prior studies have shown that signals of this type can also be obtained in the operating room without imposing major constraints on the surgical workflow Citation[27], Citation[28]. Moreover, hand kinematic signals may be easier to obtain compared to binary signals denoting the usage of the instruments, a process that is currently performed manually Citation[6], Citation[11]. In the future, we plan to employ the motion sensors in the operating room, and also investigate potential ways of recognizing the transition of the surgical phases using online learning algorithms within the Gaussian mixtures framework Citation[29].
Another potential limitation is the omission of a comparison with other methods found in the current literature. However, most studies on laparoscopic surgical phase segmentation (a) employ binary signals of tool usage sequences, and (b) are based on data obtained from real surgeries. Our approach is completely new, and is based on the alternative assumption that each phase is characterized by a different set of maneuvers. Moreover, tool usage sequences could not be extracted with the current experimental setting as the employed simulator uses a limited set of tools (approximately 3 or 4), which is significantly smaller than those used in other studies (more than 10 tools). The full potential of the proposed method thus remains to be established in the actual surgical setting, but currently it appears that hand kinematics is a promising source of information not only for segmenting an interventional procedure but also for evaluating surgical performance during each of the phases segmented.
Declaration of interest: The authors report no declarations of interest.
References
- Dazzi L, Fassino C, Saracco R, Quaglini S, Stefanelli M, A patient workflow management system built on guidelines. Proceedings of the American Medical Informatics Association (AMIA) Annual Fall Symposium, Nashville, TN, October 1997. pp 146-150
- Cleary K, Kinsella A, Mun SK, OR 2020 workshop report: Operating room of the future. In: Computer Assisted Radiology and Surgery. Proceedings of the 19th International Congress and Exhibition (CARS 2005), Berlin, Germany, June 2005. Amsterdam: Elsevier; 2005. pp 832–838
- Padoy N, Blum T, Ahmadi SA, Feussner H, Berger MO, Navab N. Statistical modeling and recognition of surgical workflow. Med Image Anal 2010; 16(3)632–641
- Sakoe H. Chiba S. Dynamic programming algorithm optimization for spoken word recognition. IEEE Trans Acoust Speech Signal Process 1978; 26: 43–49
- Ahmadi S-A, Sielhorst T, Stauder R, Horn M, Feussner H, Navab N. Recovery of surgical workflow without explicit models. In: Larsen R, Nielsen M, Sporring J, editors. Proceedings of the 9th International Conference on Medical Image Computing and Computer Assisted Intervention (MICCAI 2006), Copenhagen, Denmark, October 2006. Part I. Lecture Notes in Computer Science 4190. Berlin: Springer; 2006. pp 420-428.
- Padoy N, Blum T, Essa IA, Feussner H, Berger M-O, Navab N. A boosted segmentation method for surgical workflow analysis. In: Ayache N, Ourselin S, Maeder AJ, editors. Proceedings of the 10th International Conference on Medical Image Computing and Computer Assisted Intervention (MICCAI 2007), Brisbane, Australia, October 29-November 2, 2007. Part I. Lecture Notes in Computer Science 4791. Berlin: Springer; 2009. pp 102–109
- Rabiner LR. A tutorial on Hidden Markov Models and selected applications in speech recognition. Proceedings of the IEEE 1989; 77(2)257–286
- Lin HC, Shafran I, Murphy TE, Okamura AM, Yuh DD, Hager GD, Automatic detection and segmentation of robot-assisted surgical motions. In: Duncan JS, Gerig G, editors. Proceedings of the 8th International Conference on Medical Image Computing and Computer Assisted Intervention (MICCAI 2005), Palm Springs, CA, October 2005. Part I. Lecture Notes in Computer Science 3749. Berlin: Springer; 2005. pp 802-810
- Dosis A, Bello F, Gillies D, Undre S, Aggarwal R, Darzi A. Laparoscopic task recognition using Hidden Markov Models. Stud Health Technol Inform 2005; 111: 115–122
- Leong JJH, Nicolaou M, Atallah L, Mylonas GP, Darzi AW, Yang G-Z. HMM assessment of quality of movement trajectory in laparoscopic surgery. Comput Aided Surg 2007; 12(6)335–346
- Bouarfa L, Jonker PP, Dankelman J. Discovery of high-level tasks in the operating room. J Biomed Inform 2011; 44(3)455–462
- Padoy N, Blum T, Feussner H, Berger M-O, Navab N. On-line recognition of surgical activity for monitoring in the operating room. In: Proceedings of the Twentieth Conference on Innovative Applications of Artificial Intelligence (IAAI-08), Chicago, IL, July 2008. pp 1718–1724
- Blum T, Padoy N, Feussner H, Navab N, Modeling and online recognition of surgical phases using Hidden Markov Models. In: Metaxas DN, Axel L, Fichtinger G, Székely G, editors. Proceedings of the 11th International Conference on Medical Computing and Computer Assisted Intervention (MICCAI 2008), New York, NY, September 2008. Part II. Lecture Notes in Computer Science 5242. Berlin: Springer; 2008. pp 627-635
- James A, Vieira D, Lo BPL, Darzi A, Yang G-Z. Eye-gaze driven surgical workflow segmentation. In: Ayache N, Ourselin S, Maeder AJ, editors. Proceedings of the 10th International Conference on Medical Image Computing and Computer Assisted Intervention (MICCAI 2007), Brisbane, Australia, October 29-November 2, 2007. Part II. Lecture Notes in Computer Science 4792. Berlin: Springer; 2007. pp 110–117
- Blum T, Feussner H, Navab N, Modeling and segmentation of surgical workflow from laparoscopic video. In: Jiang T, Navab N, Pluim JPW, Viergever MA, editors. Proceedings of the 13th International Conference on Medical Image Computing and Computer Assisted Intervention (MICCAI 2010), Beijing, China, September 2010. Part III. Lecture Notes in Computer Science 6363. Berlin: Springer; 2010. pp 400–407
- Rosen J, Brown JD, Chang L, Sinanan MN, Hannaford B. Generalized approach for modeling minimally invasive surgery as a stochastic process using a discrete Markov model. IEEE Trans Biomed Eng 2006; 53(3)399–413
- Megali G, Sinigaglia S, Tonet O, Dario P. Modelling and evaluation of surgical performance using hidden Markov models. IEEE Trans Biomed Eng 2006; 53(10)1911–1919
- Bhatia B, Oates T, Xiao Y, Hu P, Real-time identification of operating room state from video. In: Proceedings of the 19th National Conference on Innovative Applications of Artificial Intelligence (IAAI ’07), Vancouver, BC, July 2007. Vol 2. pp 1761–1766
- Xiao Y, Hu P, Hu H, Ho D, Dexter F, Mackenzie CF, Seagull FJ, Dutton RP. An algorithm for processing vital sign monitoring data to remotely identify operating room occupancy in real-time. Anesth Analg 2005; 101(3)823–829
- Loukas C, Georgiou E. Multivariate autoregressive modeling of hand kinematics for laparoscopic skills assessment of surgical trainees. IEEE Trans Biomed Eng 2011; 58(11)3289–3297
- Tang B, Hanna GB, Joice P, Cuschieri A. Identification and categorization of technical errors by Observational Clinical Human Reliability Assessment (OCHRA) during laparoscopic cholecystectomy. Arch Surg 2004; 139(11)1215–1220
- Loukas C, Nikiteas S, Kanakis M, Georgiou E. Deconstructing laparoscopic competence in a virtual reality simulation environment. Surgery 2011; 149(6)750–760
- Cotin S, Stylopoulos N, Ottensmeyer MP, Neumann PF, Rattner DW, Dawson S, Metrics for laparoscopic skills trainers: The weakest link! In: Dohi T, Kikinis R, editors. Proceedings of the 5th International Conference on Medical Image Computing and Computer Assisted Intervention (MICCAI 2002), Tokyo, Japan, September 2002. Part I. Lecture Notes in Computer Science 2488. Berlin: Springer; 2002. pp 35-43
- Penny WD, Roberts S. Bayesian multivariate autoregressive models with structured priors. IEE Proc Vision Image Signal Processing 2002; 149(1)33–41
- Bishop CM. Pattern Recognition and Machine Learning. Springer, New York, NY 2006
- Huang NE, Shen Z, Long SR, Wu MC, Shih HH, Zheng Q, Yen N-C, Tung CC, Liu HH. The empirical mode decomposition and the Hilbert spectrum for non-linear and non stationary time series analysis. Proc Royal Soc London A 1998; 454(1971)903–995
- Dosis A, Aggarwal R, Bello F, Moorthy K, Munz Y, Gillies D, Darzi A. Synchronized video and motion analysis for the assessment of procedures in the operating theater. Arch Surg 2005; 140(3)293–299
- Lin HC, Shafran I, Yuh D, Hager GD. Towards automatic skill evaluation: detection and segmentation of robot-assisted surgical motions. Comput Aided Surg 2006; 11(5)220–230
- Declercq A, Piater JH, Online learning of Gaussian mixture models: a two level approach. In: Proceedings of the Third International Conference on Computer Vision Theory and Applications (VISAPP 2008), Funchal, Madeira, Portugal, January 2008. Vol 1. pp 605-611
Appendix
Algorithmic steps required to estimate parameters of interest.
Choose an initial setting for the parameters:
Evaluate the responsibilities for every data point yt in the sequence:
where
Evaluate
Check for convergence of the log likelihood. If the convergence criterion is not satisfied, go to step 2 and let