Abstract
This study sought to develop a completely automatic method for image segmentation of the thoracic aorta. We used a total of 4682 images from 10 consecutive patients. The proposed method is based on the use of level set and region growing, automatically initialized using the Hough transform. The results obtained were compared to those of manual segmentation as performed by an external expert radiologist. Concordance between the developed method and manual segmentation ranged from 92.79 to 95.77% in the descending regions of the aorta and from 90.68 to 96.54% in the ascending regions, with a mean value of 93.83% being obtained for total segmentation.
Introduction
The aorta is the largest artery in the human body and distributes the greatest volume of blood. The progressive increase in life expectancy in Western countries has led to a rise in the incidence of disorders of the thoracic aorta, including aneurysm, dissection, mural thrombus, penetrating ulcer, intramural hematoma and others. The thoracic aorta is divided into four regions, namely the aortic sinus (extending from the aortic valve annulus to the sinotubular junction), the ascending aorta (extending from the sinotubular junction to the origin of the brachiocephalic trunk), the aortic arch (extending from the proximal part of the origin of the brachiocephalic trunk to the distal portion of the origin of the left subclavian artery), and the descending aorta (extending from the distal portion of the origin of the left subclavian artery to the aortic hiatus of the diaphragm) ().
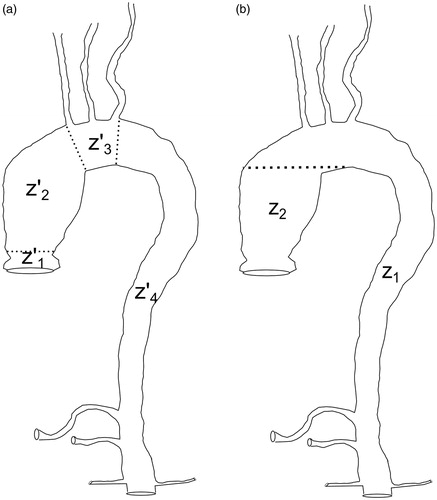
Figure 1. (a) Clinically established regions of the thoracic aorta. The figure includes the supra-aortic trunks (brachicephalic trunk, left subclavian artery and left common carotid artery) and the visceral trunks (renal arteries, celiac trunk and superior mesenteric artery). (b) Regions of the thoracic aorta segmented using the automatic method.
Although assessment of the aorta has traditionally been based on conventional angiography, transverse-section data yielded by a computed tomography angiography (CTA) scan extends the range of possible diagnoses. CTA allows for rapid assessment and is an important tool for evaluating patients with chest pain, since the three-dimensional (3D) volume affords more information on the nature of the disease. A study of this nature involves injection of intravenous contrast, which enables the blood flow shown in the images to be enhanced, thereby resulting in sharp contrast between the area corresponding to vasculature and the remainder of the image. Use of such contrast goes a long way towards facilitating segmentation of the aorta in the descending sections and aortic arch, a task that can be done using simple techniques such as region growing [Citation1]. Even so, a certain degree of difficulty is associated with segmentation of the aorta along its ascending section, due to its complex morphology. Specifically, the aorta is connected to the heart, which is filled with blood. This renders the boundary between the heart itself and the aorta indistinguishable [Citation2]. Not only does this problem affect the development of an automatic segmentation algorithm, it also affects medical specialists, inasmuch as manually performed segmentation calls for a considerable investment of time on their part.
Segmentation of the aorta may be useful for the analysis of images, both for diagnosis and intervention planning. For diagnosis, it provides the vascular radiologist with a useful tool for studying a complex arterial segment with a significant reduction in study time. It also allows non-vascular radiology specialists to perform this task, thereby enabling such studies to be conducted in hospitals that do not have vascular radiologists. For therapeutic planning, segmentation facilitates the work of the surgeon ahead of obtaining additional morphological information to carry out more accurate therapeutic strategies. Among the planning tasks, segmentation assists in (i) the determination as to whether surgery is indicated, (ii) the calculation of the dimensions of the affected region, and (iii) the design of the therapeutic strategy itself, estimating the possibility of either endovascular or open surgery. In the case of stent placement, accurate measurement of vessel diameters is fundamental to the indication, and to the selection and release of the stent. Finally, if open surgery is indicated, accuracy is needed in the delimitation of the boundary of the area to be treated.
A variety of aorta segmentation methods have been described in the literature. Wink et al. [Citation3] proposed a method based on determination of the centerline, in order to estimate the edge of the vessel. For this purpose, they took a point situated in the vessel interior, given by the operator, and used a gradient-type filter to search in different directions for variations in intensity. Other authors have developed methods based on the idea of volume ray casting [Citation4, Citation5]. In such a case, two initial points on the centerline are needed, and the principal limitation is sensitivity to noise. Bruijne et al. [Citation6] described a method based on active shape models for segmentation of tubular structures in medical images. An overlap of 95% was obtained on 21 cases when the volumes obtained by both methods, manual and computer, were compared. Model-based segmentation has the advantage of being able to perform segmentation even in areas in which the contour does not exist or is blurred. Thereby, Friman et al. [7] obtained reconstructions of the coronary arteries in 32 patients. The overlap with the human expert segmentations was 98.7%. However, the creation of these 3D models tends to be limited by variability in the available database. Finally, Subasić et al. [Citation8] have introduced a method for segmenting the inner and outer wall of the abdominal aorta. This method is based on level set and uses a priori knowledge about the shape of the aorta to establish different stopping criteria. Comparison of the areas obtained with both manual and computer methods was performed on CT scans of 12 patients. A Pearson’s correlation coefficient (PCC) of 0.97 was obtained. Nevertheless, this method requires the intervention of the operator, as in the segmentation method proposed by Wu et al. [Citation9] based on a level set evolution.
Our study focused on developing a completely automatic method for segmentation of the thoracic aorta based on CTA images. Initialization is automatic and uses the Hough transform on the most caudal slice of each case to locate the exact position of the aorta. Using the above position as a seed point, volumetric region growing is then implemented, which segments the descending aorta, the aortic arch, and a portion of the ascending aorta and supra-aortic trunks (section Z1 in ). The remaining region of the ascending aorta (section Z2 in ) is segmented slice-by-slice using deformable contours.
Method
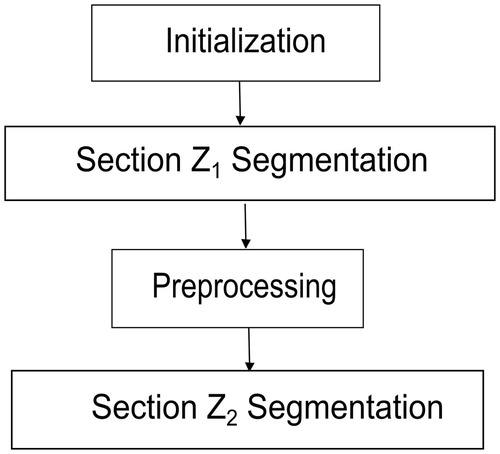
The proposed method is completely automatic and is based on images corresponding to CTA slices obtained from patients injected with contrast. outlines the method’s four basic steps. The initialization uses the Hough transform on the most caudal slice of each case to locate the area of the image corresponding to vasculature. Based on the coordinates of the center of this region, volumetric region growing is then applied to segment the descending aorta, the aortic arch, and a part of the ascending aorta and supra-aortic trunks (section Z1 in ). The remaining portion of the ascending aorta (section Z2 in ) is segmented by applying a level-set-based algorithm.
Figure 2. Flowchart of the essential steps in the segmentation of the thoracic aorta.
(A) Initialization
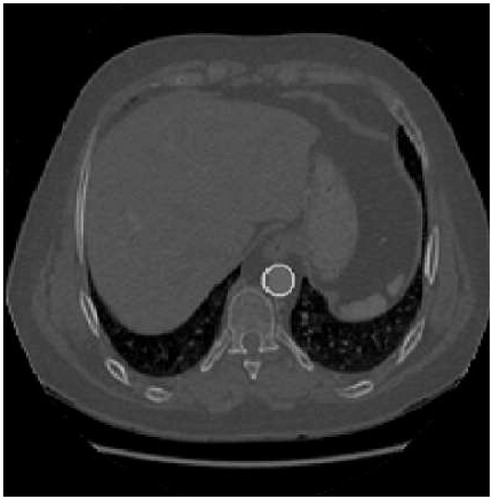
The process of segmentation begins at the most caudal slice of the descending aorta. In this area, a slice’s approximate shape is a circle. The Hough transform enables pre-set shapes to be found in an image and can be described as the transformation of a given point in the plane into a parameter space. It is used in processing the entire set of the image, making it robust in the presence of noise or discontinuities. In this specific case, the parameter space is characterized by the expressions corresponding to the parametric curves of the circle. Therefore, the parameter space is three-dimensional, corresponding to the circle center position, (x0, y0), and the radius, r.
To calculate the image in the parameter space (H), we used the convolution of the image of the baseline slice (G) with a circular mask (K) having a radius r, where
The radius of the circular mask (r) ranges from a minimum to a maximum radius pre-set for all images. Application of this technique enables the circle which represents the aorta in this first slice to be automatically obtained (). Based on this result, one can then obtain the centerline coordinates which will serve to initialize the algorithm.
Figure 3. Initialization in the last slice by the Hough transform.
(B) Segmentation of section Z1
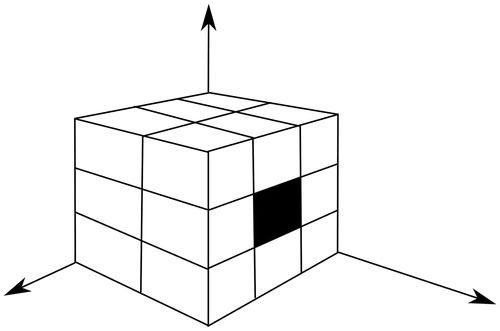
The coordinates calculated in the preceding step are used as the seed point for the application of the volumetric region-growing technique. The regions are then grown from these seed points to adjacent points depending on a region membership criterion; in this case, the criterion was the mean of pixel neighbors. This volumetric region growing consists of the use of the 17 pixel neighbors corresponding to the previous and current slices () for the calculation of the mean and variance. This 17-connectivity restricts region growing in one direction in the z-axis, and thus avoids segmentation of the ascending aorta and consequently the heart. The criterion for adding a new point, p, of coordinates (x. y. z) to the segmented region is
Figure 4. The 17 neighbors considered in the volumetric region-growing technique.
The values corresponding to the mean and variance are updated at each iteration. With the use of this algorithm, the descending aorta, aortic arch, and a portion of the ascending aorta can be segmented.
(C) Pre-processing
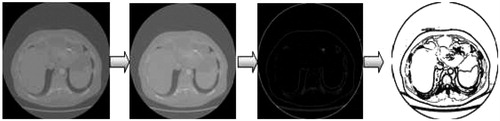
The transition from section Z1 to section Z2 is characterised, in image terms, by a sudden increase in the size of the segmented region at its axial slice. The region thus obtained can be approximated by an ellipse () in which one of the foci will be used to initialize the segmentation of section Z2. To prevent any overlapping of the segmented region, owing to the connection between the ascending aorta and the heart, segmentation of section Z2 uses the level set rather than the region growing technique. For the application of this technique, a pre-processing stage must be introduced previously. This is essential both to enhance the edges of the image and, simultaneously, to eliminate any inhomogeneous areas of the image which might lead to poor segmentation. To achieve this, three filters, i.e., anisotropic diffusion, gradient and threshold, are applied consecutively (). The anisotropic diffusion filter is applied to reduce the noise in the image and homogenize it in areas having a similar gray level by preserving the edges [Citation10]. The method is based on the use of the anisotropic diffusion equation proposed by Perona and Malik [Citation11]:
where f = f(x. y. t) and f(x. y, 0) = I(x. y) is the input image. The term
is called conductance and takes the following form:
Figure 5. A slice approximated by an ellipse.
Figure 6. The pre-processing stage to enhance the edges of the image.
Conductance acts on areas of the image in which the gradient is greatest. The effect of smoothing in these areas is thus reduced. To identify the vessel walls in the image, the output of the anisotropic diffusion filter is used as the input for a gradient filter with smoothing. To this end, the filter's input image is convolved with the first derivative of a Gaussian filter. Lastly, the output image of the edge filter is used as the input of a threshold filter. This consists of a non-linear stage that takes the following form:
where I is the intensity of the input pixel, I′ is the intensity of the output pixel, and the parameters α. β, Max and Min are pre-set at the same value for all images.
(D) Segmentation of section Z2
Segmentation of section Z2 assumes a smooth variation in shape between consecutive slices. This assumption is necessary to perform a two-dimensional (2D) segmentation in which each slice will be individually segmented by means of level sets. The result obtained for each slice will be used to initialize the segmentation of the following slice.
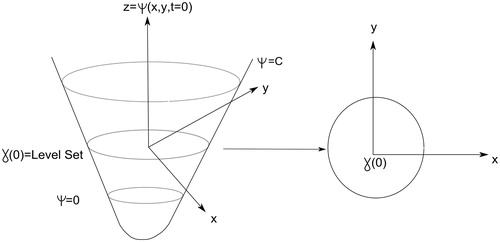
The basic idea underlying level set can be stated as follows: Given a 2D closed curve, its representation by a single 2D function is not possible. A solution consists of using a 3D function intersected by a plane at a given height (). Thus, assuming that all possible variations corresponding to the evolution of the 2D curve were captured by the 3D function at different levels, the former would be completely defined by reference to the 3D function. Obviously, the implicit representation of level-set function is not unique, because there are infinite level-set functions that can define a particular 2D form. Therefore, given an initial closed n-1 dimensional hyper-surface, γ, we want to evolve it over time, γ.t), as it propagates along its normal direction according to a speed function F. Thereby, γ is embedded as the zero level set of a higher-dimension function Ψ. Let , for
∈ R2, defined by
where d is the distance from
to γ.t = 0). So, the curve γ.t) could be represented by the zero set of the associated function Ψ(x. t) as follows [Citation12]:
Figure 7. The level-set algorithm.
In addition, we want the speed of motion in the normal direction to be F, or, in other words, for each x.t) € γ(t),
where
is normal to the front at
and F.x.t)) is the speed function for that point.
We want the zero level set of ψ to match our propagating hyper-surface, so we have the condition
Thus,
By the chain rule,
and since
, we have
, thus obtaining our level set evolution equation [Citation12]:
where F is the speed function. The function F can have a number of terms:
This equation, which describes the evolution of the curve γ.t) across time, includes the following: a curvature term FC that lends greater or lesser rigidity to the curve; a translation term F0 that allows for the curve’s displacement across the plane in which it lies; and an energy term that contains the image obtained in the previous process, I′(x. y).
Based on the curve obtained after the resolution of the equation, the region of interest (ROI) and center of mass in terms of gray level are then calculated for each slice. The ROI is defined as the rectangle that encloses the entire segmented region, and is used to initialize the curve in the next slice. The center of mass serves to indicate this curve’s position, and the ROI indicates its initial dimensions. Hence, by ascertaining the segmentation of a given slice, one obtains the parameters (i.e., position and size) needed to construct a new curve, which will in turn evolve and segment the following slice.
The following expressions are used to calculate the center of mass:
where GLi is the gray level of the ith component, xi is the value of the x-coordinate at position i. yi is the value of the y-coordinate at position i. CMX is the x-coordinate of the center of mass, and CMY is the y-coordinate of the center of mass.
Results
The method developed here was applied to a database comprising 4682 images of 10 consecutive patients scanned at the Radiodiagnostic Unit at the Santiago de Compostela University Teaching Hospital. The patient database was made up of 4 normal cases (3 female, 1 male, mean age 50 years) and 6 pathological cases (1 female, 5 male, mean age 54 years). All pathological patients included in the study had thoracic aortic aneurysms. Specifically, three patients had ascending aortic aneurysms; one had an aneurysm of the aortic arch; one had an ascending aortic aneurysm with elongation in the descending aorta; and in one patient both the ascending and descending aorta were affected.
All patients gave written informed consent to undergoing a CT scan. The study was performed using a 64-slice multidetector row CT scanner (LightSpeed VCT, GE Healthcare).
After injection of intravenous contrast to opacify the lumen of the vessel and enhance the quality of the image, 512 × 512-pixel images were obtained in DICOM format, with a resolution ranging from 0.67 × 0.67 (mm/pixel) to 0.93 × 0.93 (mm/pixel). The energy range was 100-120 kVp. shows the final result of the automatic segmentation performed on one case. In order to be able to assess the segmentation undertaken with our method, a manual segmentation was previously performed to serve as the gold standard for comparison purposes. This manual segmentation was performed by an expert radiologist, using a graphics tablet equipped with software and a light pen for manually tracing edges on the visualized image.
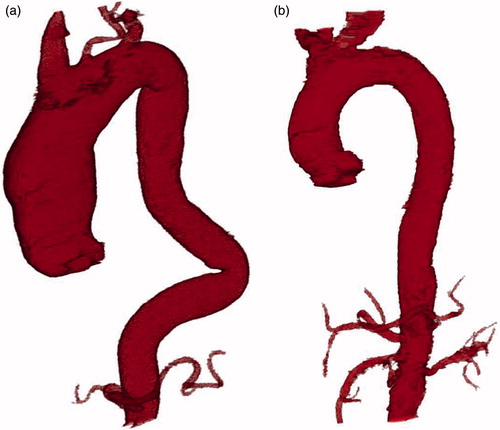
Figure 8. (a) Automatic segmentation of the thoracic aorta with dilatation of the ascending thoracic aorta and elongation of the descending thoracic aorta. (b) Automatic segmentation of a normal thoracic aorta.
shows the results obtained, in terms of the size of the area segmented vis-à-vis slice position, for the two types of segmentation performed (i.e., manual and automatic). Different patterns of behavior were in evidence, depending on whether the ascending aorta, descending aorta, or aortic arch was involved. In the ascending aorta region, there was a small peak corresponding to the sinuses of Valsalva. From this region onwards, the segmented area decreased. This reduction in the segmented region indicates the separation between the ascending aorta and the entrance to the heart, i.e., the aortic valve, which shows that the proposed method automatically locates the heart.
Figure 9. Results obtained in terms of the size of the area segmented.
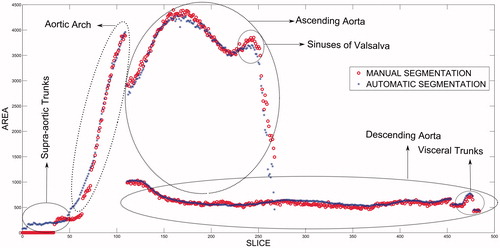
The method also segments the renal arteries, celiac trunk, and superior mesenteric artery, which appear in and correspond to the peak indicated in the figure in the region of the descending aorta. The results displayed a high degree of correlation between the manual and automatic methods (), with a mean correlation coefficient of 0.976.
Table I. The Pearson’s correlation coefficient (PCC) for each patient.
To make comparisons in terms of volume, Dice similarity coefficients (DSCs) were calculated for each patient in each axial slice for sections Z1 and Z2, respectively. The slices corresponding to the supra-aortic trunks were not included in this similarity study. The DSC has been used in a number of studies to assess segmentation results [Citation13]. In our case, it was defined as follows:
where A and B are the segmented masks of the manual and automatic methods. Whereas a value of 0 indicates that the two areas or volumes are not superimposed, a value of 1.0 indicates that the superimposition is perfect. shows the DSC in percentage terms for both segmentations. It will be observed that the volumes calculated by both methods were fairly close, with a volume of superimposition in excess of 90% being obtained. gives the DSC calculated by region, with the results for sections Z1 and Z2 being obtained separately. depicts the similarity coefficient calculated above for section Z2 in one of the cases vis-à-vis the slice position that it occupies. From this figure it will be seen that the DSC was very close to unity for most of the section, but that its value decreased in the slices near the heart, which reduced the final result of the segmentation in section Z2. For the ten patients analyzed as a whole, Bland-Altman plots were used to compare the two segmentation methods, in order to ascertain whether they could be used interchangeably. shows the results obtained when the limit of concordance was set at 95%; in other words, when the concordance-limit values were given by the mean difference ± 1.96 times the standard deviation of the differences.
Figure 10. Decrease in Dice similarity coefficient in the region near the heart.
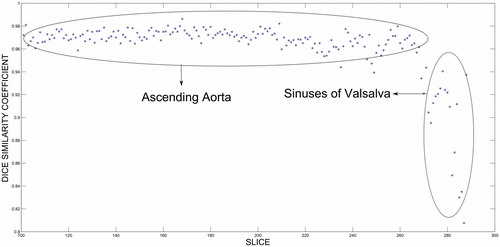
Figure 11. Bland-Altman plot corresponding to the volumes.
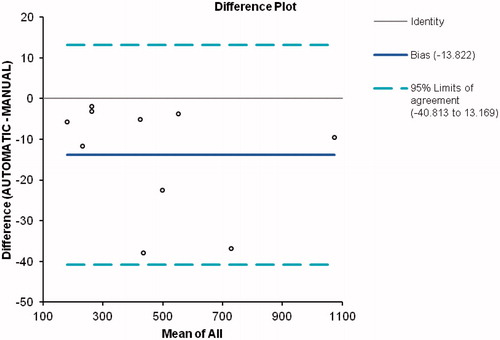
Table II. Descriptive statistics of the Dice similarity coefficient (DSC) for the aorta for the gold standard (manual segmentation) and proposed methods.
Table III. Descriptive statistics of the Dice similarity coefficient (DSC) for the ascending and descending aorta.
Discussion and conclusions
Segmentation of the inner surface of the aorta on the basis of CT images obtained after injection of contrast is now possible because of the availability of high-resolution equipment. This technology allows the development of semi-automatic methods to differentiate the lumen of a vessel from surrounding tissue. In general, most such studies address the descending aorta, where, thanks to the high contrast of the image produced by the radiopaque agent, well-defined edges are obtained. In this type of situation, the application of simple region-growing techniques solves the problem of segmentation.
The ascending aorta, in contrast, presents the drawback of being directly connected to the heart, which also receives contrast. In terms of image, therefore, there is continuity between the two structures, eliminating or at least blurring the boundaries. The consequence of all this is that the application of a region-growing technique in this area complicates the design of a valid stopping criterion for arresting growth in this section of the aorta. It is therefore necessary to design alternative solutions to stopping, such as prior detection of the heart [Citation3], which would complicate the algorithm's implementation.
The aim of our study was to propose an automatic segmentation of the interior of the aorta performed by applying two different segmentation techniques, depending on the section of the aorta under consideration. The first of these techniques is based on 3D regional growing and serves to segment the descending aorta, the aortic arch, and a portion of the ascending aorta and supra-aortic trunks included in the study (section Z1). It is a simple and rapid technique which enables optimal results to be obtained. The second technique is based on the use of level sets, which implies performing a greater number of calculations per slice, thereby slowing the segmentation process. For this reason, it is only applied to a portion of the ascending aorta (section Z2). In this area, region growing does not achieve good results because it expands into the interior of the heart, whereas the level-set-based technique manages to come to a halt at approximately the entrance to the heart. Sections Z1 and Z2 were described, as indicated in , to facilitate comparison between the manual and automatic segmentation methods.
Achievement of an automatic method of segmentation necessarily implies that the operator must at no time be obliged to interact with any of the images of the case to be analyzed. This means that a stage must be included which enables a starting point to be established for the whole segmentation process. Accordingly, we included a stage that served to identify the position of the thoracic aorta in the last slice of the descending aorta, using the Hough transform on the image corresponding to this slice for the purpose. This technique has been previously proposed in the literature [Citation14]. In those earlier studies, however, its use was proposed on slices corresponding to the ascending aorta for the purpose of ascertaining its position. In our case, we opted to initialize the system at the most caudal slice of each case (the descending aorta), due to the non-existence of structures with similar shapes (circular) that might confound the algorithm. Analysis of the similarity coefficient for sections Z1 and Z2 () showed that the results obtained for section Z1 ranged from 92.79 to 95.77%, with a mean area of superimposition of 94.33%, and those obtained for section Z2 ranged from 90.68 to 96.54%, with a mean area of superimposition of 93.03%. As was to be expected, the results obtained for segmentation of section Z1 were slightly better than those obtained for section Z2. This is due to the fact that segmentation of section Z2 worsens at slices near the heart, as can be seen from , in which a decrease in the DSC is plainly visible in slices corresponding to the region near the heart (the sinuses of Valsalva).
Analysis of the data in terms of segmented volume showed that the mean correlation coefficient was high (0.972), with the range of values attained being in excess of 0.9 (). For a more in-depth analysis of the results obtained, depicts the Bland-Altman plot corresponding to the volumes yielded by both methods. It will be observed that all the values lie within the limits of concordance. Furthermore, it will be seen that the differences between values stand at around -13.8, which demonstrates that, in each slice, the area segmented by the automatic method is smaller than that obtained using the manual method. Nevertheless, this difference does not depend on the volume segmented, thus ensuring that the proposed method is valid for calculating aorta volumes, regardless of their size.
Comparison with non-automatic methods described in the literature is always difficult, not only because the database is different, but also because the region to be analyzed also varies (abdominal aorta, coronary arteries, etc.), and because the manual segmentation was performed by a different specialist in every case. Kurkure et al. [Citation15] reported some results concerning the same region described in our paper. Their results showed an average similarity coefficient for the ascending aorta of 88% within a range of values from 68 to 96%. In our case, the results yielded an average of 93.03% for the ascending aorta, and are thus significantly better. It is important to emphasize at this point that our method is fully automatic, thus no human intervention is necessary to mark one or more seed points. This capability allows the algorithm to run offline, raising the possibility of automating the diagnosis of aortic aneurysms by means of the introduction of some kind of signal that will alert the radiologist to their presence.
Our method is applicable to all the cases studied here. The results obtained enable a correlation to be established between the increase in aortic diameter and the segmentation obtained, thereby highlighting clear differences between the pathological and normal cases. The correlation between the automatic method and the manual method performed by the radiologist displayed a high degree of agreement, yielding mean superimpositions of 93.83% for total segmentation of the aorta and 93.03% and 94.33% for sections Z2 and Z1, respectively. The Bland-Altman plot shows that the results fall within the established clinical limits.
As performed here, automatic segmentation is an efficient alternative to manual segmentation in all the situations tested and serves as an aid to diagnosis. Even though the results presented in this paper are preliminary, we conclude that the described segmentation method could be an efficient alternative to manual segmentation. However, further studies that include a more complete database will be needed in order for the technique to be included in daily clinical practice.
Declaration of interest
The authors report no declarations of interest. This work was supported in part by the European Regional Development Fund (ERDF/FEDER) under the Project CN2012/151 of the Galician Ministry of Education.
References
- Pohle R, Toennies KD. 2001. Segmentation of medical images using adaptive region growing. Proc SPIE Medical Imaging 4322:1337–46
- Kovács T, Cattin P, Alkadhi H, et al. 2006. Automatic segmentation of the vessel lumen from 3D CTA images of aortic dissection. Bildverarbeitung Fr Die Medizin Part 2:161–5
- Wink O, Niessen WJ, Viergever MA. 2000. Fast delineation and visualization of vessels in 3-D angiographic images. IEEE Trans Med Imaging 19:337–46
- Gülsün MA, Tek H. 2008. Robust vessel tree modeling. In: Metaxas DM, Axel L, Fichtinger G, Székely G, editors. Proceedings of the 11th International Conference on Medical Image Computing and Computer Assisted Intervention (MICCAI 2008), New York, NY, September 2008. Part I. Lecture Notes in Computer Science 5241. Berlin: Springer. pp 602–11
- Lesage D, Angelini ED, Bloch I, Funka-Lea G. 2009. A review of 3D vessel lumen segmentation techniques: Models, features and extraction schemes. Med Image Anal 13:819–45
- de Bruijne M, Van Ginneken B, Viergever MA, Niessen WJ. 2003. Adapting active shape models for 3D segmentation of tubular structures in medical images. Inf Process Med Imaging 18:136–47
- Friman O, Hindennach M, Kühnel C, Peitgen HO. 2010. Multiple hypothesis template tracking of small 3D vessel structures. Med Image Anal 14:160–71
- Subasić M, Loncarić S, Sorantin E. 2005. Model-based quantitative AAA image analysis using a priori knowledge. Comput Methods Programs Biomed 80:103–14
- Wu X, Luboz V, Krissian K, et al. 2011. Segmentation and reconstruction of vascular structures for 3D real-time simulation. Med Image Anal 15:22–34
- Whitaker RT, Xue X. 2001. Variable-conductance, level-set curvature for image denoising. Proceedings of the IEEE International Conference on Image Processing, Thessaloniki, Greece, October 2001. pp 142–5
- Perona P, Malik J. 1990. Scale-space and edge detection using anisotropic diffusion. IEEE Trans Pattern Anal Machine Intell 12:629–39
- Malladi R, Sethian JA, Vemuri BC. 1995. Shape modeling with front propagation: A level set approach. IEEE Trans Pattern Anal Machine Intell 17:158–75
- Zhuge F, Rubin GD, Sun S, Napel S. 2006. An abdominal aortic aneurysm segmentation method: Level set with region and statistical information. Med Physics 33:1440–53
- Wang S, Fu L, Yue Y, et al. 2009. Fast and automatic segmentation of ascending aorta in MSCT volume data. Proceedings of the 2nd International Congress on Image and Signal Processing (CISP ‘09), Tianjin, China, October 2009. pp 1–5
- Kurkure U, Avila-Montes OC, Kakadiaris IA. 2008. Automated segmentation of thoracic aorta in non-contrast CT images. Proceedings of the 5th IEEE International Symposium on Biomedical Imaging: From Nano to Macro (ISBI 2008), Paris, France, May 2008. pp 29–32