
 ?Mathematical formulae have been encoded as MathML and are displayed in this HTML version using MathJax in order to improve their display. Uncheck the box to turn MathJax off. This feature requires Javascript. Click on a formula to zoom.
ABSTRACT
Background: There is strong evidence about the effectiveness of Active Support. Recent research has established predictors of good Active Support as staff training, practice leadership, and service setting size. This paper explores features of organisational leadership and structures predictive of Active Support.
Methods: Multilevel modelling with data from surveys, observations and interviews was used to identify predictors of Active Support at the levels of service users (n = 253), services (n = 71) and organisations (n = 14).
Results: Good Active Support was predicted by: (1) positive staff perceptions of management, (2) prioritisation of practice and Active Support by senior managers, (3) strong management support for practice leadership, (4) organisation of practice leadership close to everyday service delivery, and (5) concentration of practice leadership with frontline management.
Conclusion: These findings extend understanding of predictors of Active Support and provide indicators of service quality, with important implications for service providers, service users and those monitoring the quality of services.
Australia is experiencing a unique period of disability service reform. Unlike the United Kingdom (UK) and other European countries, since 2013, there have been an unprecedented expansion of funding to support the social and economic participation of an estimated 480,000 people with severe disabilities (Miller & Hayward, Citation2017). The Australian National Disability Insurance Scheme (NDIS) provides individual funding for “reasonable and necessary” disability supports to eligible participants, as well as grant funding for capacity building initiatives (NDIS, Citation2013, Section 34). While it aligns closely with neo-liberal welfare state reforms characterised by marketisation and individualised funding, the NDIS goes much further than other schemes (Carey, Malbon, Olney, & Reeders, Citation2018). Unlike the UK, there is no centralised or local planning or commissioning of services; this function rests with the market and decisions of each individual through expenditure of funds within parameters of their plan. Unlike the Scandinavian countries, where small subgroups of people receive individualised funding, there is no opt in: individualised funding applies to all eligible participants across all States and Territories in Australia and there is no block funding of disability services.
People with intellectual disabilities face considerable challenges exercising the consumer power that underpins individualised funding systems, such as the NDIS (Churchill, Sotiri, & Rowe, Citation2017; O’Connor, Citation2014). One of these challenges is service choice, especially given the significant variability in quality across supported accommodation services (Bigby, Bould, & Beadle-Brown, Citation2019). Evidence-based indicators of service quality are one means of better equipping people with intellectual disabilities, their families or advocates to navigate service marketplaces.
Service quality indicators are also central for organisations responsible for regulating marketised service systems, such as the NDIS Quality and Safeguard Commission (Commonwealth of Australia, Citation2018) and UK Care Quality Commission (Key Lines of Enquiry Citationu.d). However, quality indicators used by organisations such as these are often high level and generic, rather than tailored to reflect evidence relevant to particular groups of service users or types of service. People with intellectual disabilities are the largest group of adult participants in the NDIS, making up the majority of approximately 17,000 people with disabilities in supported accommodation services in Australia (NDIS, Citation2019). If service quality indicators are to be of value to this group, abstract concepts, such as person-centred practice, found in the NDIS Commission’s quality indicators, need to be translated into evidence-based behavioural expectations of good practice in supported accommodation services and descriptions of the organisational priorities, structures and processes necessary to deliver good practice.
Consistent use of Person-Centred Active Support (Active Support) is the most well-researched predictor of quality in supported accommodation services for people with intellectual disabilities (Bigby & Beadle-Brown, Citation2018). Active Support is a practice whereby staff use an enabling relationship to facilitate the engagement of people with intellectual disabilities in meaningful activities and social relationships (Mansell & Beadle-Brown, Citation2012). Based on theories of behaviour and communication, consistent use of Active Support significantly increases service user engagement, choice and control (Flynn et al., Citation2018). Active Support dovetails with the coherent, enabling, motivating and respectful cultures found in high performing services (Bigby & Beadle-Brown, Citation2016). Active Support also complements Positive Behaviour Support (PBS), providing the foundation for proactive strategies through targeting support that increases engagement and reduces reliance on challenging behaviour to gain choice and control (Ockenden, Ashman, & Beadle-Brown, Citation2014). Clear behavioural indicators of good Active Support practice are incorporated into research tools (Mansell, Elliott, & Beadle-Brown, Citation2005) and training materials (see e.g., Murphy, Bradshaw, & Beadle-Brown, Citation2017; Every Moment Has Potential).
Though widely adopted by disability services in Australia, Active Support has been difficult to embed in services (Flynn et al., Citation2018; Mansell & Beadle-Brown, Citation2012). Researchers have sought to identify predictors of good Active Support at the organisational, service and individual levels both to inform service design and provide indicators of service quality to support the exercise of choice by consumers and the work of service regulators. Flynn et al. (Citation2018), in a review of 10 studies, found the strongest evidence about predictors of Active Support was in respect to training (classroom combined with in-situ methods), relatively low staff-to-service user ratios and larger services (maximum of six service users), and management processes, such as team meetings. More recently, a large Australian study that applied multi-level modelling found predictors of good Active Support were the individuals’ adaptive behaviour, strength of frontline practice leadership, staff training in Active Support, and time since Active Support was implemented (Bigby, Bould, Iacono, Kavangh, & Beadle-Brown, Citation2019a). Similar predictors were found in a study of increases in the quality of Active Support over time, which included repeated measures from the same 51 services in eight organisations over periods of two to seven years (Bould, Bigby, Iacono, & Beadle-Brown, Citation2019). Predictors of Active Support in these studies were predominantly characteristics at the level of the individual or service rather than organisation. Despite propositions about the importance of organisational level factors, such as commitment from senior managers, organisational readiness, and relevant policies and structures (Qian, Tichá, & Stancliffe, Citation2017; Mansell & Beadle-Brown, Citation2012), there is a dearth of evidence about them (Bigby & Beadle-Brown, Citation2018; Flynn et al., Citation2018). Qian et al. (Citation2017) suggested one of the reasons for such limited evidence at this level was that organisational factors relevant to services in the disability sector had not been sufficiently well conceptualised or operationalised to enable measurement.
A qualitative analysis of interviews with senior leaders from 14 Australian disability organisations, which had adopted Active Support, identified four features of organisational management and structures (management features) that were common to the six of these organisations that delivered good Active Support to the majority of service user in 71% or more of their services (Bigby, Bould, Iacono, & Beadle-Brown, Citation2019b). These features were senior leaders who shared prioritisation of practice and Active Support and strongly supported practice leadership, and practice leadership organised close to every-day service delivery and concentrated in one position with frontline management. provides definitions for each of these features. Bigby et al. (Citation2019b) suggested the potential to statistically test whether the presence of these four features, along with other variables, were predictive of good Active Support, singly or in combination. Accordingly, the aim of the present study was to further explore predictors of good Active Support by including, in a multi-level model (MLM), results reported by Bigby et al. (Citation2019b) about the presence or absence of the four organisational management features in 14 organisations, together with other individual and service level data for these organisations,
Table 1. Organisational management features.
Method
Design
This study was a cross-sectional design. Data were collected over the period of February 2017 to January 2018 from a cohort of services provided by 14 organisations. These data were in the form of surveys completed by staff about their own characteristics and work experiences, surveys completed by staff about service user characteristics, observations of service users, staff practice and practice leadership and interviews with practice leaders. Also included were the data on the organisational management features of each of these organisations reported by Bigby et al. (Citation2019b).
Ethical considerations
The study received ethical approval from the La Trobe University Human Research Ethics Committee (HREC). Consent was obtained directly from staff and service users, or their proxy for those without capacity for consent, as approved by the HREC.
Participants and settings
As shows, the number of services managed by each organisation varied from 5 to 34, the time since they first adopted Active Support varied from 1 to 15 years, and six had an annual turnover above $50 million. The 14 organisations managed a total of 272 services, supporting a total of 1112 service users. shows the total number of services, service users and staff who participated from each organisation. The sample of 253 service users from 71 services were selected for representativeness on the basis of service user age, gender, adaptive behaviour, challenging behaviour, social impairment, physical disability and presence of autism. Comparisons between the selected and non-selected samples were conducted using Mann–Whitney U and chi-square. As shows, there were no significant differences on any of these attributes (p < .01 level).
Table 2. Key characteristics of the 14 participating organisations
Table 3. Number of services, consenting service users (SUs), staff surveys and practice leadership interviews from each organisation included in the analysis.
Table 4. Comparison of the characteristics of the selected and non-selected service user samples.
Measure of the predicted variable – quality of active support
The quality of Active Support was determined using the Active Support Measure (ASM) (Mansell et al., Citation2005). This measure has been reported to have acceptable reliability and validity, and in most studies a Cronbach Alpha over 0.9 has been reported (see e.g., Beadle-Brown, Hutchinson, & Whelton, Citation2012; Mansell, Beadle-Brown, Macdonald, & Ashman, Citation2003). The ASM is completed for each consenting service user after 2-hours of observation, conducted between the hours of 4:00 and 6:00 pm. Each of 15 items addresses the quality of staff support to individual service users to enable them to be engaged in meaningful activities and relationships. The measure is completed according to guidelines provided by Mansell et al. (Citation2005), with each item rated according to a scale anchored by 0 (poor, inconsistent support) and 3 (good, consistent support) to yield a maximum score of 45. If challenging behaviour has not been observed, it is scored as “not applicable,” resulting in the omission of two items and a maximum possible score of 39. Scores are then converted to a percentage, with a score over 66.66% designated as the threshold score indicative of a good level of Active Support (Mansell & Beadle-Brown, Citation2012).
Four observers were trained in the ASM by the second author using video material, then the ASM was completed at least twice alongside the second author in a service before collecting data alone. An average of 87% (range 69%–100%, n = 26) agreement and kappa of .73 (range .53–.100) were obtained across observers. In light of the low agreement for some ASM items, paired t-tests were performed for overall scores obtained across observers, which indicated that any differences did not reach significance (p = .271).
Measures of the predictor variables
Predictor variables included service user level factors (service user characteristics – gender, age, adaptive behaviour, aberrant behaviour and social impairment), 10 service level factors (staff-to-resident ratio, staff training, satisfaction, role clarity, perception of practice leadership, perception of quality of management, attitudes towards people with intellectual disabilities, observed measure of practice leadership, number of residents and their heterogeneity) and eight organisation level factors (presence or absence of the four organisational management features from Bigby et al. (Citation2019b) (see ); number of services managed, total number of service users, time since adoption of Active Support, and annual revenue turnover).
Service user characteristics questionnaire. Data about each service user were obtained from a staff-completed questionnaire. Items related to gender, date of birth, and other disabilities present. The questionnaire incorporated the Adaptive Behavior Scale (SABS) Part 1 (Hatton et al., Citation2001), the Aberrant Behavior Checklist (ABC) (Aman, Burrow, & Wolford, Citation1995) and the Quality of Social Impairment question from the Schedule of Handicaps Behaviours and Skills (HBS) (Wing & Gould, Citation1978). Authors of these measures have reported them to have acceptable reliability and validity.
Staff-to-resident ratio. A proforma completed by the observer (at the time of the ASM) was used to record the numbers of residents present and staff on duty during the 2-hour observation. The staff-to-resident ratio, a service level factor, was determined by dividing the number of staff by the number of residents.
Staff experiences and satisfaction survey. Staff in each service completed an adapted version of the Staff Experiences and Satisfaction Questionnaire (SESQ) (Beadle-Brown, Gifford, & Mansell, Citation2005). It includes three sections: (1) demographics and training; (2) experiences at work – satisfaction, role clarity and conflict, and perception of practice leadership and quality of management; and (3) a shortened 13-item version of the original Section D scale looking at attitudes towards people with intellectual disabilities. All scales along with their reliability and validity are described in detail in Mansell, Beadle-Brown, Whelton, Beckett, and Hutchinson (Citation2008, pp. 401–402). Based on a large-scale evaluation involving 550 staff, the 13-item attitude scale was shown to have a Cronbach’s alpha of 0.856 (Mansell et al., Citation2008)
The Observed Measure of Practice Leadership. The quality of practice leadership in the service was measured using the Observed Measure of Practice Leadership (Beadle-Brown, Bigby, & Bould, Citation2015). Across several studies, this has been shown to be a valid and reliable measure, with good internal consistency (Cronbach Alpha over 0.9), acceptable inter-rater reliability (Kappa value over 0.6 on average across the five domains) and good construct validity in terms of discriminatory power for the predictor variable (the ASM) – better practice leadership was consistently associated with higher levels of active support (t (171) = 3.88, p < 0.001; in Beadle-Brown et al., Citation2015). An observer made an additional visit to the service, or one of the services supervised by a practice leader, for a 10–30 min observation, followed by an interview with the practice leader (approximately 1 h) and review of the paperwork associated with practice leadership, such as staff work allocation and team meeting minutes. The observer used these data to score five core aspects of practice leadership: (1) overall focus on service users’ quality of life (QoL); (2) allocating and organising staff to provide the support needed by service users to maximise their quality of life; (3) coaching, observing, modelling and giving feedback to staff about the quality of their support; (4) reviewing performance with individual staff during supervision; and (5) reviewing team performance in team meetings. Rating of each element was based on a 5-point scale, anchored by 1 (no or almost no evidence of the element being in place) and 5 (element was consistently in place). Scores were tallied across elements and divided by 5 to yield a mean score indicative of the overall strength of practice leadership provided by the service’s frontline manager.
Organisational management features. The data from findings reported by Bigby et al. (Citation2019b) on the presence or absence of four organisational management features which are reproduced in were used. Based on the presence (score of 1) or absence (score of 0) of each feature in each organisation, an organisational total score was calculated to yield a maximum score of 4 across the four items: (1) shared prioritisation of practice and Active Support by senior leaders (2) senior leaders strongly supporting practice leadership, (3) organisation of practice leadership close to every-day service delivery, and (4) concentration of practice leadership and front-line management tasks.
Table 5. Organisational management features across the 14 organisations (adapted from Bigby et al., Citation2019b).
Organisational size, turnover and time since adopting Active Support. Data were collected from each organisation on the number of services managed, total service users supported, time since adoption of Active Support, and annual turnover.
Procedure
An audit questionnaire was completed within each service for all service users for the purposes of selecting a sample, and ascertaining the total number of services managed and service users supported by each organisation. The audit questionnaire was combined with the service user characteristics questionnaire into one package. For each organisation, an audit database was created and sent to a contact person, with instructions to (1) complete the coding of service users identified within the database; (2) distribute questionnaires for all service users in the organisation, with requests for a staff member who knew the individual well to complete and return to the contact person; (3) remove the service user name on each questionnaire and leave only a unique code from the database; and (4) return completed audit questionnaires to the research team in the pre-paid envelopes provided. Participation in the study was dependant on completion of this audit for all service users with intellectual disability.
Once staff consent was gained, staff questionnaires were mailed to supervisory and managerial staff associated with each service, who were asked to give a copy to each consenting member of staff. Completed staff questionnaires were returned directly to the researchers by mail using a pre-paid envelope.
An observer then visited each service to conduct the 2-hour observation and complete the ASM for each consenting service user. On another day, an observer visited the service to complete the Observed Measure of Practice Leadership. Hence, two visits were made to each service, within 2–4 months, except for services that shared a practice leader, in which case only one visit was made across these services for the observed measure of practice leadership.
Analysis
Data were entered into IBM SPSS 24. The criterion for inclusion of data in the analysis was a minimum of three staff questionnaires returned for a service. Descriptive statistics and correlational analyses were conducted to examine relationships among predictors, with Cohen’s (Citation1988) guidelines applied for effect sizes.
For the purpose of the MLM, data were organised across service user, service, and organisation levels. Service user level scores were the ASM percentage score, and the full-scale score for Part 1 of the Adaptive Behaviour Scale (ABS) was estimated from the SABS using the method described by Hatton et al. (Citation2001). Service users were initially categorised into two groups: below 151 and 151 and above, a cut off used in other studies to indicate service users with more or less severe disability (see Mansell, Beadle-Brown, & Bigby, Citation2013). However, preliminary analysis indicated that all people supported by one organisation had an ABS of 80 or less, therefore the ability grouping was revised to include ABS scores of less than 80, 81–150 or 151 and above. These ABS groups were aggregated to the service level to represent the number of ABS groups supported by a service: for example, in a service with four service users, the number of ABS groups was two if three service users were in the less than 80 ABS category and one service user was in the 81–150 category. Other service level scores were the Observed Measure of Practice Leadership mean for each frontline manager and staff-to-resident ratios during the 2-hour observation. The unique codes provided from organisations using the audit database were used to ascertain the total number of service users in each service, which were grouped into two categories: 1–6 and 7+, a cut off based on studies by Tøssebro (Citation1995) and Flynn et al. (Citation2018). The aggregated data for size of setting, ability group, and practice leadership score were assigned to all the individual service users within the same service(s).
For the staff questionnaires, data were included in the analysis only if at least three staff surveys were returned for a service. Individual staff data on attitudes towards people with intellectual disabilities, perception of practice leadership, quality of senior management, role clarity and conflict, job satisfaction, and training in Active Support were aggregated to the service level through a mean score for each service, and subsequently assigned to all the individual service users within the same service.
Finally, the unique codes provided from organisations using the audit database were used to ascertain the total number of services and service users supported by the organisation. The annual turnover was grouped into greater (>) or less than (<) $50 million, and these data, along with the total score for presence of the four organisational management features taken from Bigby et al. (Citation2019b), and number of years implementing Active Support were aggregated at the organisational level. These scores were subsequently assigned to all individual service users within the same organisation. Due to missing data, 16 services and 54 service users were excluded from the final analysis. The data structure for the MLM, which took into account the clustering, was 253 individual service users (level 1) nested within 71 supported accommodation services (level 2) from 14 organisations (level 3). The MLwiN program (Version 3.02; Charlton, Rasbash, Browne, Healy, & Cameron, Citation2017) was used for the MLM analysis. The Deviance Information Criterion (DIC) (Spiegelhalter, Best, Garlin, & van der Linde, Citation2002) statistics for model comparison was calculated using the Markov chain Monte Carlo (MCMC) (Browne, Citation2017) estimation, given the size and structure of the data set that required partitioning of the variance at three levels (Rodriguez, Citation2007). Any decrease in the goodness of fit diagnostic, DIC, suggests a better model. All models were estimated using non-informative priors (Browne, Citation2004) with a burn-on of 1000 and 20,000 iterations.
An initial null model was estimated, which also computed an intraclass correlation coefficient (ICC): that is, the proportion of the total residual variance attributable to differences between groups, referred to as the variance partition coefficient (VPC) (Goldstein, Citation2003). The formula for calculating the VPC is the ratio of the variance at each level to the total variance. Subsequently, a series of multi-level models were built using a bottom up approach (Hox, Citation2010; Raudenbush & Bryk, Citation2002). The fully adjusted model was:
In this model, i refers to the service user, j the supported accommodation service, and k the organisation. βijk refers to the grand mean (i.e., average Active Support score of the 253 service users from 71 services from the 14 organisations) and eijk refers to a random effect.
Results were deemed significant if the estimates were more than twice their estimated empirical standard error. All predictors were grand mean centred (i.e., the intercept was centred around the mean of the sample) to facilitate the interpretation of the intercepts and slopes, and because of primary interest was the influence at the higher levels of service and organisation factors (Enders & Tofighi, Citation2007).
Results
provides descriptive statistics for the service users (n = 253). Inspection of this table shows that they varied in terms of their characteristics and support needs. On average, the sample was relatively able compared to participant samples in other studies of Active Support (Mansell et al., Citation2013).
provides the spearman correlations (at the service user level) used to examine relationships among predictors included in the final model. The largest correlation with the ASM was the level of adaptive behaviour (ρ = .432, n = 253, p < .001), with a medium effect size (Cohen, Citation1988). Small to medium correlations were found between the organisational management features, determined by tallying across the number of features present for each organisation (, with a total possible score of 4) and each of the ASM, ABS, mean practice leadership and the service size ().
Table 6. Spearman correlations between predictor variables.
Other service user level data, such as socio-demographic or degree of social impairment, were not significantly correlated with the ASM. Other factors not found to correlate significantly with the ASM were service level data, including the number and heterogeneity of service users, staff-service user ratios, staff qualifications and attitudes, and organisational level data about characteristics, such as size, turnover and years implementing Active Support. Hence, these factors were not found to be predictors in the model.
presents the modelling results as parameter (beta) coefficients and their standard errors, along with the model-fitted diagnostic DIC. Model 1 is the null, which includes no predictor variables, and the VPC indicated 8% of the variance in the ASM scores were accounted for by differences between organisations, 60% by differences between the supported accommodation services, and 32% by within individual service user differences. In Model 2, individual predictors were included, and only one predictor (ABS) was significant, indicating that individuals with greater adaptive behaviour received better quality of support as measured on the ASM. No other service user measures contributed to the model. Model 3 included variables associated with the service; services with higher practice leadership scores and a more positive perception of management by staff were associated with higher ASM scores. Conversely, services with 7+ service users were associated with lower ASM scores. No other service level variables contributed to the model. Model 4 allowed for examination of variables associated with the organisation. Inclusion of the score on organisational management features led to a further improvement in the model-fitted diagnostic DIC. No other organisation level variable contributed to the model.
Table 7. Parameter (beta) estimates of the multi-level models and deviance information criterion (MCMC).
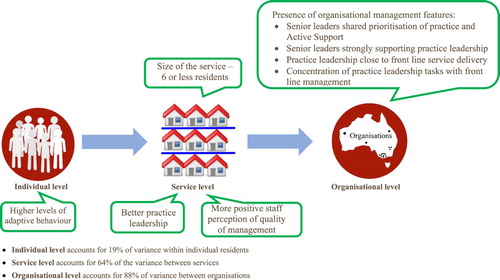
Although there remained significant variance at each of the three levels, as indicated in , the predictors included in Model 4 accounted for 88% of the between organisation variance, 64% of the between service variance, and 19% of the within individual service user variance.
Figure 1. Predictors of good active support.
Discussion
Extending findings from an earlier study, the present study demonstrated statistically, that combined, the four organisational management features identified by Bigby et al. (Citation2019b) were predictors of the quality of Active Support. These features were senior leaders’ shared prioritisation of practice and Active Support, strong support for practice leadership by senior leaders, the organisation of practice leadership close to every-day service delivery and concentrated in one position with frontline management (). For this study, the presence or absence of each of these features in an organisation was derived from interviews with senior organisational leaders previously reported in Bigby et al. (Citation2019b). The present study has also confirmed findings from two earlier studies that good Active Support is predicted, at the individual level, by higher adaptive behaviour of service users, and, at the service level, by stronger practice leadership, and having six or fewer service users in a service (Bigby et al., Citation2019a; Bould et al., Citation2019). In addition, staff with a more positive perception of the quality of management was also predictive of good Active Support.
Somewhat unexpectedly, factors predictive of Active Support in previous studies drawn from overlapping data sets (Bigby et al., Citation2019a; Bould et al., Citation2019) were not predictive in this study: these were whether or not staff had been trained in Active Support and homogeneity of service users (the number of ABS groups represented within a service) at the service level, and organisational size and time since adopting Active Support, at the organisational level. The limited variability in this data set, compared to the two earlier ones, provides the most plausible explanations for these differences. Unlike in the previous studies (Bigby et al., Citation2019a; Bould et al., Citation2019), data were collected at one rather than multiple time points, and at a time when all organisations had been implementing Active Support and monitoring progress annually over a number of years.
This maturity in implementing Active Support may account for the high percentage of staff (82%) having been trained in Active Support in the cohort of organisations in the present study. In contrast, there was greater variability in training of staff across the organisations at the varied time points captured in the studies reported by Bigby et al. (Citation2019a) and Bould et al., (Citation2019). The findings of these two previous studies, together with those of earlier ones point strongly to the importance of Active Support training and its nature to the implementation of Active Support (Flynn et al., Citation2018). It would seem that variability in the number of staff with Active Support training will influence the quality of support provided, but only to a point, after which, it no longer has predictive influence. What that threshold point might be could not be determined from the present study, but the failure of this variable to predict Active Support quality suggests it was at least met, if not exceeded at the point of which 82% of staff had been trained.
Similarly, the absence of an association between homogeneity of service user needs in a service and the quality of Active Support in the present study may be accounted for by the fact that only 13 of the 71 services included service users who fell into three different ABS groups. There was greater variability in the data for this item in Bigby et al. (Citation2019a) and Bould et al. (Citation2019), in that the heterogeneity among service users was found to be associated with poor quality Active Support. Combined, the findings from the three studies suggests complementary evidence: that heterogeneity of service user support needs detracts from the provision of Active Support quality, while homogeneity removes this factor as an influence.
A further factor found predictive of Active Support in the previous studies Bigby et al., (Citation2019a) and Bould et al., (Citation2019), but not the present study, was time since implementing Active Support. Again, variability in these data evident in the previous studies was not found in this study, reflecting the fact that most organisations (n = 9) had been implementing Active Support for more than five years. This longer time of implementation may also account for the absence of an association between organisational size and quality of Active Support found by Bould et al., (Citation2019). It is likely to take larger organisations longer than smaller ones to successfully implement Active Support. It may have been the relatively early success of smaller organisations in a short time period that was identified in the earlier studies (Bigby et al., Citation2019a), which disappeared as Active Support became embedded over longer periods.
A tentative hypothesis from the present study that is worthy of further investigation is that advantages of smaller organisations dissipate over time, and that, for larger organisations, a period of five years may be required to successfully implement and embed Active Support. It may also be that after five years, other organisational level factors confound the impact of time. For example, the qualitative data reported by Bigby et al., (Citation2019b) indicates that disruption to the processes of implementation may result from changes to senior personnel or competing organisational priorities emanating from external factors. This proposition is supported by findings in earlier studies by Mansell and colleagues (Citation2008, Citation2013) of low levels of good Active Support in organisations that had been implementing it for more than five years. They demonstrate the likely interaction between time since implementing Active Support, and other organisational or service level factors in achieving good support.
Implications for practice
The findings from the present study together with earlier studies of Active Support (Flynn et al., Citation2018; Bigby et al., Citation2019a; Bould et al., Citation2019; Bigby et al., Citation2019b) suggest the following features at the service and organisational levels are predictors of good Active Support: (1) staff trained in Active Support using classroom and in-situ methods; (2) strong practice leadership of individual direct support workers and their team through regular coaching, observation and feedback about their practice, discussion of Active Support in team meetings and individual supervision, shift planning, and support to maintain focus on the quality of life of the people they support as core to everything they do; (3) practice leadership structured so leaders are close to every-day practice, and their tasks are not split across different positions; (4) staff having confidence in the management of the organisation; (5) services not supporting more than six people under one roof; (6) people sharing accommodation having support needs that are not too different, and not all having challenging behaviour; and (7) senior leaders having a shared understanding of Active Support, and recognising and valuing high-quality practice. These features provide a blueprint for the design of services committed to delivering quality Active Support.
The definitions of each of these predictors and associated research measures could be translated into a set of evidence-based indicators of conditions, at the service and organisational levels, that are necessary for delivery of good quality Active Support. Indicators could be tailored to different audiences: consumers of services to assist in choice, the Commission to assist in service registration, and auditors or Commission for inspecting or monitoring services. Quality indicators of the nature described would build on, for example, the “What does good look like” checklist (Beadle-Brown & Ashman, Citation2016), with the resulting tool tested for reliability against research measures, such as the Active Support Measure. Importantly, however, this type of quality indicator is once removed from actual practice, and should not replace regular observation of frontline practice by supervisors and practice leaders, using a tool that is easy to complete in a practice context.
Conclusion
Active Support is one of few areas in disability practice with not only an evidence base but in which predictive factors have been explored internationally. This evidence provides behavioural indicators of good Active Support practice, benchmarks of good practice, and practice guidelines. The present study has contributed further evidence to support the development of a set of indicators of factors at the service and organisational levels necessary for delivery of good Active support.
Acknowledgements
Thanks are extended to the disability services participating in this study, and to research assistants Louise Phillips, Samuel Murray, Emma Caruana, Lincoln Humphreys, Rosa Solá Molina and Andrew Westle for support with data collection.
Disclosure statement
No potential conflict of interest was reported by the authors.
Additional information
Funding
References
- Aman, M. G., Burrow, W. H., & Wolford, P. L. (1995). The aberrant behavior checklist – Community: Factor validity and effect of subject variables for adults in group homes. American Journal on Mental Retardation, 100, 283–292.
- Beadle-Brown, J. & Ashman, B. (2016). What does good look like? A guide for observing in services for people with learning disabilities and/or autism. Retrieved from https://kar.kent.ac.uk/61874/1/What_does_good_look_like-Nov.pdf
- Beadle-Brown, J., Bigby, C., & Bould, E. (2015). Observing practice leadership in intellectual disability services. Journal of Intellectual Disability Research, 59, 1081–1093. doi: 10.1111/jir.12208
- Beadle-Brown, J., Gifford, J., & Mansell, J. (2005). Staff experience and satisfaction questionnaire (Learning disability). Canterbury: Tizard Centre.
- Beadle-Brown, J., Hutchinson, A., & Whelton, B. (2012). Person-centred active support – increasing choice, promoting independence and reducing challenging behaviour. Journal of Applied Research in Intellectual Disabilities, 25, 291–307. doi: 10.1111/j.1468-3148.2011.00666.x
- Bigby, C., & Beadle-Brown, J. (2016). Culture in better group homes for people with severe and profound intellectual disability. Intellectual and Developmental Disabilities, 54, 316–331. http://www.aaiddjournals.org/doi/pdf/10.1352/1934-9556-54.5.316
- Bigby, C., & Beadle-Brown, J. (2018). Improving quality of life outcomes in supported accommodation for people with intellectual disability: What makes a difference? Journal of Applied Research in Intellectual Disabilities, 31, e182–e2000. doi: 10.1111/jar.12291
- Bigby, C., Bould, E., & Beadle-Brown, J. (2019). Implementation of active support over time in Australia. Journal of Intellectual and Developmental Disability, 44, 161–173. doi: 10.3109/13668250.2017.1353681
- Bigby, C., Bould, E., Iacono, T., Kavangh, S., & Beadle-Brown, J. (2019a). Factors that predict good Active Support in services for people with intellectual disabilities: A multilevel model. Journal of Applied Research in Intellectual Disabilities. doi: 10.1111/jar.12675
- Bigby, C., Bould, E., Iacono, T., & Beadle-Brown, J. (2019b). What matters at the organisational level for the quality of practice in supported accommodation services for people with intellectual disabilities. Journal of Intellectual and Developmental Disability. doi: 10.3109/13668250.2019.1671965
- Bould, E., Bigby, C., Iacono, T., & Beadle-Brown, J. (2019). Factors associated with increases over time in the quality of active support in supported accommodation services for people with intellectual disabilities: A multilevel model. Research in Developmental Disabilities, 94, doi:10.1016/j.ridd.2019.103477.
- Browne, W. J. (2004). An illustration of the use of reparameterisation methods for improving MCMC efficiency in crossed random effects models. Multilevel Modelling Newsletter, 16(1), 13–25.
- Browne, W. J. (2017). MCMC estimation in MLwiN v3.00. Bristol: Centre for Multilevel Modelling, University of Bristol.
- Care Quality Commission. (u.d). Key lines of enquiry, prompts and ratings characteristics for adult social care services. Retrieved from https://www.cqc.org.uk/sites/default/files/20171020-adult-social-care-kloes-prompts-and-characteristics-final.pdf
- Carey, G., Malbon, E., Olney, S., & Reeders, D. (2018). The personalisation agenda: The case of the Australian National disability Insurance Scheme. International Review of Sociology, 28, 20–34. doi:10.1080/03906701.2018.1425084.
- Charlton, C., Rasbash, J., Browne, W. J., Healy, M., & Cameron, B. (2017). MLwin version 3.02. Bristol: Centre for Multilevel Modelling, University of Bristol.
- Churchill, A., Sotiri, M., & Rowe, S. (2017). Access to the NDIS for people with cognitive disability and complex needs who are in contact with the criminal justice system: Key challenges. Sydney: The Community Restorative Centre.
- Cohen, J. (1988). Statistical power analysis for the behavioral sciences (2nd ed.). Hillsdale, NJ: Erlbaum.
- Commonwealth of Australia. (2018). National disability insurance scheme (quality indicators) guidelines. Canberra: Author.
- Enders, C. K., & Tofighi, D. (2007). Centering predictor variables in cross-sectional multilevel models: A new look at an old issue. Psychological Methods, 12, 121–138. doi: 10.1037/1082-989X.12.2.121
- Every Moment Has Potential: Person Centred Active Support Practice in Australia. Published by Department of Industry, Greystanes Disability Services, and Living with Disability Research Centre at La Trobe University. ISBN: 978-0-9804865-6-8 (e-book). Retrieved from http://www.activesupportresource.net.au/
- Flynn, S., Totsika, V., Hastings, R. P., Hood, K., Toogood, S., & Felce, D. (2018). Effectiveness of Active Support for adults with intellectual disability in residential settings: Systematic review and meta-analysis. Journal of Applied Research in Intellectual Disabilities, 31, 983–998. doi: 10.1111/jar.12491
- Goldstein, H. (2003). Multilevel statistical models (3rd ed.). London: Arnold.
- Hatton, C., Emerson, E., Robertson, J., Gregory, N., Kessissoglou, S., Perry, J., … Hillery, J. (2001). The adaptive behavior scale–residential and community (part I): towards the development of a short form. Research in Developmental Disabilities, 22, 273–288. doi: 10.1016/S0891-4222(01)00072-5
- Hox, J. J. (2010). Multilevel analysis: Techniques and applications (2nd ed.). New York: Routledge.
- Mansell, J., & Beadle-Brown, J. (2012). Active support: Enabling and empowering people with intellectual disabilities. London: Jessica Kingsley.
- Mansell, J., Beadle-Brown, J., & Bigby, C. (2013). Implementation of active support in Victoria, Australia: An exploratory study. Journal of Intellectual & Developmental Disability, 38, 48–58. doi:10.3109/13668250.2012.753996.
- Mansell, J., Beadle-Brown, J., Macdonald, S., & Ashman, B. (2003). Resident involvement in activity in small community homes for people with learning disabilities. Journal of Applied Research in Intellectual Disabilities, 16, 63–74. doi: 10.1046/j.1468-3148.2003.00146.x
- Mansell, J., Beadle-Brown, J., Whelton, R., Beckett, C., & Hutchinson, A. (2008). Effect of service structure and organisation on staff care practices in small community homes for people with intellectual disabilities. Journal of Applied Research in Intellectual Disabilities, 21, 398–413. doi: 10.1111/j.1468-3148.2007.00410.x
- Mansell, J., Elliott, T. E., & Beadle-Brown, J. (2005). Active support measure (revised). Canterbury: Tizard Centre.
- Miller, P., & Hayward, D. (2017). Social policy ‘generosity’ at a time of fiscal austerity: The strange case of Australia’s National disability Insurance Scheme. Critical Social Policy, 37, 128–147. doi:10.1177/0261018316664463l doi: 10.1177/0261018316664463
- Murphy, B., Bradshaw, J., & Beadle-Brown, J. (2017). Person-centred Active Support training Pack (2nd ed.). West Sussex: Pavilion Press.
- National Disability Insurance Agency. (2019). COAG Disability Reform Council, Quarterly Report. Retrieved from https://www.ndis.gov.au/about-us/publications/quarterly-reports
- National Disability Insurance Scheme Act. (2013). An Act to establish the National Disability Insurance Scheme, and for related purposes. Retrieved from https://www.legislation.gov.au/Details/C2013A00020
- Ockenden, J., Ashman, B., & Beadle-Brown, J. (2014). Active support – Fundamental to positive behaviour support. Research and Practice in Intellectual and Developmental Disabilities, 1, 98–107. doi:10.1080/23297018.2014.961528.
- O’Connor, M. (2014). The national disability insurance scheme and people with mild intellectual disability: potential pitfalls for consideration. Research and Practice in Intellectual and Developmental Disabilities, 1(1), 17–23. doi:10.1080/23297018.2014.908815.
- Qian, X., Tichá, R., & Stancliffe, R. J. (2017). Contextual factors associated with implementing active support in community group homes in the United States: A qualitative investigation. Journal of Policy and Practice in Intellectual Disabilities, 14, 332–340. doi: 10.1111/jppi.12204
- Raudenbush, S. W., & Bryk, A. S. (2002). Hierarchical linear models: Applications and data analysis methods (2nd ed.). Thousand Oaks, CA. Sage.
- Rodriguez, G. (2007). Multilevel generalized linear models. Chapter 9. In J. De Leeuw & E. Meijer (Eds.), Handbook of multilevel analysis (pp. 335–376). New York: Springer.
- Spiegelhalter, D. J., Best, N. G., Garlin, B. P., & van der Linde, A. (2002). Bayesian measures of model complexity and fit (with discussion and rejoinder). Journal of the Royal Statistical Society: Series B, 64, 583–639. doi: 10.1111/1467-9868.00353
- Tøssebro, J. (1995). Impact of size revisited: Relation of number of residents to self-determination and deprivatization. American Journal on Mental Retardation, 100, 59–67.
- Wing, L., & Gould, J. (1978). Systematic recording of behaviors and skills of retarded and psychotic children. Journal of Autism and Childhood Schizophrenia, 8, 79–97. doi: 10.1007/BF01550280