Abstract
Context: Neolignans are usually dimers formed by oxidative coupling of allyl and propenyl phenols, and the neolignan analogue, 2-phenoxy-1-phenylethanone (LS-2) is a promising antimycobacterial compound showing very weak cytotoxicity in mammalian cells and lack of acute toxicity in murine models.
Objectives: To investigate the mechanism of action of LS-2 in rat hepatocytes by evaluating the activity levels of enzymes related to oxidation status and drug-metabolizing activity.
Materials and methods: Hepatocytes were treated with LS-2 from 0.05 up to 1 mM, for 24 and 48 h, and reduced glutathione (GSH), lipid peroxidation and cytochrome P450 enzyme (CYP450) activity were assayed. A homologous series of phenoxazone ethers were used as substrates to measure the enzymatic profile. The biotransformation of LS-2 was studied in hepatocytes by gas chromatography-mass spectrometry (GC-MS) for detection and analysis of possible metabolites.
Results: Hepatocytes treated with LS-2 up to 1 mM for 24 or 48 h did not induce the formation of GSH and lipid peroxidation. O-Dealkylation activities of the isoenzymes CYP4501A1, CYP4501A2, CYP4502B1 and CYP4502B2 were also not detected in the hepatocytes treated with LS-2 for 24 or 48 h.
Discussion and conclusion: The results indicate that LS-2 or its two detected metabolites, 2-phenoxy-1-phenylethanol and 2,4-(2-hydroxy-2-phenylethoxy)phenol, are not cytotoxic to rat hepatocytes. These compounds maintain a balance between the production of pro-oxidant agents and their respective antioxidant systems. The data show that enzymes related to oxidation status and drug-metabolizing activities are not involved in the mechanism of action of LS-2.
Introduction
In the last years, there has been a decrease in investments in antibiotic research by the major pharmaceutical companies and, consequently, a decline in antibiotic discovery. This scenario has been challenged by the ever more rapid and frightening spread of antibiotic-resistant strains (CitationFischbach & Walsh, 2009; CitationBroetz-Oesterhelt & Sass, 2010).
Regarding these aspects, the literature describes the clinical demand for new antimicrobials to treat various infectious diseases, including tuberculosis. Recently, CitationDover & Coxon (2011) reported the current status and research strategies in tuberculosis drug development. According to the authors, new drugs must be active against drug-resistant forms of M. tuberculosis, which implies that they must act on different molecular targets compared to current drugs. As any new drug will certainly be part of a multidrug regime, it must utilize metabolic pathways unlike those of other drugs to avoid drug-drug interactions.
Natural products have been employed as a source of new molecules to treat infectious diseases caused by bacteria and fungi. The list of antibiotics discovered so far clearly indicates that between 25 and 50% of currently marketed drugs owe their origin to natural products (CitationKingston, 2011). Many drugs originated from microbial species, particularly in the anti-infective area, but plant-derived drugs have also made significant contributions.
Neolignans, which occur in the Myristicaceae and other primitive plant families, are usually dimers from oxidative coupling of allyl and propenyl phenols. Natural neolignans have been isolated from Virola surinamensis and found to be effective against Schistosoma mansoni (CitationBarata et al., 1978). In studies covering infectious diseases, neolignan analogues were synthesized (CitationBarata et al., 1978; CitationAveniente et al., 2007) and shown to have antimicrobial activity against Leishmania (CitationBarata et al., 2000), Schistosoma (CitationAlves et al., 2002), fungi (CitationLima et al., 1987) and Mycobacterium tuberculosis H37Rv (Citationde Souza et al., 2011). The most effective analogue, 2-phenoxy-1-phenylethanone (LS-2), showed promising extra- and intracellular antimycobacterial activity and very weak cytotoxicity against V79 cells, J774 macrophages and rat hepatocytes. Additionally, in mice, the lethal dose (LD50) was found to be high, i.e., 1.87 g/kg (Citationde Souza et al., 2011).
Cytotoxicity testing is a screening tool that typically uses cell lines for ranking acute toxicities of compounds based on alterations in cellular functions that are common to all mammalian cells (CitationBarile & Cardona, 1998). Several cell lines including metabolically competent cells, such as primary cultured hepatocytes, can be used to detect the biotransformation of molecules and generation of reactive or toxic metabolites (CitationGómez-Lechón et al., 2001). Xenobiotics can be bioactivated (mainly through phase I metabolism) and also detoxified via conjugation reactions (phase II metabolism). Considering these aspects, different cell lines are very useful to provide information about in vitro basal cytotoxicity, which correlates with acute toxicity in vivo (CitationDierickx, 2005), and furthermore, this information would help in determining the mechanism of toxicity, i.e., whether the adverse effect would be associated with the metabolism of the parent compounds. Primary cultured hepatocytes are widely used for in vitro investigation and as a screening tool to evaluate hepatic metabolism, cytochrome P450 (CYP450) induction or inhibition, and hepatotoxic potential of xenobiotics (CitationMingoia et al., 2007). This system is applied to the study of the uptake/excretion, intracellular target sites, morphologic/physiologic degeneration and temporal sequences leading to cell damage (CitationMoldéus et al., 1978; CitationNakagawa et al., 1995).
Considering the pronounced antimycobacterial activity and apparent lack of toxicity of LS-2, in this study, the enzyme activities related to oxidation status and drug-metabolizing activity were investigated in primary cultures of rat hepatocytes in order to understand the mechanism of action of this compound. Reduced glutathione (GSH), lipid peroxidation and cytochrome P450 enzyme activity (CYP450) were assayed after treatment of hepatocytes with LS-2 for 24 and 48 h. LS-2 biotransformation was also studied to determine the possible formation of secondary metabolites.
Materials and methods
The following chemical products were purchased from Sigma-Aldrich Co. (USA): 4-(2-hydroxyethyl)piperazine-1-ethanesulfonic acid (HEPES), Dulbecco’s Modified Eagle’s Medium (DMEM), collagenase type IV, tetraethoxypropane (TEP), reduced GSH, Tris-HCl, ethoxyresorufin (7ER), pentoxyresorufin (7PR), resorufin, dexamethasone, dimethylsulfoxide (DMSO) and ammonium acetate. Bovine insulin, NaCl, KCl, Na2HPO4.12 H2O, penicillin, streptomycin and other reagents of analytical grade were acquired from local suppliers.
Sample preparation
LS-2 was synthesized as previously published (CitationAveniente et al., 2007), and a stock solution was prepared at 100 mM in DMSO and filter-sterilized using a 0.22 µm cellulose membrane. Aliquots were stored at −20°C, and for the assays, LS-2 was diluted in specific culture medium as described below, with the final concentration of DMSO not exceeding 1.0%.
Animals
The procedure in rats was approved by the animal ethics committee of Butantan Institute. The animals were obtained from the Butantan Institute animal house, fed and given water ad libitum. Male Wistar rats were 6–8 weeks old, weighing between 200–250 g.
Isolation and culture of rat hepatocytes
Rats were anesthetized with xylazine hydrochloride and ketamine at 20 and 40 mg/kg, respectively; and heparin (500 UI) was administered by the intravenous route.
After opening the abdominal cavity, the liver was perfused in situ through the portal vein using the collagenase method as previously described (CitationGuguen-Guillouzo & Guillouzo, 1986; CitationGuillouzo, 1998) and with some modifications. First, the liver was perfused with 100 mL of 20 mM HEPES buffer (pH 7.2–7.4) containing NaCl (160.8 mM), KCl (3.15 mM) and Na2HPO4.12 H2O (0.7 mM). In a second step, perfusion was performed with 100–150 mL of the same HEPES buffer with added 0.025% collagenase and 5 mM CaCl2. After perfusion, the liver was carefully removed and the cells gently released from the parenchyma by homogenization with supplemented DMEM (10% fetal bovine serum, 10 nM dexamethasone, 1% DMSO, 0.2% bovine serum albumin, 0.1 IU/mL bovine insulin, 50 µg/mL penicillin and 50 IU/mL streptomycin). Hepatocytes were filtered through a cotton mesh to remove cell debris and the homogenate was centrifuged at 4°C and 400g for 5 min. Cells were washed twice with supplemented DMEM, and viability was determined by Trypan blue (0.1%) exclusion. Assays were performed with a hepatocyte suspension of 2.0 × 10⁶ cells/mL in supplemented DMEM and with viability over 80%.
Treatment of hepatocytes
The hepatocytes (2.0 × 10⁶ cells/mL) were seeded in a 24-well plate (1 mL/well), and after 4 h of incubation at 37°C (with 5% CO2 in a humidified atmosphere), the culture medium was removed and hepatocytes exposed to LS-2 at 0.05, 0.1, 0.2, 0.4, 0.6, 0.8 and 1.0 mM in serum-free DMEM. As control, hepatocytes were exposed to the DMEM containing DMSO (untreated cells) for 24 and 48 h.
After the treatment of hepatocytes, the cell-free culture medium was removed, frozen and used for biotransformation analysis. The remaining adhered hepatocytes were washed and lysed with ice-cold phosphate buffered saline solution (PBS). The cell lysates were immediately used for biochemical analyses or frozen at −20°C for later analysis.
Biochemical analyses
Protein concentration
Protein concentration was determined in the treated and untreated cell lysates using the Coomassie protein assay reagent (Pierce Chemical Co.), and absorbance was read at 600 nm (Spectrophotometer, SpectraMax 190, Molecular Devices Brazil). The protein concentration was calculated by comparison with a standard curve using bovine serum albumin.
Concentration of reduced glutathione
Proteins present in the cell lysates were removed by mixing 250 µL of the lysate with 50 µL of 48% trichloroacetic acid (TCA) followed by centrifugation at 1000g for 15 min at 4°C. For determination of GSH content, 50 µL of the supernatant obtained and 230 µL of Tris-HCl (0.4 M, pH 8.9) were placed in a 96-well microplate, followed by the addition of 20 µL of 2.5 mM DTNB [5,5′-dithiobis (2-nitrobenzoic acid)], in accordance with CitationFilipak Neto et al. (2008). DTNB was dissolved in 300 mM Tris-HCl (pH 8.9) containing 25% methanol. Absorbance was read at 415 nm (Spectrophotomer, SpectraMax 190, Molecular Devices Brasil) and GSH concentration was calculated by comparison with a standard curve prepared for GSH up to 1 mM. The GSH content was expressed per milligram of cell lysate protein.
Lipid peroxidation – concentration of thiobarbituric acid reactive substances
LPO in the cell lysate was evaluated through the reaction of thiobarbituric acid (TBA) with malonaldehyde (MDA) produced by LPO as previously published (CitationWallin et al., 1993) and with some modifications. For the reaction, 500 µL of each cell lysate, 2.5 mL of 15 mM Tris-HCl (pH 7.6), 1 mL of 20% TCA and 1 mL of 0.67% thiobarbituric acid were added to a tube. The reaction mixture was incubated at 100°C for 90 min and cooled. After that, 2.5 mL of isobutyl alcohol were added to each tube that was then vigorously mixed and centrifuged at 750g and 4°C for 10 min. The precipitate was discarded and relative fluorescence of the supernatant (200 µL) was measured by excitation at 515 nm and emission at 553 nm in a microplate spectrofluorimeter (SpectraMax Gemini XPS, Molecular Devices Brazil).
A standard curve was prepared with 1,1,3,3 tetraethoxypropane (TEP) from 0 to 0.5 nM and the concentration of TBARS was expressed as TEP equivalents per milligram protein.
Alkoxyresorufin O-dealkylase activities
Alkoxyresorufin O-dealkylase activities were determined in accordance with CitationBurke et al. (1998), with modifications (CitationReen & Singh, 1991).
The dealkylase reactions were performed in a final volume of 500 µL [50 mM Tris-HCl (pH 7.6), 5 mM MgCl2, 10 µM dicumarol, 500 µM NADPH and cell lysate containing 50 µg of protein)]. The reaction was started by the addition of 25 µL of the specific substrates at a final concentration of 1 mM. 7-Methoxyresorufin (MOR), 7-ethoxyresorufin (ERO), 7-penthoxyresorufin (PR) and 7-benzyloxyresorufin (BR) were used as the substrate for measuring CYP4501A2, CYP4501A1, CYP4502B1 and CYP4502B2 activities, respectively (CitationParkinson, 2001). The enzyme assays were carried on cell lysate obtained from hepatocytes treated for 24 and 48 h with LS-2 at concentrations from 0.05 to 1 mM. Reactions were allowed to run for 1 h at 37°C and then stopped by the addition of 2 mL of methanol.
In the reactions, the hydroxylation of the phenazone ring and formation of hydroxyphenazone or resorufin was measured by relative fluorescence at 550 nm for excitation and 585 nm for emission (SpectraMax Gemini XPS spectrofluorimeter, Molecular Devices Brazil). The enzyme activity levels of CYP4501A1, CYP4501A2, CYP4502B1 and CYP4502B2 were determined by comparison with a standard curve prepared with resorufin up to 1 mM, and expressed as amount of resorufin formed per milligram protein (µmol/mg protein).
CYP4502B isoform levels
The levels of CYP4502B isoforms were also additionally assayed in accordance with CitationReen and Singh (1991). The reaction in a final volume of 500 µL was performed in a tube containing: 50 mM Tris-HCl (pH 7.6), 5 mM MgCl2, 0.6 mM NADPH and cell lysate equivalent to 125 µg protein. The reaction was started by the addition of 25 µL of 7-methoxycoumarin (MOC) at a final concentration of 0.4 mM and incubation was at 37°C and 80 rpm for 15 min. The reaction mixtures were cooled at 4°C and 75 µL of 15% TCA and 1.5 mL of chloroform were added to each tube. After vigorous mixing, the organic phase was collected and the reaction product was extracted with 0.5 M glycine buffer containing 0.01 M of NaOH. The relative fluorescence of the 7-hydroxycoumarin formed was measured in the alkaline phase with excitation at 368 nm and emission at 456 nm. Results were obtained by comparison with a standard curve prepared with 7-hydroxycoumarin.
Coumarin 7-hydroxylase activity (CYP4502A1 and CYP4502A2)
Coumarin 7-hydroxylase activity was assayed as previously published (CitationGreenlee & Poland, 1978; CitationIersel et al., 1994). Tubes containing 50 mM Tris-HCl (pH 7.4), 10 µM coumarin and cell lysate (corresponding to 500 µg protein) in a final volume of 1 mL were incubated at 37°C and 80 rpm for 3 min. Afterwards, 100 µL of 3 mM NADPH were added, and the reaction was run for 10 min and stopped by the addition of 100 µL of 2 M HCl with chilling at 4°C. The 7-hydroxycoumarin produced was extracted with 2 mL of chloroform and transferred to another tube containing 1.5 mL of 0.5 M glycine buffer with 0.01 M of NaOH (pH 10.5) at 4°C. Tubes were vigorously mixed and then cooled, and the fluorescence of the alkaline phase was read in a microplate at 368 nm of emission and 465 nm of excitation. The results were obtained by comparison with a standard curve prepared with 7-hydroxycumarin.
Statistical analysis
The results of biochemical analysis are expressed graphically using the software package Origin-Data Analysis and Technical Graphics, version 6.0 (Copyright Software, Inc.). Statistical significance of differences in effect between samples was determined with GraphPad Prism 5.0 (GraphPad Software, Inc.). The level of significance was defined as P < 0.05.
Biotransformation analysis
Sample pretreatment
For biotransformation analysis, 1 mL of the supernatant of the cultured hepatocytes (thawed) treated with LS-2 from 0.05 up to 1 mM was mixed with 1 mL of phosphate buffer (pH 6.9) and the mixture passed through a pre-conditioned (2 mL MeCN, 2 mL water) Spe-ed SPE cartridge (Octadecyl C18/18%, 100 mg/mL, Applied Separations, USA). The cartridge was washed with 1 mL of 10 mM ammonium acetate and the aqueous phase was removed using an air stream. The analyte was eluted with 3 mL of 10 mM ammonium acetate-MeCN (1:9, v/v) and completely dried in a Speed-Vac® (Savant, SC210A/RC210B) below 40°C.
An extraction control was performed using the supernatant from the hepatocyte culture that received only DMEM containing DMSO (coded as LS-2 zero).
Samples were prepared for GC-MS analysis by solid phase extraction (SPE) as previously published by CitationSuchanova et al. (2006). Samples were analysed by GC-MS [(GC-MS HP 5970, Injector split/split less: at 270°C, detection at 280°C, HP5-MS column, 30 m × 0.25 mm × 0.25 µm; temperature schedule: 60°C (3 min), increases of 10°C/min until 280°C (10 min)]. In order to evaluate the extraction efficiency of the SPE method, LS-2 was dissolved in DMSO and diluted in DMEM without serum at 1 mM and used as reference. The recovery of LS-2 was over 80% (data not shown).
Results
Reduced glutathione and LPO
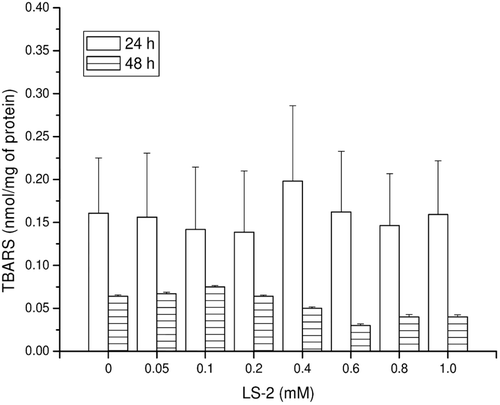
The concentration of GSH produced by the hepatocytes treated with LS-2 up to 1 mM for 24 and 48 h was not statistically different (P > 0.05) from that of the control which received only DMEM (LS-2 zero) (). The same result was observed for lipid peroxidation measured by the TBARS concentration (). However, the GSH level for the 48 h treatment was higher than that at 24 h, while for lipid peroxidation, the concentration of TBARS was higher at 24 h than 48 h.
Figure 1. Reduced glutathione (GSH) concentrations (µmol/mg of protein) on rat hepatocytes after treatment with 2-phenoxy-1-phenylethanone (LS-2) from 0 to 1 mM for 24 and 48 h. Zero concentration refers to untreated hepatocytes that received only DMEM culture medium containing 1% DMSO. Mean ± SEM for six and two independent experiments for 24 and 48 h, respectively.
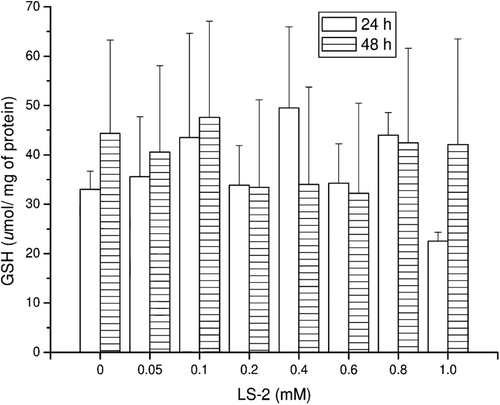
Figure 2. TBARS concentrations (nmol/mg of protein) in rat hepatocytes after treatment with 2-phenoxy-1-phenylethanone (LS-2) from 0 to 1 mM for 24 and 48 h. Zero refers to cells incubated with DMEM containing 1% DMSO as control. Mean ± SEM for six and two independent experiments for 24 and 48 h, respectively.
O-Dealkylation activities
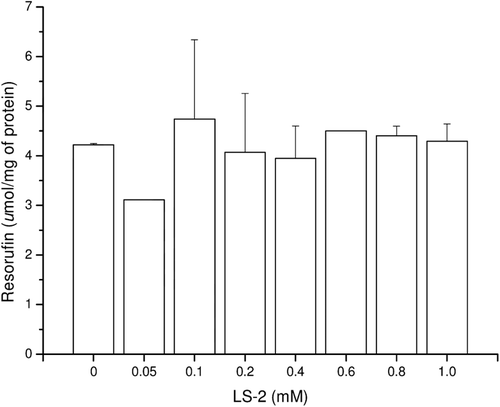
In response to the LS-2 action at 24 h, the levels of resorufin produced by 7-methoxyresorufin O-demethylase (MROD) (CYP450A2) were below 5 µmol/mg protein and there was no statistical difference between the hepatocytes treated with up to 1 mM LS-2 and the untreated cells (). The formation of resorufin was not detected either in the hepatocytes treated with LS-2 for 48 h or the untreated cells.
Figure 3. 7-methoxyresorufin dealkylase (CYP4501A2) activity in rat hepatocytes after treatment with 2-phenoxy-1-phenylethanone (LS-2) from 0 to 1 mM for 24 h. Results are expressed as amount of 7-resorufin formed per milligram of cell lysate protein (µmol/mg of protein). Mean ± SEM for six independent experiments.
Resorufin formation by 7-ethoxyresorufin O-deethylase (EROD) activity by the CYP4501A1 isoform was not detected in hepatocytes treated or untreated with LS-2 in assays at 24 and 48 h.
Similar results were observed for the substrates 7-penthoxyresorufin and 7-benzyloxyresorufin, indicating the lack of effect of LS-2 treatment on the activities of isoenzymes 7-penthoxyresorufin O-depenthylase (PROD) (CYP4502B1) and 7-benzyloxyresorufin O-debenzylase (BROD) (CYP4502B2).
Coumarin 7-hydroxylase activity
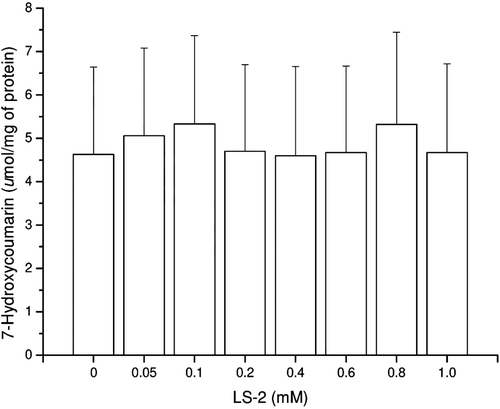
7-Hydroxylase activity (CYP4502A1 and CYP4502A2) in hepatocytes treated with LS-2 up to 1 mM for 24 h was not observed since the reaction product 7-hydroxycoumarin was not detected. After 48 h of treatment, the reaction product was detected but there was no statistical difference between treated and untreated hepatocytes ().
Figure 4. Coumarin 7-hydroxylase activity (CYP2A1 and CYP2A2) in rat hepatocytes after treatment with 2-phenoxy-1-phenylethanone (LS-2) from 0 to 1 mM for 48 h. Results expressed as 7-hydroxycoumarin formed per milligram of cell lysate protein (µmol/mg of protein). Mean ± SEM for two independent experiments.
Biotransformation analysis
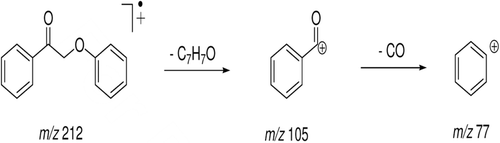
In the medium of cultured hepatocytes treated with LS-2 for 24 h, the GC-MS analysis showed the presence of five peaks (). Peaks were identified by comparative analysis between chromatograms of cultures of the treated and untreated hepatocytes (control). The peak with retention time (Rt) of 18.25 min was attributed to LS-2, considering the mass spectrum represented in . There was a m/z 212 attributed to the molecular ion and a base peak of m/z 105. Detected fragments were related to the fragmentation scheme presented for LS-2 ().
Figure 5. GC-MS profile for 2-phenoxy-1-phenylethanone (LS-2) and metabolites from the hepatocytes treated with LS-2 for 24 h. Peaks one, two, and four represent the LS-2 molecule and metabolites 1 and 2, respectively. Peaks three and five are phthalates; Peak * is an unidentified compound.
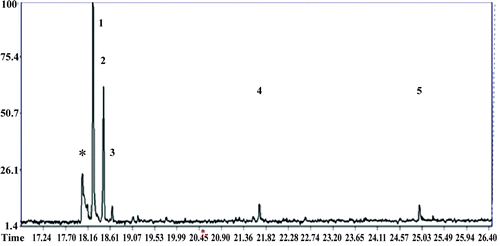
Figure 6. Mass spectrum (EI): peak with retention time (Rt) = 18.25 min attributed to 2-phenoxy-1-phenylethanone (LS-2).
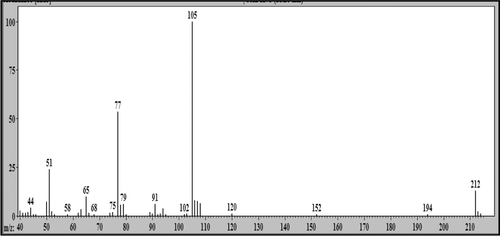
Figure 7. Schematic proposal of 2-phenoxy-1-phenylethanone (LS-2) fragmentation.
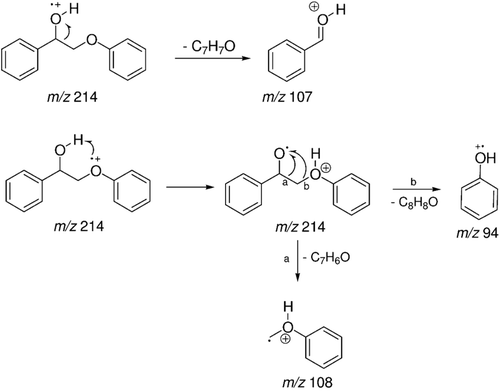
The peak with Rt = 18.47 min was attributed to a metabolite produced during treatment of the hepatocytes with LS-2 and was identified as 2-phenoxy-1-phenylethanol (m/z 214) with 2 mass units more than the LS-2 (212 Da). The mass spectrum of this metabolite is shown in . There was probably a reduction of the LS-2 ketonic carbonyl and formation of an alcohol. The fragmentation to 2-phenoxy-1-phenylethanol (m/z 214) with Rt = 18.47 min is demonstrated in . The signal m/z 107 was attributed to a C7H7O loss through the cleavage and ionization of the alcohol hydroxyl. The signal m/z 94 was attributed to phenol formation by ionization of the ether oxygen followed by proton transfer and loss of a neutral styrene oxide molecule (C8H8O, 120 Da). The signal m/z 108 refers to the loss of a neutral benzaldehyde molecule (C7H6O, 106 Da), produced by the same intermediate of the ion m/z 94. This hypothesis of fragmentation is in accordance with the structures proposed.
Figure 8. Mass spectrum (EI) of the peak with retention time (Rt) = 18.47 min attributed to 2-phenoxy-1-phenylethanol - metabolite 1.
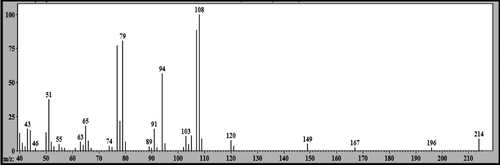
Figure 9. Schematic proposal for fragmentation of 2-phenoxy-1-phenylethanol - metabolite 1.
Peaks with Rt = 18.65 and 24.97 min were attributed to contaminants identified as phthalates. These attributions were made by comparison between control chromatogram and mass spectra containing the m/z 149 as base peak, which is characteristic of phthalates.
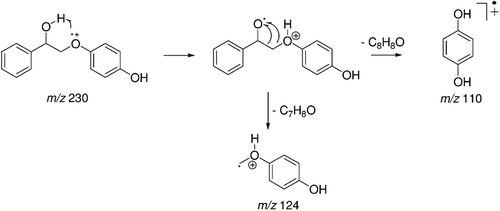
The peak with Rt = 21.67 min was attributed to a second metabolite identified as metabolite 2, and its mass spectrum is shown in . There is a m/z 230 of the molecular ion with 16 mass units more than metabolite 1 (214 Da). These data suggest the oxidation of metabolite 1 by an oxygen atom. The fragmentation hypothesis for metabolite 2 2,4-(2-hydroxy-2-phenylethoxy)phenol (m/z 230) is represented in . The formation of fragments of m/z 110 (base peak) and m/z 124 in metabolite 2 follows the same fragmentation mechanism proposed for metabolite 1. The fragment m/z 110 is obtained by ionization of the ether oxygen followed by proton transfer and loss of a neutral styrene oxide molecule (C8H8O, 120 Da), and the fragment m/z 124 is produced by loss of a neutral benzaldehyde molecule (C7H6O, 106 Da).
Figure 10. Mass spectrum (EI) profile of the peak with retention time (Rt) = 21.67 min attributed to 2,4-(2-hydroxy-2-phenylethoxy)phenol - metabolite 2.
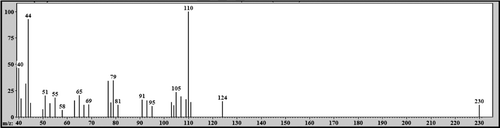
Figure 11. Proposal for fragmentation of 2,4-(2-hydroxy-2-phenylethoxy)phenol - metabolite 2.
The cell-free medium of cultured hepatocytes treated with LS-2 for 48 h showed the presence of LS-2 and metabolite 1 with Rt = 18.47 min attributed to 2-phenoxy-1-phenylethanol (m/z 214), while metabolite 2 with Rt = 21.67 min present in the 24 h study was not detected.
Discussion
LS-2 treatment of rat hepatocytes showed no enzymatic alteration related to oxidation status and drug-metabolizing enzyme activities. Several enzyme activities were assayed, and cells treated with this compound maintained their basal enzyme activity levels, indicating no damage due to LS-2 or its two detected metabolites, 2-phenoxy-1-phenylethanol (1) and 2,4-(2-hydroxy-2-phenylethoxy)phenol (2).
GSH has a major role as a reductant in oxidation-reduction processes, and is also involved in detoxication and several other cellular functions of great importance. GSH is the first defense system against several reactive oxygen species (ROS) and free radicals (CitationPastore et al., 2003). The intracellular GSH levels suggest that LS-2, up to 1 mM, was unable to interfere with the production of oxidative species such as hydrogen peroxide (H2O2), superoxide anion (O2•) and hydroxyl radical (•OH), which are taken as initiators of lipid peroxidation processes (CitationGutteridge, 1995). The drop in TBARS content in the cell lysate after 48 h of treatment with LS-2 or in the control (LS-2 zero) could be explained by the higher concentration of GSH detected at 24 h in both groups. The literature data show that GSH depletion is related to an increase in lipid peroxidation (CitationPaolinelli et al., 2006) due to efforts by the cells to reestablish the equilibrium disrupted by oxidative stress.
Coumarin 7-hydroxylase activity converting coumarin into 7-hydroxycoumarin is very weak or absent in rats (CitationParkinson, 2001), which was also observed in this study in hepatocytes treated for 24 h. No reaction product was detected in cell lysates after this period of treatment. Although 7-hydroxylase activity was detected after 48 h of treatment, there was no statistical difference between treated and untreated hepatocytes.
The absence of CYP4501A1, CYP4502B1 and CYP4502B2 activities and a very weak CYP4501A2 activity evaluated by the O-dealkylation reactions indicate that there was no imbalance between pro-oxidant agent production and their respective antioxidant systems due to LS-2 effect. It is the balance between bioactivation, detoxification and defense/repair mechanisms that determines whether or not a compound will elicit a toxic effect (CitationWilliams et al., 2002).
The LS-2 metabolites 2-phenoxy-1-phenylethanol (1) and 2,4-(2-hydroxy-2-phenylethoxy)phenol (2) were formed in hepatocytes after 24 h of treatment. However, the latter was not detectable in the medium after 48 h of treatment, probably due to degradation.
These results are very relevant to an antimicrobial compound, since they indicate that LS-2 or its two metabolites, which were detected, showed no cytotoxicity against hepatocytes. These data support previous data for LS-2 in mammalian cells, i.e., J774 macrophages, V79 cells and rat hepatocytes, in which very low or no cytotoxicity of LS-2 was observed. Additionally, a previous study showed that LS-2 induced acute toxicity in mice only at a high dose of 1.87 g/kg (Citationde Souza et al., 2011). In accordance with previous results, all the data obtained suggest no toxicity of LS-2 or its metabolites against rat hepatocytes, which is a good indication of a lack of side effects of a drug during treatment. These data are supported by the finding that drug-metabolizing enzyme activities were unchanged after treatment with LS-2. However, there is still the hypothesis that this could be due to the rapid loss of liver-specific functions of the rat hepatocyte monolayers, especially of CYP450 activity. To resolve this question, new studies can be proposed, using primary human hepatocytes in tissue-like gel entrapment culture or rat hepatocytes entrapped in collagen gel as well as cytocompatible hollow fibers, which maintain liver-specific functions at higher levels and for a long time (CitationShen et al., 2008).
CitationShen et al. (2008) showed that rat and human hepatocytes in monolayer cultures treated with the antituberculosis drug isoniazid did not show any decrease in cell viability or decrease in GSH content. By contrast, they found that in gel entrapment cultures, isoniazid was toxic to both rat and human hepatocytes, especially the latter. This previous study by CitationShen et al. (2008) demonstrates that primary human hepatocytes in gel entrapment culture would be a more effective model for the prediction of drug hepatotoxicity, as well as drug-drug interactions, by establishing a good correlation between in vitro and in vivo test systems. Comparative studies using hepatic models are the most useful for demonstrating species differences in the metabolism of a given drug candidate (CitationLewis et al., 1998; CitationLin, 1998; CitationBun et al., 1999), and are of great value in the judicious and justifiable selection of animals for subsequent pharmacokinetic and toxicological studies. Therefore, the development of a new drug requires an exhaustive characterization of not only its pharmacological activity, but also knowledge of major enzymes involved in its metabolism, and the potential enzyme-inhibiting or enzyme inducing-properties of the drug (CitationGómez-Lechón et al., 2007).
The aim of screening P450 inhibition properties of drug candidates is to exclude potent inhibitors from further development since from the drug therapy point of view it is desirable to use drugs that are not potent P450 inhibitors or inducers (CitationGómez-Lechón et al., 2007).
Conclusions
Hepatocytes treated with the neolignan analogue 2-phenoxy-1-phenylethanone (LS-2) maintained their basal drug-metabolizing enzyme activity levels, indicating no damage due this compound or to its two detected metabolites, 2-phenoxy-1-phenylethanol and 2,4-(2-hydroxy-2-phenylethoxy)phenol. These data are very relevant to this antimycobacterial compound, showing no cytotoxicity against hepatocytes, which may be a considerable contribution toward the development of new antimycobacterial agents.
Acknowledgments
We gratefully acknowledge Rita de Souza from the Institute of Chemistry, UNICAMP for technical support in the CG-MS analysis. Dr. A. Leyva helped with English editing of the manuscript.
Declaration of interest
This work was supported by the São Paulo Research Foundation (Fundação de Amparo à Pesquisa do Estado de São Paulo/FAPESP).
References
- Alves CN, Macedo LGM, Honório KM, Camargo AJ, Santos LS, Jardim IN, Barata LES, Silva ABF. (2002). A structure-activity relationship (SAR) study of neolignan compounds with anti-schistosomiasis activity. J Braz Chem Soc, 13, 300–307.
- Aveniente M, Pinto EF, Santos LS, Rossi-Bergmann B, Barata LE. (2007). Structure-activity relationship of antileishmanials neolignan analogues. Bioorg Med Chem, 15, 7337–7343.
- Barata LES, Baker PM, Gottlieb OR, Rùveda EA, (1978) Neolignans of Virola surinamensis.Phytochemistry, 17, 783–786.
- Barata LE, Santos LS, Ferri PH, Phillipson JD, Paine A, Croft SL. (2000). Anti-leishmanial activity of neolignans from Virola species and synthetic analogues. Phytochemistry, 55, 589–595.
- Barile FA, Cardona M. (1998). Acute cytotoxicity testing with cultured human lung and dermal cells. In Vitro Cell Dev Biol Anim, 34, 631–635.
- Brötz-Oesterhelt H, Sass P. (2010). Postgenomic strategies in antibacterial drug discovery. Future Microbiol, 5, 1553–1579.
- Bun H, Disdier B, Aubert C, Catalin J. (1999). Interspecies variability and drug interactions of clozapine metabolism by microsomes. Fundam Clin Pharmacol, 13, 577–581.
- Burke MD, Thompson S, Elcombe CR, Halpert J, Haaparanta T, Mayer RT. (1998). Ethoxy-, pentoxy- and benzyloxyphenoxazones and homologues: A series of substrates to distinguish between different induced cytochromes P-450. Biochem Pharmacol, 34, 3337–3345.
- de Souza AO, Alderete JB, Minarini PR, da Silva Melo P, Ferreira I, Barata LE, Silva CL. (2011). Structure activity relationship, acute toxicity and cytotoxicity of antimycobacterial neolignan analogues. J Pharm Pharmacol, 63, 936–942.
- Dierickx P. (2005). Prediction of human acute toxicity by the hep G2/24 hour/total protein assay with protein measurement by the CBQCA method. ATLA: Altern Lab Anim, 33, 207–213.
- Dover LG, Coxon GD. (2011). Current status and research strategies in tuberculosis drug development. J Med Chem, 54, 6157–6165.
- Filipak Neto F, Zanata SM, Silva de Assis HC, Nakao LS, Randi MA, Oliveira Ribeiro CA. (2008). Toxic effects of DDT and methyl mercury on the hepatocytes from Hoplias malabaricus. Toxicol In Vitro, 22, 1705–1713.
- Fischbach MA, Walsh CT. (2009). Antibiotics for emerging pathogens. Science, 325, 1089–1093.
- Gómez-Lechón MJ, Castell JV, Donato MT. (2007). Hepatocytes - the choice to investigate drug metabolism and toxicity in man: in vitro variability as a reflection of in vivo. Chem Biol Interact, 168, 30–50.
- Gómez-Lechón MJ, Ponsoda X, Bort R, Castell JV. (2001). The use of cultured hepatocytes to investigate the metabolism of drugs and mechanisms of drug hepatotoxicity. Altern Lab Anim, 29, 225–231.
- Greenlee WF, Poland A. (1978). An improved assay of 7-ethoxycoumarin O-deethylase activity: Induction of hepatic enzyme activity in C57BL/6J and DBA/2J mice by phenobarbital, 3-methylcholanthrene and 2,3,7,8-tetrachlorodibenzo-p-dioxin. J Pharmacol Exp Ther, 205, 596–605.
- Guguen-Guillouzo C, Guillouzo A. (1986). In: Guillouzo A, Guguen-Guillouzo C, (eds). Isolated and Cultured Hepatocytes. London: Les Editions & John Libbey Eurotext.
- Guillouzo A. (1998). Liver cell models in in vitro toxicology. Environ Health Perspect, 106 Suppl 2, 511–532.
- Gutteridge JM. (1995). Lipid peroxidation and antioxidants as biomarkers of tissue damage. Clin Chem, 41, 1819–1828.
- Kingston DG. (2011). Modern natural products drug discovery and its relevance to biodiversity conservation. J Nat Prod, 74, 496–511.
- Lewis DF, Ioannides C, Parke DV. (1998). Cytochromes P450 and species differences in xenobiotic metabolism and activation of carcinogen. Environ Health Perspect, 106, 633–641.
- Lima EO, Maia RF, Barbosa RCSBC, Filho LX, Paulo MQ, Santos LS, Barata LES. (1987). Atividade antimicrobiana de neoliganas 8.0.4 e derivados sintéticos – I. CCS João Pessoa, 9, 55–57.
- Lin JH. (1998). Applications and limitations of interspecies scaling and in vitro extrapolation in pharmacokinetics. Drug Metab Dispos, 26, 1202–1212.
- Mingoia RT, Nabb DL, Yang CH, Han X. (2007). Primary culture of rat hepatocytes in 96-well plates: Effects of extracellular matrix configuration on cytochrome P450 enzyme activity and inducibility, and its application in in vitro cytotoxicity screening. Toxicol In Vitro, 21, 165–173.
- Moldéus P, Holberg J, Orrenius S. (1978). Isolation of and use of liver cells. Methods Enzymol 52, 60–71.
- Nakagawa Y, Nakajima K, Tayama S, Moldéus P. (1995). Metabolism and cytotoxicity of propyl gallate in isolated rat hepatocytes: Effects of a thiol reductant and an esterase inhibitor. Mol Pharmacol, 47, 1021–1027.
- Paolinelli ST, Reen R, Moraes-Santos T. (2006). Curcuma longa ingestion protects in vitro hepatocyte membrane peroxidation. Braz J Pharm Sci 42, 429–435.
- Parkinson A. (2001). Biotransformation of xenobiotics. In: Klaassen CD, ed. Casarett and Doull’s Toxicology: The basic science of poisons. 9th edition. New York: McGraw-Hill, Inc.
- Pastore A, Federici G, Bertini E, Piemonte F. (2003). Analysis of glutathione: Implication in redox and detoxification. Clin Chim Acta, 333, 19–39.
- Reen RK, Singh J. (1991). In vitro and in vivo inhibition of pulmonary cytochrome P450 activities by piperine, a major ingredient of piper species. Indian J Exp Biol, 29, 568–573.
- Shen C, Meng Q, Zhang G, Hu W. (2008). Rifampicin exacerbates isoniazid-induced toxicity in human but not in rat hepatocytes in tissue-like cultures. Br J Pharmacol, 153, 784–791.
- Suchanova B, Sispera L, Wsol V. (2006). Liquid chromatography-tandem mass spectrometry in chiral study of amlodipine biotransformation in rat hepatocytes. Anal Chim Acta, 573-574, 273–283.
- Wallin B, Rosengren B, Shertzer HG, Camejo G. (1993). Lipoprotein oxidation and measurement of thiobarbituric acid reacting substances formation in a single microtiter plate: Its use for evaluation of antioxidants. Anal Biochem, 208, 10–15.
- Williams DP, Kitteringham NR, Naisbitt DJ, Pirmohamed M, Smith DA, Park BK. (2002). Are chemically reactive metabolites responsible for adverse reactions to drugs? Curr Drug Metab, 3, 351–366.
- van Iersel M, Walters DG, Price RJ, Lovell DP, Lake BG. (1994). Sex and strain differences in mouse hepatic microsomal coumarin 7-hydroxylase activity. Food Chem Toxicol, 32, 387–390.