Abstract
Context: Persea americana Mill (Lauraceae) root bark is used in ethnomedicine for a variety of diseases including cancer.
Objective: To isolate and characterize the chemical constituent in P. americana, and also to determine the anticancer property of a new alkene lactone from the root bark of P. americana.
Materials and methods: The MCF-7 cells were treated with different concentrations of the pure compound for 48 h. The percentage of cells in the various phases, online monitoring of metabolic changes and integrin receptor expression determined by flow cytometry.
Results: One novel alkene lactone (4-hydroxy-5-methylene-3-undecyclidenedihydrofuran-2 (3H)-one) (1) was isolated and characterized using 1D-NMR, 2D-NMR, infrared, UV and MS. At a concentration of 10 µg/mL, significant reduction of proliferation of MCF-7 was induced while MCF-12 A cell was significantly stimulated by 10 µg/mL. The IC50 value for MCF-7 cells is 20.48 µg/mL. Lower concentration of 1 harbor no significant effect on either MCF-7 or MCF-12A. The apoptotic rates of MCF-7 cells were increased significantly. At the final concentration 10 µg/mL, up to 80% of all breast cancer cells were dead. On the non-tumorigenic cell line MCF-12A, the same concentrations (1 and 10 µg/mL) of compound 1 caused significant enhanced apoptotic rates. A total of 1 µg/mL of 1 caused a decrease of α4-, α6-, β1- and β3-integrin expression.
Conclusions: The compound caused a stimulatory effect on non-tumorigenic MCF-12A cells with respect to cell adhesion while tumorigenic MCF-7 cells detached continuously. This is the first report on the anticancer effects of this class of compound.
Introduction
The tropical rain forests provide many plants that have potential medicinal properties but the ethno- and phyto-pharmaceuticals of these plants have not been fully exploited (Baladrin et al., Citation1993). The World Health Organization (WHO, Citation2003) estimated that diseases and infections of 80% of the world’s inhabitant should be treated with medicinal herbal drugs for their primary health care. Medicinal plants and their constituents have long been used for the treatment of cancer. Active constituents of Catharanthus roseus Linn (Apocynaceae) and Taxus brevifolia Nutt (Taxaceae) have been used in the treatment of advanced stages of various malignancies (Eva et al., Citation2006). A large number of medicinal plants used in Nigerian traditional herbal system have been reported to possess anticancer activities. Persea americana Mill (Lauraceae), commonly known as “avocado pear” is a medium-sized, single-stemmed, terrestrial, erect, perennial, evergreen tree of 15–20 m in height. The leaves and other morphological parts of P. americana possess medicinal properties which are widely used in traditional medicines of many African countries.
In Nigeria, the leaves of P. americana have been used as an effective antitussive, antidiabetic, antihypertensive, and as analgesic and anti-inflammatory remedies (Adeboye et al., Citation1999; Adeyemi et al., Citation2002; Antia et al., Citation2005; Owolabi et al., Citation2005). The aqueous decoction of the leaves is used locally for the treatment of tumors and tumor-related diseases. The root bark of the plant is used in Nigerian traditional medicine as anticancer and anti-inflammatory, but the anticancer activity of the compounds has not been reported. This study reports on the isolation and characterization of novel alkene lactone 1 and its anticancer activity using cell cycle determination by flow cytometry, online monitoring of cellular metabolism and integrin receptor expression. IC50 values were calculated by MTS test and nonlinear regression.
Materials and methods
General experimental procedures
Solvents were distilled and if necessary, dried using standard procedures. Thin layer chromatography was carried out on silica gel 60 GF254 (Merck, Darmstadt, Germany) with detection by UV light (λ = 254 nm) and/or by charring with 10% vanillin sulfuric acid in methanol. Silica gel 60 (70–230 mesh) (Merck) was used for column chromatography (CC). Specific rotations were determined with a Gyromat HP (Dr. Kernchen). Infrared (IR) spectra were recorded with a Nicolet 205 FT-IR spectrometer (Hamburg, Germany). 1H- and 13C-NMR spectra (250.13 and 300.13 MHz) were recorded on Bruker instruments AC 250 and ARX 300 (Hamburg, Germany), with CDCl3-d6 as solvent. The 1H- and 13C-NMR signals were assigned by DEPT and 2D-NMR. The mass spectra were recorded on an AMD 402/3 spectrometer (AMD Intectra GmbH, Hamburg, Germany). Elemental analyses were performed on a CHNS automatic elemental analyzer Flash EA 1112 (ThermoQuest, Hamburg, Germany).
Plant material
Matured P. americana root bark was obtained from a riverside site at the University of Benin, Benin City, Nigeria, in January, 2011. The plant was identified and authenticated by O.A. Ugbogu and S.A. Shasanya of the Forest Research Institute of Nigeria, where a voucher specimen (FHI108336) was deposited.
Extraction and isolation
The fresh root bark of P. americana was dried at room temperature (25 °C) for two weeks. The dried root bark (3.2 kg) was extracted with methanol by the Soxhlet method and concentrated under reduced pressure to a dark brown residue (149 g). This was partitioned with heptane (35 g), chloroform (11 g), ethyl acetate (28 g) and butanol (8 g). The heptane fraction was reduced to dryness using a rotary evaporator at reduced pressure and temperature (40 °C). The light brown fraction was subjected to CC over silica gel and eluted with heptane, heptane and ethyl acetate mixtures to give 96 fractions. Fraction 2 (20–32, 6.89 g) was rechromatographed on silica gel using heptane, heptane:ethyl acetate (7:3) to give partially purified fraction. Repeated CC gave compound 1 as oily compound (34 mg). The known compounds sitosterol and stigmasterol were obtained from fractions 1 (tubes 4–9) and 12–15, respectively. Their spectral data were compared with known and established data.
Cell culture
The estrogen-sensitive human breast adenocarcinoma cell line MCF-7 (ATCC no. HTB-22) was obtained from the American Type Culture Collection (Manassas, VA) and maintained at 37 °C and in a 5% CO2 atmosphere in Dulbecco’s modified Eagle’s medium (Invitrogen, Darmstadt, Germany) with 10% fetal bovine serum (PAN Biotech GmbH, Aidenbach, Germany) and 1% gentamycin (Ratiopharm, Ulm, Germany). Confluent cells were treated with 0.05% trypsin–0.02% EDTA. The medium was changed every 2 d. As control functions, the non-tumorigenic epithelial breast cell line MCF-12A (ATCC no. CRL-10782) was grown in Dulbecco's modified Eagle’s medium Ham's F12 without phenol red (Invitrogen, Germany) containing 10% horse serum (PAA Laboratories GmbH, Munich, Germany), the Mammary Epithelial Cell Growth Medium Supplement Pack (Promo Cell, Heidelberg, Germany) including bovine pituitary extract 0.004 mL/mL, epidermal growth factor (recombinant human) 10 ng/mL, insulin (recombinant human) 5 µg/mL, hydrocortisone 0.5 µg/mL and 1% gentamycin (Ratiopharm).
Treatment with plant extract
Cells were seeded in plates in regular culture for 1 day. Cells with a confluence of approximately 70% were washed with phosphate buffer solution (PBS) and adapted to phenol-red-free Dulbecco’s modified Eagle’s medium (PAA Laboratories GmbH) with 10% charcoal-stripped fetal bovine serum (assay medium). Treatment with compound 1 (final concentrations 0.01, 0.1, 1, 10 µg/mL) was carried out for 48 h in the assay medium. The negative control substance, dimethylsulfoxide (0.1%) was used in the same manner.
Flow cytometric measurement of cell proliferation
The extent of cell cycle progression and apoptosis in the cells was estimated by flow cytometric analysis after propidium iodide (Roche Diagnostics, Indianapolis, IN) staining of the cells. After treatment with compound 1, cells were trypsinized with 0.05% trypsin–0.02% EDTA for 5 min. The reaction was stopped with the assay medium. Cells suspension was transferred to FACS tubes (BD Biosciences, Franklin Lakes, NJ) and fixed in 70% ethanol for 12 h at −20 °C. After washing with PBS, cells were incubated with RNase (1 mg/mL) at 37 °C for 30 min. Finally, cells were resuspended in propidium iodide (50 mg/mL) for at least 3 h at +4 °C protected from light until flow cytometric analysis (Engel et al., Citation2011; Nebe et al., Citation2006). Flow cytometric measurements were performed on the flow cytometer BD FACSCalibur (BD Biosciences). A minimum of 15,000 ungated events were recorded. For the analysis of cell proliferation, the cell cycle phases G0/G1, S and G2/M were calculated in percentage using FlowJo7.6. For statistical evaluation, the S-phase and G2/M-phase cells were defined as proliferative cells.
Online monitoring of metabolic alterations
Live cell monitoring of the adhesion and acidification under the influence of compound 1 was performed with the Bionas® 2500 analyzing system with the metabolic chip SC 1000 (Bionas GmbH, Rostock, Germany) and the measurement software Bionas15002 CS1.47 (Thedinga et al., Citation2007). Prior to experiments, chips were cleaned with 70% ethanol for 10 min, washed with PBS and were adapted to the measurement medium for 5 min. Measurement medium was composed of DMEM without NaHCO3 (Invitrogen), 0.1% charcoal stripped fetal bovine serum (PAN Biotech GmbH) and 1% gentamycin (Ratiopharm), pH value 7.4 and sterile filtered. On each chip (2 × 10⁶), cells were seeded and allowed to adhere overnight at 37 °C and in 5% CO2 so that 80% confluence on the sensor chips was reached. Bionas measurements were carried out with a pump rate of 56 μL/min for 24 h (Rebl et al., Citation2010; Thedinga et al., Citation2007). Within the first 4 h, cells could adapt to the new measurement medium. Thereafter, MCF-7 and MCF-12A cells were treated with DMSO and compound 1 (final concentration 0.1 μg/mL) for 20 h. Every measurement was repeated three times. Data set was evaluated and normalized with the software Bionas15002 Data analyzerV1.07. Curves were standardized and presented as percentage of control (DMSO).
Measurement of integrin and hyaluronic acid expression
Integrin and hyaluronic acid receptor expression was measured by flow cytometry in accordance with the method previously described (Nebe et al., Citation2006). Anti-integrin receptor antibodies (CD28, CD61, CD49a-f, CD51; Beckman Coulter, Munich, Germany) anti-hyaluronic acid receptor antibody (CD44; Beckman Coulter) were labeled with fluorescein isothiocyanate-conjugated anti-mouse IgG (Fab2) fragment (Sigma, Hamburg, Germany). Events (10,000) were recorded for each measurement and repeated three times. Results were calculated with the software FlowJo7.6 (Ashland, OR).
Calculation of IC50 value
IC50 value was calculated by colorimetric measurements of mitochondrial metabolic activity with the CellTiter MTS/PMS assay according to the manufacturer’s instructions (Promega Corp., Madison, WI). MTS is a tetrazolium compound [3-(4,5-dimethylthiazol-2-yl)-5-(3-carboxymethoxyphenyl)-2-(4-sulfophenyl)-2H-tetrazolium] which is combined with an electron coupling reagent (phenazine ethosulfate). Cells were seeded in 96-well plates in a 100 µL assay medium and allowed to attach for 24 h. Treatment with compound 1 at final concentrations of 1, 10, 25 and 50 µg/mL was carried out as described previously. In parallel, control approaches were carried out with medium only and 0.1% of DMSO to calculate background absorbance. No background absorbance was obtained for compound 1 and MTS in the absence of cells. After an initial incubation for 24 h, cells were assayed with MTS according to the manufacturer’s instructions (Promega Corp.). Colorimetric changes were measured at 490 nm and raw data were transferred to Microsoft Excel and analyzed. At least eight replicates corrected with the background absorbance were performed. Reduction of cell viability at each concentration was plotted as a dose–response curve. The half maximal inhibitory concentrations (IC50) of the active extracts were calculated using nonlinear regression to fit data to the dose–response.
Statistical analysis
Every experiment was replicated three times with individual passaged cells and data sets were expressed as mean ± SD. Comparable analysis was done by use of unpaired t-test. Statistical significance was set at p < 0.05.
Results
Compound 1 was isolated as a yellow viscous oil with a positive specific rotation (, c 1.07, CHCl3) and molecular formula C16H26O3 as determined by EIMS and 13C-NMR and DEPT experiments. The 1H-NMR spectrum of 1 () displayed a methyl singlet at δ 0.75 attributable to a terminal methyl of the long-chain hydrocarbon. 1H-NMR spectroscopic data also showed the presence of a long hydrocarbon chain with a multiplet representing methylene groups (tall multiplet). A pair of doublets centered at δ 4.47 and δ 4.49 was characteristic of the exocyclic methylene protons at H-9. A vinyl proton in compound 1 was evidenced by the presence of a doublet of triplets at δ 6.85 in H-7. The 13C-NMR of 1 revealed the presence of 17 carbons. An ester carbonyl carbon resonating at 166.9 ppm in the spectrum was diagnostic in the IR spectrophotometer spectrum with an absorbance of 1730 cm−1. The chemical structure of compound 1 was established as 4-hydroxy-5-methylene-3-undecyclidenedihydrofuran-2 (3H)-one.
Table 1. 1H- and 13C-NMR data for compound 1a.
The compound was subjected to anticancer activity using breast cancer cell line MCF-7 and the non-tumorigenic mammary epithelial cell line MCF-12 as a control for healthy tissue. First, the influence of compound 1 on cell cycle phases was assayed by flow cytometry (). Cell cycle phases G2/M and S were added and summarized as proliferative phases. At a concentration of 10 µg/mL, compound 1 induced a significant reduction of MCF-7 proliferation (absence of MCF-7 cells division). In contrast, proliferation of MCF-12A cell was significantly stimulated by 10 µg/mL of compound 1. However, lower concentrations harbored (or showed) no significant effect on either MCF-7 or MCF-12A. This opposite effect on both cell lines offers new possibilities in anticancer treatment because it would be outstanding to have a drug that cause a reduction in the growth of cancer cells as well as stimulates the proliferation of healthy cells at the same time.
Figure 1. Proliferation and apoptotic alterations of MCF-7 breast cancer cells and non-tumorigenic MCF-12A mammary epithelial cells after 48 h incubation with different concentrations (0.01, 0.1, 1, 10 µg/mL) of compound 1 and 0.1% DMSO as negative control substance. Both measurements were determined by flow cytometry. Proliferation phase was the sum of the G2/M and S phase. Apoptotic cells were calculated from the sub-G1 phase. Negative control treatment with DMSO was set to 100%. n = 3, means ± SD, statistical significance was determined by the unpaired t-test (***p < 0.001).
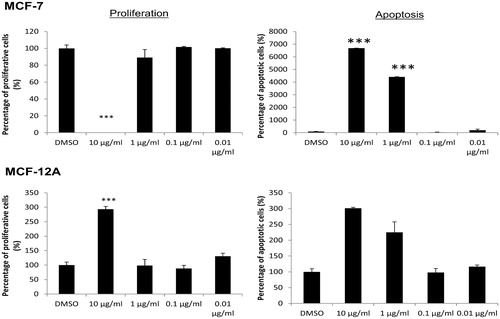
The proapoptotic effect of compound 1 on the cells is shown in . The sub-G1 cell cycle phase was measured to determine DNA strand degradation. Starting with a concentration of 1 µg/mL of compound 1 increased significantly apoptotic rates of MCF-7 cells. At the final concentration of 10 µg/mL, up to 80% of all breast cancer cells were dead. On the non-tumorigenic cell line MCF-12A, the same concentrations (1 and 10 µg/mL) of compound 1 caused significant enhanced apoptotic rates.
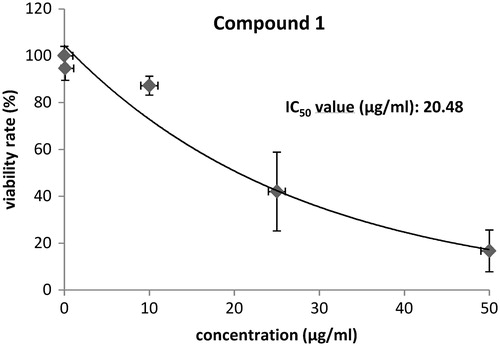
Alterations of adhesion of the cell line MCF-7 in comparison with MCF-12A are shown in . After 2 h, the adhesion values of the cancer cell line MCF-7 decreased continuously while the cell line MCF-12A increased the adhesion capacity. Higher adhesion rates of MCF-12A suggested that cells were further divided and spreading of the cells took place. The loss of adhesion in MCF-7 on the other hand refers to the rounding of the cells and detachment from the chip surface. A second parameter for cancer metabolism is the extracellular acidification, a result of the Warburg effect (Warburg, Citation1930, Citation1956). Treatment of MCF-7 cells with compound 1 over a period of 20 h resulted in 50% decreased acidification rates while MCF-12A cells were not affected significantly. Cellular adhesion is mediated by integrin, membrane receptors connecting the cell with the extracellular matrix as well as with the intracellular cytoskeleton. The integrin receptor expression analysis by flow cytometry was determined () because Bionas measurements revealed an opposite influence of compound 1 on the adhesion properties of MCF-7 and MCF-12A. Treatment with 0.1 µg/mL compound revealed no significant alterations in integrin and CD44 [hyaluronic acid (HA) receptor] expression of MCF-7 cells while 1 µg/mL increased the expression of α4-integrin significantly. In contrast, MCF-12A cells showed an opposite regulation of the integrin receptor expressions under exposure with compound 1. At a concentration of 0.1 µg/mL, α6- and β1-integrin receptor expression was reduced compared with DMSO-treated negative control. The higher concentration of 1 µg/mL caused a decrease of α4-, α6-, β1- and β3-integrin expression. Finally, the IC50 value of compound 1 for MCF-7 cells was determined (). A value of 20.48 µg/mL was reached with the MTS test.
Figure 2. Online monitoring of adhesion and acidification rates of the MCF-7 breast cancer cell line in comparison with the non-tumorigenic epithelial cell line MCF-12 A under treatment with compound 1 (final concentration 0.1 μg/mL) using the Bionas® 2500 analyzing system. Gray shadowed area marks the adaption phase (4 h) of the cells to the new conditions in pure running medium. Treatment with compound 1 was carried out for 20 h at a flow rate of 56 μL/min with 4/4 min pump/stop phases. The percentage of the standardized and normalized rates of cell adhesion and extracellular acidification in a period of 24 h are displayed. The averages of three individual experiments are shown.
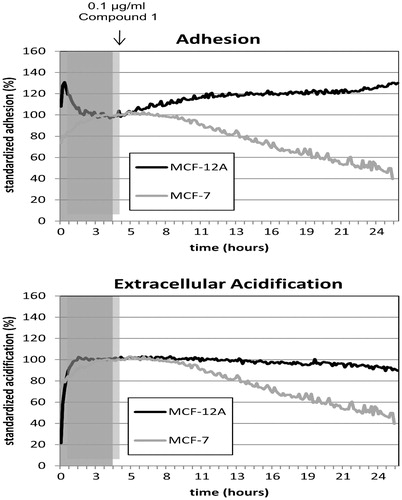
Figure 3. Integrin (β1, β3; α2–α6, αv) and HA receptor expression of MCF-7 and MCF-12A cells after treatment with 0.1 and 1 µg/mL with compound 1 for 48 h measured by flow cytometry. Graphs presenting the relative expression rates normalized to the control measurements with DMSO as negative control. Controls were set to 100% which is represented by 1 in the graph meaning that values below 1 show a reduction of the receptor expression and an increase in the values above 1. The mean values of the measurements refer to the tables below. n = 3, means, statistical significance was determined by the unpaired t-test (*p < 0.05, **p < 0.005, and ***p < 0.001).
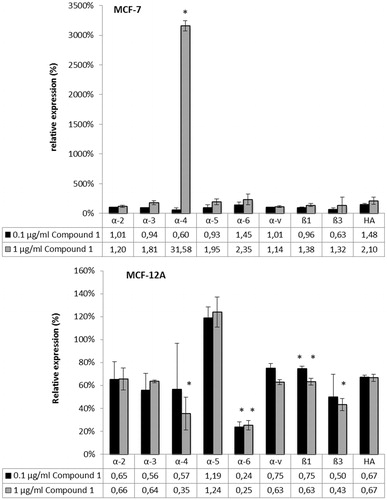
Figure 4. Calculation of the IC50 value of compound 1 on MCF-7 breast cancer cells by MTS tests.
Discussion
The root bark of P. americana, used in the traditional medicine practice as an anticancer agent, was investigated in order to validate the ethnomedicinal claim by herbal practitioners. An alkene lactone with an unusual structure was isolated (compound 1). The electron impact mass spectrometer of compound 1 showed the molecular ion at m/z 266.2000, indicating a molecular formula of C16H26O3. Its IR spectrum exhibited absorptions of hydroxyl and carbonyl groups. The 1H-NMR spectroscopic data indicated the presence of a long hydrocarbon chain (a multiplet at 1.26 and 2.18 ppm representing 9 CH2). The 1H-NMR of the compound showed the presence of two protons signals at δ 4.49 and 4.70 (J = 2.8 and 1.4), indicating the presence of exocyclic methylene moiety. The hydroxyl group resonated at a chemical shift of δ 2.68 which was confirmed by the IR absorption. The carbon resonances have been assigned using 2D-NMR spectra. The 13C-NMR showed the presence in the molecule of 3 quaternary carbons, 2 methine, 11 methylene and 1 terminal methyl group. The chemical structure of 1 was resolved by 1D- and 2D-NMR experiments. Alkene-γ-lactone has been reported in the stems and leaves of P. indica L. (Lauraceae) (Braulio & David, Citation1996). The structure of compound 1 is completely new and unique due to the presence of the methylene group. When all these data were taken into consideration, the structure 1 was assigned to this compound and named 4-hydroxy-5-methylene-3-undecyclidenedihydrofuran-2 (3H)-one.
The cell cycle results revealed that compound 1 induced apoptosis in both cell lines while proliferation was affected in the opposite direction, with the assumption that different signaling and regulation of cellular metabolism of cancerous and non-cancerous cells took place. Notably, MCF-7 cells started rounding and losing their adhesion to the culture surface after treatment with 1 µg/mL of compound 1 while MCF-12A cells stayed attached (not shown). Detachment was also observed by Bionas measurements (). With the Bionas® 2500 analyzing system using the metabolic chip SC 1000, we were able to monitor cell adhesion and extracellular acidification of living cells under the continuous treatment with 0.1 µg/mL of compound 1. Both parameters, adhesion and acidification, are indicators for cancer metabolism and cell fate. Detachment from the extracellular matrix and loss of adhesion is a clear indication for the induction of an apoptotic process that is termed anoikis (Frisch & Francis, Citation1994). Cancer cells often exhibit an altered metabolism with elevated glycolysis, which is due to higher lactate dehydrogenase expression levels leading to increased lactate production (Young & Anderson, Citation2008). Secreted lactate causes extracellular acidification that contributes to tumorigenesis, angiogenesis and tumor cell survival.
In this study, acidification resulted in MCF-7 breast cancer cells changing their metabolism under incubation with compound 1. It is possible that compound 1 reprogrammed cancer cells by reducing glycolysis efficiency. The direct influence on glycolysis and related glycolytic enzymes is not immediately known.
Changes in integrin expression are associated with regulation in cell growth, differentiation and death by providing a dynamic linkage to the extracellular matrix and intracellular actin cytoskeleton (Aoudjit & Vuori, Citation2012). The upregulation of α4-integrin in MCF-7 cells could be due to the direct influence of the compound 1 or to the reaction of the tumorigenic cells losing detachment. The influence of compound 1 on this receptor is not clear and will need further investigation since high α4-levels play a direct role in the acquisition of the invasive phenotype and α4 blocking antibodies reduce the progression of bone metastasis (Lu et al., Citation2011; Woods et al., Citation2003). The down regulation of some integrin receptors in the cell line MCF-12A is not consistent with results got from the Bionas measurements where we could determine increased adhesion levels after continuous treatment with 0.1 µg/mL of compound 1. Probably, compound 1 strengthens the cell to cell and/or cell to matrix adhesion by the regulation of other receptors. However, compound 1 induced significantly cell detachment, lower acidification and proliferation rates as well as high apoptotic rates on MCF-7 breast cancer cells at a starting concentration of 1 µg/mL.
IC50 values determined by biological screening test such as MTS, MTT or XTT should always be confirmed with other assays such as cell cycle measurements (Bernas & Dobrucki, Citation2002; McGowan et al., Citation2011). Nevertheless, compound 1 represents a new, very effective anticancer agent which should be investigated further to show the cellular mechanisms.
Conclusion
The study has led to the isolation of a new compound with very potent anticancer properties on MCF-7 breast cancer cells. This compound contributes at least in part to the antitumor use of root extract of P. americana in ethnomdedicine.
Declaration of interest
There are no conflicts of interest. The authors would like to thank the German Government for the financial support through research grant (FKZ: 107821).
Acknowledgements
We are grateful to Deutsche Forschungsgemeinschaft and Third World Academy of Science DFG-TWAS (2010/12). Special appreciation to Institute of Chemistry, University of Rostock, Germany. The Department of Pharmaceutical Chemistry, University of Benin, Benin City, Nigeria, is also acknowledged. The technical assistance of Petra Seidel, Department of Cell Biology of the University of Rostock is also appreciated.
References
- Adeboye JO, Fajonyomi MO, Makinde JM, Taiwo OB. (1999). A preliminary study on the hypotensive activity of Persea americana leaf extracts in anaesthetized normotensive rats. Fitoterapia 70:15–20
- Adeyemi OO, Okpo SO, Ogunti OO. (2002). Analgesic and anti-inflammatory effects of the aqueous extract of leaves of Persea americana Mill (Lauraceae). Fitoterapia 73:375–80
- Antia BS, Okokon JE, Okon PA. (2005). Hypoglycemic activity of aqueous leaf extract of thoracic rat of Persea americana Mill. Indian J Pharmacol 37:325–6
- Aoudjit F, Vuori K. (2012). Integrin signaling in cancer cell survival and chemo resistance. Chemother Res Pract 28:3181–92
- Baladrin MF, Kinghorn AD, Farnsworth NR. (1993). Plants derived natural products in drug discovery and development. In: Baladrin MF, ed. Human Medicinal Agents from Plants, Symposium Series 534. Washington, DC: American Chemical Society, 2–12
- Bernas S, Dobrucki H. (2002). Mitochondrial and nonmitochondrial reduction of MTT: Interaction of MTT with TMRE, JC-1, and NAO mitochondrial fluorescent probes. Cytometry 47:236–42
- Braulio MF, David T. (1996). Insect antifeedant isoryanodane diterpenes from Persea indica. Phytochemistry 4:229–32
- Engel N, Oppermann C, Falodun A, Kragl U. (2011). Proliferative effects of five traditional Nigerian medicinal plant extracts on human breast and bone cancer cell lines. J Ethnopharmacol 137:1003–10
- Eva JM, Angel GL, Laura P, et al. (2006). A new extract of the plant Calendula officinalis produces a dual in-vitro effect: Cytotoxic antitumor activity and lymphocyte activation. BMC Cancer 6:115–19
- Frisch SM, Francis H. (1994). Disruption of epithelial cell-matrix interactions induces apoptosis. J Cell Biol 124:619–26
- Lu X, Mu E, Wei Y, et al. (2011). VCAM-1 promotes osteolytic expansion of indolent bone micrometastasis of breast cancer by engaging α4β1-positive osteoclast progenitors. Cancer Cell 13:701–14
- McGowan EM, Alling N, Jackson EA, et al. (2011). Evaluation of cell cycle arrest in estrogen responsive MCF-7 breast cancer cells: Pitfalls of the MTS assay. PLoS One 6:e20623, 1--8
- Nebe B, Peter A, Duske K, et al. (2006). Influence of phytoestrogens on the proliferation and expression of adhesion receptors in human and epithelial cells in vitro. Eur J Cancer Prev 15:405–15
- Owolabi MA, Jaja SI, Coker HAB. (2005). Vasorelaxant action of aqueous extract of the leaves of Persea americana on isolated rat uterus. Fitoterapia 76:567–73
- Rebl H, Finke B, Schroeder K, Nebe JB. (2010). Time-dependent metabolic activity and adhesion of human osteoblast-like cells on sensor chips with a plasma polymer nanolayer. Int J Artif Organs 33:738–48
- Thedinga E, Kob A, Holst H, et al. (2007). Online monitoring of cell metabolism for studying pharmacodynamic effects. Toxicol Appl Pharmacol 220:33–44
- Warburg O. (1930). The Metabolism of Tumors. London: Constable
- Warburg O. (1956). On the origin of cancer cells. Science 123:309–14
- WHO (2003). Diet, Nutrition and the Prevention of Chronic Diseases (World Health Organization), Technical Report Series 916. Geneva: WHO
- Woods KM, Grewal NK, Markwart S, et al. (2003). P38MAPK induces cell surface alpha4 integrin down regulation to facilitate erbB-2-mediated invasion. Neoplasia 5:128–34
- Young CD, Anderson SM. (2008). Sugar and fat – That’s where it’s at: Metabolic changes in tumors. Breast Cancer Res 10:202–22