Abstract
Context: Stevia rebaudiana Bertoni (Asteraceae) is an important medicinal plant and is much used due to its zero calories sweetening property. Stevia leaves as well as its extracts and pure compounds are currently used in the preparation of several medicines, food products and neutraceuticals.
Objective: To study the genetic and metabolic variability in S. rebaudiana among accessions of different geographical regions of India using random amplified polymorphic DNA (RAPD) markers and high-performance thin layer chromatography (HPTLC) analysis.
Materials and methods: The RAPD analysis of Stevia rebaudiana (11 accessions) was carried out using 20 random operon primers. Dendrogram was constructed for cluster analysis based on the unweighted pair group method with arithmetic means (UPGMA) using Winboot. The HPTLC analysis of all samples was carried out on silica using acetone:ethyl acetate:water (5:4:1, v/v/v) for fingerprinting and quantification of stevioside and rebaudioside A at 360 nm after spraying with anisaldehyde sulphuric acid.
Results: Ten out of 20 primers screened were found most informative; amplification products of the genotypes yielded a total of 87 scorable bands (67 polymorphic), whereas genetic similarity (GS) coefficient (0.01–0.08) and polymorphism (67.24–92.40%) showed huge variability. Similarly, HPTLC analysis showed large variation among different samples with respect to their presence or absence of metabolite and their concentration.
Conclusion: Out of the 11 Stevia accessions, Delhi and Mohali varieties showed much relatedness with each other and were concluded to be the superior genotype in context to RAPD and HPTLC analysis. The information obtained here could be valuable for devising strategies for cultivating this medicinal plant.
Introduction
Stevia [Stevia rebaudiana Bertoni (Asteraceae)] is a small herbaceous perennial plant (2n = 22) and native to the highlands of Paraguay, where it has been used by aboriginal people as a sweetener for centuries (Lewis, Citation1992). Stevia contains sweet diterpenoidal glycosides: rebaudioside A, rebaudioside C, stevioside and dulcoside in its leaf tissues (Ahmed et al., Citation1980). Among the reported glycosides in Stevia, usually the content of stevioside is the highest (major glycoside) which has been used as sweetener in Japan as well as in other parts of the world. The second major glycoside is rebaudioside A which is sweeter and more delicious than stevioside, so it is used in beverages. Usually, stevioside is the major glycoside, but chemotypes enriched in rebaudioside A have also been reported (Huang et al., Citation1995). Stevioside is about 110–270 times sweeter, while rebaudioside A is 150–320 times sweeter than sucrose. The natural origin of these high potency sweeteners has attracted a great deal of interest in Stevia production and breeding (Yao et al., Citation1999).
Molecular markers have been shown to be useful for diversity assessment in a number of plant species (Robinson, Citation1930). The markers, based on the polymerase chain reaction (PCR) technique, are the most commonly used for this purpose. Several molecular techniques are available for detecting genetic differences within and among cultivars (Soejarto et al., Citation1982). Randomly amplified polymorphic DNA (RAPD) analysis is a PCR-based procedure (Williams et al., Citation1990) used widely for genetic polymorphism, genetic variations, map construction and linkage analysis because of their simplicity and relatively low cost (Reiter et al., Citation1992; Staub et al., Citation1996). The RAPD method has advantages over other kinds of DNA-based genetic markers: it is relatively quick, easy to perform, comparatively cheap, highly informative, need no information of template DNA sequence and synthesis of specific markers more amiable to automation than conventional techniques and required only nanogram quantities of DNA. The dominant polymorphism between individual samples/races is indicated by the presence or absence of a particular RAPD fragment and extensively applied for assessing genetic diversity and relationship measures in various plant species (Bauvet et al., Citation2004; Upadhyay et al., Citation2004).
Different types of molecular work have been reported on S. rebaudiana, and the first foundation for Stevia on molecular breeding was laid with the use of RAPD markers to construct a genetic linkage map of the Stevia genome using segregation data from a pseudo test-cross F1 population (Yao et al., Citation1999). Lately, Moktaduzzaman and Rahman (Citation2009) developed optimal concentration of auxins and cytokinins for regeneration of S. rebaudiana and analysis of somaclonal variations by RAPD markers. Intersimple sequence repeats (ISSR) molecular marker has been employed to determine the phylogenetic relationships among six Stevia accessions (Heikal et al., Citation2008). In this investigation, an attempt has been made to develop an efficient protocol to evaluate the genetic and chromatographic variability using RAPD and high-performance thin layer chromatography (HPTLC) among 11 different Stevia accessions (cultivated as well as wild variety) collected from Indian subcontinent, which has not been carried out previously.
Materials and methods
Plant material
Samples of Stevia rebaudiana were collected in the months of August–September (2011) from different regions of India: Hamdard University, herbal garden, Delhi, cultivated variety; I.I.I.M. Jammu (a) cultivated variety and Jammu (b) wild variety; Baba Ram Dev Ashram garden, Haridwar, cultivated variety; F.R.I. Dehradun (a) cultivated variety and Dehradun (b) wild variety; NIPER, Mohali, Chandigarh, cultivated variety; Shri Krishna herbal garden, Indore, cultivated variety; Keshal Nursery, Surat, cultivated variety; Deepak Trading Co., Bangalore, cultivated variety; Chachiyan village, Kangra, wild variety. Approximately, 250 g fresh sample from each place was collected and kept in an ice box. These were further used for DNA extraction within 72 h, whereas remaining samples were air-dried and used for phytochemical analysis. Collected plant samples were identified by Dr. Altaf Ahmad, Botanist, Department of Botany, Jamia Hamdard, and authenticated in Bioactive Natural Product Laboratory by running TLC using marker compounds of all plant sample. The voucher specimens were deposited in the Bioactive Natural Product Laboratory.
Reagents and chemicals
The composition of various buffers and chemical/reagents used were of molecular biology grade as given below:
N,N,N,N-cetyl trimethyl ammonium bromide (CTAB) extraction buffer (100 mL) (Himedia, Mumbai, India): Tris-HCl (100 mM), ethylene diamine tetraacetic acid disodium salt (Na-EDTA) (20 mM), CTAB (2% w/v), NaCl (1.4 M)
Precipitation buffer (100 mL) (Himedia, Mumbai, India): Tris-HCl (50 mM), Na-EDTA (10 mM), CTAB (1% w/v)
High salt TE (Tris EDTA) buffer (100 mL) (Himedia, Mumbai, India): Tris-HCl (10 mM), Na-EDTA (1.0 mM), NaCl (1.0 M)
10% CTAB (100 mL) (Himedia, Mumbai, India): CTAB (10 g), NaCl (0.7 M)
Other chemical reagents (Merck, Mumbai, India): chloroform, isoamyl alcohol (24:1, v/v), isopropanol, absolute ethanol (80% ethanol), 2-mercaptoethanol (2-ME), liquid nitrogen, sodium acetate
DNA extraction procedure
The extraction procedure of DNA from the leaves of S. rebaudiana collected from different geographical regions of Indian subcontinent for RAPD analysis is as follows: CTAB extraction buffer (500 µL) was heated to 70 °C in a pre-autoclaved 2.0 mL microtubes (Tarson, Kolkata, India). 2% mercaptoethanol (10 µL) was added to this mixture, just before the start of the extraction process.
Fresh plant materials of all the samples (0.5 g, each) were frozen in liquid nitrogen (−196 °C) in a sterile mortar and grounded to a fine powder, which was incubated at 70 °C for 1 h in a water bath. The mixture was regularly mixed by gentle inversion and cooled in the Eppendorf tube for 5 min at room temperature. The chloroform:isoamyl alcohol (24:1, v/v) was added in equal volumes to the homogenate and mixed gently by inversion, followed by centrifugation at 10,000 rpm for 10 min.
The upper phase was pipetted out into a sterile Eppendorf tube. This step was repeated twice with the addition of 10% CTAB in second repeated step, and 20 mL of CTAB precipitation solution was added at 25 °C to the recovered supernatant, which was allowed to stand for 0.5 h. A precipitate was formed at this stage and the mixture was centrifuged at 8000 rpm for 15 min.
The DNA pellet was recovered by decanting the supernatant, which was then dissolved in 500 µL of high-salt TE buffer. The DNA was then precipitated by the addition of ethanol and kept for 1 h and centrifuged for 15 min at 15 000 rpm.
The DNA pellet was recovered by decanting the supernatant followed by washing in 70% ethanol and then in 90% ethanol. After drying, the pellet was re-dissolved in 200–500 µL of water. The equal volumes of phenol:chloroform was added (1:1, v/v) and shaken well, followed by centrifugation at 13 000 rpm for 10 min. The supernatant was pipetted out with the addition of one-tenth part of 3.0 M sodium acetate solution and Eppendorf tube was filled with ethanol. In order to precipitate the DNA, it was further kept at −20 °C for 1 h.
A precipitate was formed at this stage, which was centrifuged at 12 000 rpm and 4 °C for 15 min. Pellet formed was dissolved in 50 µL sterile milli-Q water and stored at −20 °C for further application.
DNA quantification
The quantification of genomic DNA was achieved by using a spectrophotometer (UV–1601A, spectrophotometer; Shimadzu, Kyoto, Japan), by using 1.0 µL of diluted DNA (1:10, v/v) on the basis of UV absorption at 260 nm (optical density 260) with one optical density equivalent to 50 µg/mL of genomic DNA. The optical density was also taken at 280 nm wavelength to check the level of purity of isolated DNA by the ratio of absorbance at 260 nm/280 nm (). DNA purity was further tested by running the extracted genomic DNA samples on 0.8% agarose gel stained with 2.0 μL ethidium bromide in 1 × TAE (Tris-acetate-EDTA) buffer. A DNA molecular weight marker (GeneRuler™ DNA Ladder Mix; Genei, Bangalore, India) was included on each gel. The gel images were viewed and stored in gel documentation system (AlphaImager EC; Alpha Innotech, San Leandro, CA).
Table 1. Optical density and content of DNA isolated from different accessions of S. rebaudiana.
PCR amplification
RAPD analysis was carried out with random primers (Eurofins MWG Operon, Ebersberg, Germany). For each primer, 15 µL amplification reaction mixture was optimized as minimum effective volume after a trial from 10 to 50 µL (increased volume influence the cost of PCR ingredients, whereas decreased volume affects amplification). The PCR amplifications were performed in a Bio-Rad 96-well gradient thermal cycler (BIO-RAD, Hercules, CA), under optimized conditions. The amplification products for all plant accessions were resolved on 2.8% agarose gel.
Scoring and data analysis
Data analysis was done using AlphaImager EC software. For each genotype, each fragment/band that was amplified using RAPD primers was treated as a unit character. Unequivocally scorable and consistently reproducible amplified DNA fragments were transformed into binary character matrices “1” for presence and “0” for absence. The commercial software package NTSYS-PC (Exeter Software, Setauket, NY) (Rohlf, Citation1989) was used to develop similarity matrices. These data were then used to construct dendrogram for cluster analysis based on the unweighted pair group method with arithmetic means (UPGMA) using Winboot (IRRI, Los Baños, Philippines) (Yap & Nelson, Citation1996).
Metabolic profiling
The metabolic profiling of Stevia was carried out using methanol extracts by HPTLC analysis to check the metabolic diversity among the samples collected from different regions of the Indian subcontinent.
Preparation of standard and sample solution
The stock solutions of stevioside and rebaudioside A were prepared in methanol (1.0 mg/mL). The samples were prepared by weighing 500 mg of each of powdered drug and macerating them separately in 25 mL of methanol for 4 h. The macerated extracts were sonicated for 30 min. The methanol extract was then filtered through Whatman filter paper No. 41 to remove any insoluble components and concentrated under vacuum. The residue was taken into 5.0 mL volumetric flask and volume was adjusted using methanol.
HPTLC instrumentation and general conditions
The samples were spotted in the form of band (3.0 mm) with a Camag microlitre syringe on TLC aluminium plate pre-coated with silica gel 60 F-254 (20 × 10 cm with 0.2 mm thickness; E. Merck, Darmstadt, Germany), using a Camag Linomat V sample applicator (Muttenz, Switzerland). A constant application rate of 120 nL/s was employed, and space between two bands was 8.0 mm. The slit dimension was kept at 3.0 × 0.20 mm and 20 mm/s scanning speed was employed for scanning. The development was carried out in a linear ascending manner, in a twin trough glass chamber (20 × 10 cm) saturated with mobile phase composed of acetone:ethyl acetate:water (5:4:1, v/v/v). The optimized chamber saturation time for the mobile phase was 20 min at room temperature and the chromatogram was developed up to the length of 85 mm. Subsequent to the development, the TLC plate was air-dried and sprayed with anisaldehyde sulphuric acid reagent. The plate was kept in an oven at 110 °C for 5 min followed by air drying and further scanned at 360 nm using a Camag TLC scanner III with a tungsten lamp.
Results and discussion
Genetic variability studies in S. rebaudiana collected from different locations of India have been carried out using RAPD markers. DNA was isolated by the CTAB method (Doyle & Doyle, Citation1990). Measuring absorbance at 260 nm and at 280 nm provides validation of the purity of nucleic acid samples: A260/A280 ratios above 1.8 for DNA or 2.0 for RNA indicate pure samples; lower ratio values indicate the presence of protein or other contaminants (Gallagher, 1989). The ratios of optical density of 260/280 of all samples were found in the range of 1.7–1.9, which indicated high purity of DNA (). Twenty random primers of different groups were screened using hot-start PCR for the amplification of DNA using optimized protocol ( and ). Out of 20 decamer random primers used for 11 representative genotypes, 10 primers did not produce any amplification at all in initial screening, while remaining 10 primers showed amplified polymorphic patterns. These primers were then used for RAPD analysis of all the 11 accession samples. Amplification products of the genotypes with these 10 primers yielded a total of 87 scorable bands, out of which 67 were polymorphic (). The size of the amplification products ranged from 230 to 1500 bps. The highest numbers of bands (80) were obtained with primers OPA-5, while the lowest numbers (48) were obtained with primer OPA-1 ().
Figure 1. RAPD amplification pattern using the primers OPA 1. M, molecular size markers. Lane numbers correspond to places from which Stevia rebaudiana is collected: 1, Bangalore; 2, Dehradun (a); 3, Dehradun (b); 4, Delhi; 5, Haridwar; 6, Indore; 7, Jammu (a); 8, Jammu (b); 9, Kangra; 10, Mohali; 11, Surat.
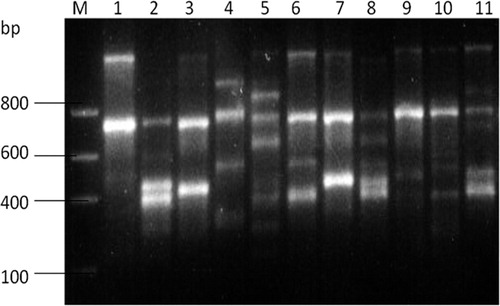
Table 2. Optimization of composition of 15 µL amplification reaction mixture containing PCR ingredients.
Table 3. Optimized conditions for PCR amplifications.
Table 4. Polymorphism exhibited by RAPD primers in S. rebaudiana.
Different primers showed variation in their ability to produce polymorphism. The polymorphism ranged from 67.24 to 92.40%. Primer OPA-4 revealed the highest polymorphism (92.40%) while primer OPA-10 exhibited the lowest polymorphism (67.24%). The 10 polymorphic primers exhibited variation with regard to % monomorphism and of unique product. The primer OPA-10 showed no monomorphism, while the highest % monomorphism was exhibited by the primers OPA-4. The primers OPA-4 and OPA-5 showed the highest number of unique product and the primer OPA-10 showed no unique product. The commercial software package NTSYS-PC (Rohlf, Citation1989) was used to develop similarity matrices given in (). These data were then used to construct dendrogram () for cluster analysis based on the UPGMA using Winboot, in order to study the correlation between populations. It showed distinct separation of the collected accessions from locations into two major clusters. Varieties such as Bangalore, Dehradun (a), Dehradun (b), Delhi, Mohali and Surat showed much relatedness with each other. Also, varieties such as Haridwar, Jammu (a), Jammu (b), Indore and Kangra showed similar relatedness. Therefore, clustering results of different accessions suggested that S. rebaudiana undergoes genetic variation. Genetic diversity refers to the variation at the level of individual genes, i.e. polymorphisms. RAPD analysis has been used for genetic diversity assessment and for identifying germplasm in a number of plant species (Gwanama et al., Citation2000; Kapteyn & Simon, Citation2002; Welsh & McClelland, Citation1990).
Figure 2. UPGMA dendogram showing the relationships among the eleven accessions of Stevia varieties.
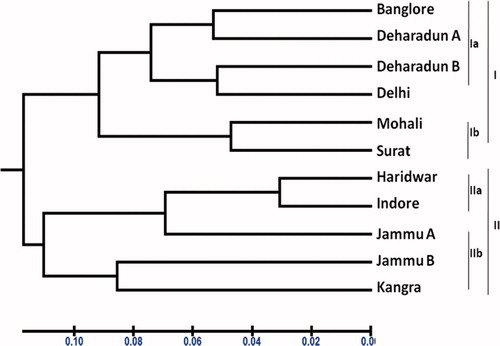
Table 5. Similarity matrix table of 11 samples of S. rebaudiana.
The development of solvent system for chromatographic (HPTLC) analysis was carried out by using different solvents in hit and trial method. The solvent system composed of acetone, ethyl acetate and water produces some separation when tried in different ratios but mobile phase composed of acetone:ethyl acetate:water (5:4:1, v/v/v) gave good resolution with compact spots of active markers stevioside and rebaudioside A at Rf 0.31 and Rf 0.21, respectively.
The samples were applied in triplicate and developed chromatogram was air-dried, derivatized () and scanned as per the method at 360 nm. The samples showed large variations in between different samples with respect to presence or absence of particular constituents as well as their relative abundance () and (). The results of HPTLC fingerprint analysis showed that compound stevioside and rebaudioside A, Rf 0.31 ± 0.02 and 0.21 ± 0.02, respectively, were found present in all samples along with compound F (Rf 0.65 ± 0.02), whereas compound E (Rf 0.59 ± 0.02) and D (Rf 0.50 ± 0.02) were also present in all samples except Bangalore and Haridwar varieties, respectively. Similarly, relative % abundance of compound E (22.34%) was highest in Surat, whereas compound H (0.91) was lowest in Dehradun variety. The content of stevioside and rebaudioside A was found in the range of 19.77–37.50 and 6.62–25.31 mg/g of dried plant materials, respectively, () using the HPTLC method (Chester et al., Citation2012). The highest concentration of stevioside was reported in Mohali and lowest in Bangalore, whereas the highest concentration of rebaudioside A was found in Jammu (b) and lowest in Surat varieties.
Figure 3. HPTLC chromatogram of samples of Stevia extract in daylight after spraying with anisaldehyde-sulphuric acid solution.
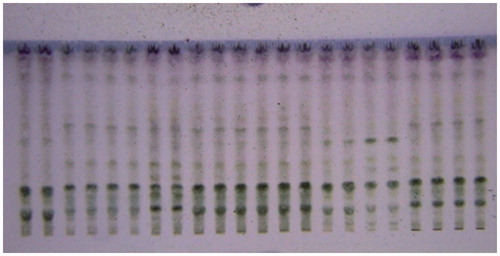
Figure 4. HPTLC chromatogram of different Stevia samples at 360 nm showing peaks of different metabolites.
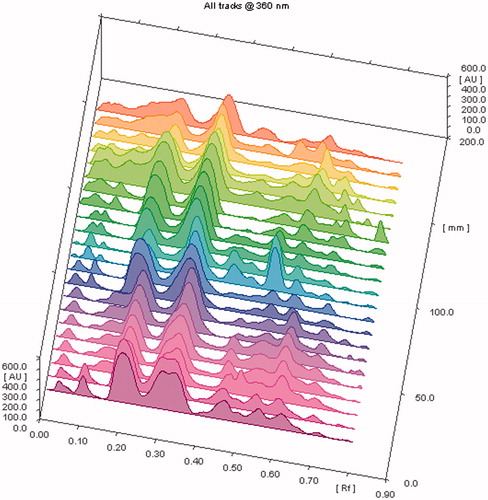
Table 6. Metabolic fingerprinting of S. rebaudiana using HPTLC showing number of spots and their Rf value data from different samples.
Table 7. Content of stevioside and rebaudioside A (mg/g) in different samples of Stevia.
Conclusion
Analysis of RAPD could be useful to detect the genetic diversity of S. rebaudiana among 11 different varieties from Indian subcontinent. From this study, it was understood that each location varied with respect to environmental factors and genetic parameters. Thus, by analysing the genetic variability, we are able to identify the elite population. Genetic diversity and clustering pattern of 11 Stevia varieties studied with the help of dendogram and similarity matrix, which was generated from RAPD data, revealed that out of 11 Stevia varieties, Delhi, Mohali, Bangalore, Dehradun (a), Dehradun (b) and Surat varieties showed significant relatedness with each other and were concluded to be the superior genotype. Also, varieties from Haridwar, Jammu (a), Jammu (b), Indore and Kangra showed similar relatedness when compared with the above varieties. The information obtained here could be valuable for devising strategies for the cultivation of S. rebaudiana. The metabolic fingerprinting of different accessions again proved the superiority and similarity in metabolite content in case of Delhi and Mohali samples.
Declaration of interest
The authors report no conflicts of interest. The authors alone are responsible for the content and writing of this article.
References
- Ahmed MS, Dobberstein RH, Farnsworth NR. (1980). Stevia rebaudiana: Use of p-bromophenacyl bromide to enhance ultraviolet detection of water-soluble organic acids (steviolbioside and rebaudioside B) in high-performance liquid chromatographic analysis. J Chromatogr A 192:387–93
- Bauvet JM, Fontaine C, Sanou H, Cardi C. (2004). An analysis of the pattern of genetic variation in Vitellaria paradoxa using RAPD marker. Agroforest Syst 60:61–9
- Chester K, Tamboli ET, Singh M, Ahmad S. (2012). Simultaneous quantification of stevioside and rebaudioside A in different Stevia samples collected from Indian subcontinent. J Pharm Bioallied Sci 4:276–81
- Doyle JJ, Doyle JL. (1990). Isolation of plant DNA from fresh tissue. Focus 12:13–15
- Gallagher SR. (1989). Quantitation of DNA and RNA with absorption and fluorescence spectroscopy. In: Ausubel FAR, Brent RE, Kingston DD, et al., eds. Current Protocols in Molecular Biology. New York, USA: John Wiley & Sons, A3D1–5
- Gwanama C, Labuschagne MT, Botha AM. (2000). Analysis of genetic variation in Cucurbita moschata by random amplified polymorphic DNA (RAPD) markers. Euphytica 113:19–24
- Heikal A, Hadia OM, Badawy Hafez AM. (2008). Genetic relationships among some Stevia (Stevia rebaudiana Bertoni) accessions based on ISSR analysis. Res J Cell Mol Biol 2:1–5
- Huang YS, Guo AG, Qian Y, et al. (1995). Studies on the variation of steviosides content and selection of type R-A in Stevia rebaudiana. J Plant Res Environ 4:28–32
- Kapteyn J, Simon JE. (2002). The use of RAPDs for assessment of identity, diversity, and quality of Echinacea. In: Janick J, Whipkey A, eds. Trends in New Crops and New Uses. Alexandria (VA): AHS Press, 509–13
- Lewis WH. (1992). Early uses of Stevia rebaudiana (Asteraceae) leaves as a sweetener in Paraguay. Econ Bot 46:336–7
- Moktaduzzaman M, Rahman SMM. (2009). Regeneration of Stevia rebaudiana and analysis of somaclonal variation by RAPD. Biotech 8:449–55
- Reiter RS, Williams J, Feldmann KA, et al. (1992). Global and local genome mapping in Arabidopsis thaliana by using recombinant inbred lines and random amplified polymorphic DNAs. Proc Natl Acad Sci USA 89:1477–81
- Robinson BL. (1930). Contributions from the Grey Herbarium of Harvard University. Cambridge: The Grey Herbarium of Harvard University
- Rohlf FJ. (1989). NTSYS: Numerical Taxonomy and Multivariate Analysis System. New York: Exeter Softwares
- Soejarto DD, Kinghorn AD, Fransworth NR. (1982). Potential sweetening agents of plant origin. J Nat Prod 45:590–9
- Staub JE, Serquen FC, Gupta M. (1996). Genetic markers, map construction, and their application in plant breeding. Hort Sci 3:729–41
- Upadhyay A, Jayadet K, Manimedkalai R, Parthasarathy VA. (2004). Genetic relationship and diversity in Indian coconut accessions based on RAPD markers. Sci Hortic 99:353–62
- Welsh J, McClelland M. (1990). Fingerprinting genomes using PCR with arbitrary primers. Nucleic Acids Res 18:7213–18
- Williams JGK, Kubelik A, Livak KJ, et al. (1990). DNA polymorphism amplified by arbitrary primers are useful as genetic marker. Nucleic Acids Res 18:6531–5
- Yao Y, Ban M, Brandle J. (1999). A genetic linkage map for Stevia rebaudiana. Genome 42:657–61
- Yap VI, Nelson RJ. (1996). Winboot: A Program for Performing Bootstrap Analysis of Binary Data to Determine the Confidence Limits of UPGMA-Based Dendrograms. IRRI Discussion Paper Series No. 14. Manila, Philippines: International Rice Research Institute