Abstract
Context and objective: Tobacco smoke and nitrostable foods containing N-methyl N-nitrosourea (MNU) are among the primary causes of liver cancer. To substantiate the beneficial claims ascribed to Aegle marmelos (L.) Corrêa (Rutaceae), the hepatoprotective potential of its leaf extract was studied using an MNU-induced hepatocarcinogenesis model in Balb/c mice.
Materials and methods: After dose selection, 40 mice were randomly assigned to 4 groups: I (control), II (intraperitoneally (i.p.) primed with 50 mg/kg MNU), III (100 mg/kg A. marmelos hydroalcoholic extract (HEAM) i.p.) and IV (MNU + HEAM, i.p.). Inflammatory (IL-1β, IL-6), anti-inflammatory (IL-4) cytokine expression, apoptosis (Bcl-2) and tumor-related (p53, c-jun) genes were assessed at mRNA level. HEAM effects on hematological parameters were examined.
Results and discussion: HEAM treatment decreased IL-1β, IL-6, Bcl-2 and c-jun respectively expressions by 90, 25, 53 and 30%, respectively. p53 and IL-4 expression was up-regulated by 1.5- and 2-fold. MNU decreased hemoglobin concentration (25%), lymphocyte count (42%) and increased leukocyte (100%), platelet (4-fold), neutrophil (43%), monocyte (10-fold) and eosinophil (10-fold) counts in Group II mice while HEAM modulated the same parameters by −7%, −21%, +24%, +3-fold, +12%, +3-fold and +4-fold, respectively, in MNU-induced mice compared to control. HEAM protective effect was confirmed by Raman spectroscopy where the MNU-induced peak at 1252 cm−1 was normalized. DNA fragmentation data suggest apoptosis as one of the protective mechanisms of HEAM.
Conclusion: The hepatoprotective, anti-carcinogenic and immunomodulatory effects of A. marmelos extract indicate potential beneficial effects in cancer therapy.
Introduction
N-Methyl N-nitrosourea (MNU) is a potential liver carcinogen widely present in tobacco smoke and various types of nitrostable foods (Hotckiss, Citation1989). It acts as an alkylating agent reacting with nucleophilic nitrogen and oxygen in DNA bases creating mutagenic lesions (Singer & Kusmierek, Citation1982) ultimately leading to cancer initiation (Saffhill et al., Citation1985). MNU activates inflammatory cytokines (IL-1β, IL-6) in hepatic cells with increased NFкB expression resulting in potential hepatocarcinogenesis in Balb/c mice (Verma et al., Citation2012). Given that current therapies for cancer that include radiation, chemotherapy, immunosuppression and surgery have high morbidity and mortality rates, there is an imperative need for new treatment modalities. The understanding of molecular changes that underlie cancer development offers the prospect of utilizing functional supplements from traditional medicinal plants to augment therapies that can specifically target malfunctioned genes and signaling pathways in cancer. Chemoprevention strategies that are increasingly advocated involve the use of phytochemicals, functional foods, nutraceuticals and even whole plant extracts to prevent, arrest or reverse the cellular and molecular processes of carcinogenesis (Neergheen et al., 2010).
Herbal extracts and their bioactive components, mainly because of the synergistic effects of the cocktail of plant metabolites and their multiple points of intervention in chemoprevention, have therapeutic roles in pharmaceutical care and in the management of cancer. Typical examples include paclitaxel (taxol) from Taxus brevifolia L. (Taxaceae), vincristine (Oncovin) from Catharanthus roseus G.Don (Apocynaceae), podophyllotoxin from Podophyllum peltatum L. (Berberidaceae) and camptothecin from Camptotheca acuminata Decne (Conaceae) (Nyssaceae) (Cragg & Newman, Citation2005). Aegle marmelos (L.) Corrêa (Rutaceae) is an aromatic tree indigenous to India, Bangladesh, Burma and Sri Lanka. Known as “vilvam” in Tamil, “bael” in Hindi, “sripal” or “bilwa” in Sanskrit and baeltree in English (Nadkarni, Citation1986), it is distributed mainly within the sub-Himalayan forests, in dry hilly places ascending to 4000 ft. Since ancient times it is called Shivadume, the tree of Lord Shiva as its leaves are offered to the gods Shiva and Parvathi. Aegle marmelos has an important place in indigenous systems of medicine (Lampronti et al., Citation2003). It has been used as a herbal medicine in Ayurvedic, Unani and Siddha systems of medicine in India, Bangladesh and Sri Lanka (Sharma et al., Citation2011). The plant’s reported multitude therapeutic benefits include anti-inflammatory, anti-pyretic, analgesic (Arul et al., Citation2005; Shankarananth et al., Citation2007), anti-diabetic (Arumugam et al., Citation2008; Kamalakkannan et al., Citation2003; Kesari et al., Citation2006) and anticancer properties (Gangadevi & Muthumary, Citation2008). Various studies have emphasized its anti-cancer activities from different perspectives. As such, Lampronti et al. (Citation2003) reported that the alcoholic plant extract, more particularly the active derivatives therein (butyl p-tolyl sulfide, 6-methyl-4-chromanone and butylated hydroxyanisole) were able to inhibit the in vitro proliferation of human tumor cell lines, including the leukemic K562, T-lymphoid Jurkat, Blymphoid Raji, erythroleukemic HEL, melanoma Colo38, and breast cancer MCF7 and MDAMB-231 cell lines.
The objective of the work reported in this article is to complement existing data on established cancer traditional uses of A. marmelos by emphasizing the effect of a hydroalcoholic extract of A. marmelos (HEAM) on the regulation of inflammatory cytokines (IL-1β, IL-6), anti-inflammatory (IL-4), other tumor-related genes (p53, Bcl-2) expression in MNU-induced Balb/c mice. Furthermore, the immunomodulating effect of the leaf extract on a number of hematological parameters was examined in vivo and the study concluded by assessing the alteration of DNA bases and backbone structure by use of Laser Raman spectroscopy.
Materials and method
Chemicals and reagents
N-methyl N-nitroso urea (MNU) was purchased from Sigma (St. Louis, MO). Trizol (Cat. No.15596-026) was purchased from Invitrogen (Carlsbad, CA), while DNA ladder was from Fermentas (Fisher Scientific, Pittsburgh, PA). Two-step RT-PCR kit (#78355) was from USB Corporation (Cleveland, OH). Tris-saturated phenol (#105432) was from Genei (Bangalore, India) and MTT was from Hi-media (#TC191-1G) (Mumbai, India). All other reagents were of analytical grade.
Preparation of the plant extract
Fresh mature leaves of A. marmelos were collected in October from the Botanical Garden, Department of Botany, Banaras Hindu University, Varanasi. The plant material was authenticated by Prof. R. S. Updhadhaya (Taxonomist), Department of Botany, BHU, Varanasi, India. The leaves were washed three times with running tap water and once with distilled water, shade-dried, powdered and stored for further use. The hydro-alcoholic extract was prepared by mixing 50 g of dried powder with 500 ml of 50% ethanol and stirred at 37 °C for 72 h. The mixture was then centrifuged and filtered. The filtrate was freeze-dried and stored at 4 °C for future use. Aliquot extracts were dissolved in normal saline (PBS) for the treatment in animals.
Experimental design
Balb/c mice of either sex were used for the experiments and housed under standard conditions (20 ± 2 °C; 65 ± 15% relative humidity). One-hundred animals of the same age (7 weeks) and weight (20 ± 2 g) were selected for the study. The mice were routinely examined for any symptoms of ill health and records of body weight or any visible morphological changes were noted. The animals were studied 24 h after the last dose. Body weight gain (percentage) and relative organ weight (organ weight/100 g of body weight) of kidney, liver, spleen and thymus were determined for each animal. The mice were sacrificed at scheduled periods and complete autopsies were performed. Liver samples were stored and used for RNA, DNA and protein isolation. The procedures were in accordance with the rules and regulations of the Banaras Hindu University Ethical Committee (Ethical clearance reference: Dean/2008-09/336 IMS BHU).
Dose selection
The dose selection of HEAM was first determined as follows: 60 mice were divided equally in six groups, Group I received normal saline [5 ml/kg body weight (b.w.)] Group II group was treated with only MNU (50 mg/kg b.w. in saline) and groups III, IV, V and VI were treated with the plant extract at a concentration of 50, 100, 200 and 400 mg/kg body weight. These concentrations were selected according to the previous reported literature (Jagetia et al., Citation2005). The experimentation period was 8 weeks.
Anti-cancer study
Forty mice were used with 10 of them randomly assigned to each group. Group I was primed intraperitoneally (i.p.) with PBS 5 ml/kg b.w., Group II was primed with MNU (50 mg/kg b.w.) dissolved in PBS while HEAM at 100 mg/kg b.w. was used in Group III. This concentration was found to be most convenient following the dose selection exercise. Group IV was first primed with MNU for 1 month, followed with HEAM (100 mg/kg b.w.) for 28 weeks.
MTT assay
Cell viability, following extract treatment, was measured by the modified tetrazolium salt 3-(4,5-dimethylthiozol-2-yl)-2,5-diphenyltetrazolium bromide (MTT) assay on human prostate cancer cell line (DU 145), which was maintained in RPMI 1640 supplemented with 1% streptomycin and 10% fetal bovine serum (FBS) at 37 °C in a humidified incubator with 5% CO2. Briefly, DU 145 cells were seeded at a density of 3–5 × 10³ cells per well of 96-well culture plate in 200 μl medium. After an overnight incubation, the medium was replaced by a fresh one containing 20 μl of HEAM at varying concentration (50, 100, 200 μg/ml) to a final volume 150 μl. At the end of the treatment period (48 h), 0.025 ml of MTT solution (5 mg/ml in phosphate-buffered saline pH 7.2) was added to each well and incubated for 4 h at 37 °C. The medium was then removed and 0.1 ml of DMSO was added. After a gentle agitation and incubation at 37 °C, the optical densities at 590 nm were measured using a BioRad 3550-UV microplate reader (Biorad, Hercules, CA). Experiments were repeated four times in triplicates.
Reverse transcription polymerase chain reaction
RNA was isolated from liver tissue on the same day using Trizol, according to the manufacturer’s instructions. The amount and relative purity of the extracted RNA was estimated by nano-drop spectrophotometer at 260/280 nm and integrity was checked on a 1.5% agarose gel. The cDNA from both the RNA samples (isolated from liver of Balb/c mice) was synthesized as per the kit protocol (USB, #78355). Briefly, 2 μg of total RNA was mixed with 1 μl of M-MLV Reverse Transcriptase (25×), 25 μM Oligo (dT), 10 mM nucleotide mix and incubated at 42 °C for 30 min. The amplification of pro-inflammatory cytokines (IL-1β, IL-6), IL-4, anti-apoptotic gene (Bcl-2) and tumor suppressor gene (p53) was performed using gene specific primers listed in . β-Actin was used as internal control. The PCR reaction was carried out with 50 μl containing 10 mM dNTP mix, 20 μM of 5′ upstream and 3′ downstream gene specific primer of p53, Bcl-2 and cytokine (IL-1β, IL-6) including IL-4. The conditions of the amplification reaction are given in . The amplified products (10 μl) were resolved on a 2.0% agarose gel containing 0.5 mg/ml ethidium bromide in TAE buffer. PCR products were visualized using an Alpha imager analysis system.
Table 1. Set of specific genes primer.
DNA isolation and degradation assay
DNA from the liver samples of all the experimental mice were isolated using a standard phenol-chloroform protocol (Somasundaram et al., Citation2002): (i) lysis buffer (LB): (0.3 M sucrose, 25 mM Tris base pH 8, 5 mM EDTA pH 8), (ii) incubation buffer: (50 mM Tris base pH 8, 25 mM EDTA pH 8, 100 mM NaCl). Tissue (50 mg) was lysed in lysis buffer and centrifuged at 20 °C at 10 000 rpm for 10 min. The supernatant was decanted and the pellet resuspended in incubation buffer at 37 °C for overnight. Tris saturated phenol:chloroform:isoamyl alcohol: 25:24:1 was added to the tube and the latter centrifuged at 10 000 rpm at 20 °C for 10 min. The supernatant was removed and the pellet resuspended in sodium acetate and incubated for 2 h and centrifuged at 10 000 rpm at 4 °C for 10 min. The DNA pellet was then washed with 70% alcohol and resuspended in TE buffer and used for DNA degradation assay and for further use. The DNA pellet was resuspended in H2O or double distilled water (DDW) and incubated with RNase A (40 mg/l) at 37 °C for 1 h before electrophoretic separation in a 1.5% TAE agarose gel with 100 bp of DNA ladder (Fermentas).
Hematological assays
Prior to cervical dislocation of mice, blood samples were collected between 8.00 and 10.00 a.m. after overnight fasting and dispensed in EDTA-K2 containing tubes (Sarstedt, Germany) for hematological studies. Red blood cell (RBC) count, hemoglobin concentration and white blood cell count including lymphocytes, neutrophils, eosinophils and platelet counts were performed.
Raman analysis
DNA isolated from the liver of Balb/c mice by standard methods was used for Raman spectral analysis and the spectra of all four experimental DNA samples were recorded on a micro-Raman setup from Renishaw, UK, equipped with a grating of 1800 lines/mm and a peltier cooled CCD. The GRAM-32 software was used for data collection. DNA (10 μl) was placed in a quartz cell on an automated X–Y stage below the Olympus long distance 50× microscope objective. The accumulation time for one window was selected as 60 s and 3 spectra were accumulated in each window. With these experimental parameters, reasonably good quality Raman spectra were obtained. In one window, approximately 800 cm−1 regions were covered. The resolution of the spectrometer was slightly better than 1 cm−1. A microscope (Olympus, Model: MX50 A/T) was attached to the spectrometer. It focused the laser light onto the sample and collected the scattered light at 180° scattering geometry. The 514.5 nm wavelength line of Ar+ laser was used as an excitation source for DNA samples. The recorded data were first saved in “.spc” extension files and were then converted to ASC II files. The data in ASC II files are compatible with Origin, Spectra Calc and Excel, which were used for further data analysis. The Raman spectra were recorded repeatedly to ensure reproducibility of the results.
Results
Dose selection
shows the effect of varying concentrations (0, 50, 100, 200 and 400 mg/kg b.w.) of HEAM on the body weight of MNU primed Balb/c mice for a period of 8 weeks. The initial body weight was relatively unchanged (20 ± 2 g) (p < 0.05) for all animals. Overall, 50 and 100 mg/kg b.w. of the extract were found to be the most suitable concentrations for growth with the 100 mg/kg b.w. dose being most effective with an increase in body weight of 20% and 60% after 3 and 8 weeks, respectively. This dose was therefore retained for further experimentation. The MNU-treated group experienced a 30% decreased in body weight after 8 weeks, while the 200 and 400 mg/kg concentrations showed abnormal decreases in body weight compared to normal and the 400 mg/kg concentration being lethal to the mice as from the 6th week ().
Figure 1. (A) Dose selection: The effect of varying concentrations of HEAM (50, 100, 200, 400 mg/kg body weight) and MNU on body weight of Balb/c mice were compared to control (PBS) during an 8-week period. A total of 100 mg/kg body weight dose was found suitable and was therefore retained for subsequent studies. (B) Effect of HEAM (100 mg/kg body weight) and MNU on body weight increase of balb/c mice Aegle Marmelos compared to control (PBS) for period of 28 weeks.
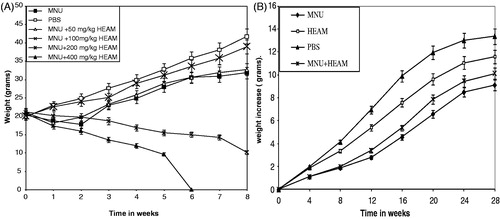
shows the effect of MNU and HEAM on the body weight increase in the different experimental groups for a period of 28 weeks. During this period, all the animals were routinely checked for their diet consumption and water intake. At the end of the experimental period, Group II (MNU) animals had a body weight decrease of 40% compared to controls. Contrary to the mice in the control (PBS) or extract-treated groups (III and IV), they clearly showed an uneven shedding of hair, inactiveness and became thin in appearance. Compared to the MNU-treated mice, Group III animals (MNU + extract) showed an increase of 30% in body weight. Animals fed the HEAM extract alone (group III) had a similar body weight increase pattern as the controls with, however, a less prominent rise.
MTT assay
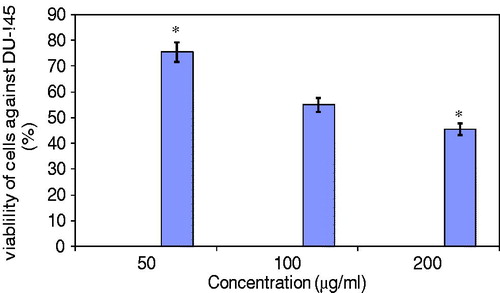
Prior to in vivo experimentation on Balb/c mice, HEAM was assessed for its anti-proliferative properties and cytotoxicity effectiveness on cancer cells. Using the MTT assay to assess the cytotoxic potency of HEAM on DU-145 (human prostate cancer cell line), cell viability was observed to reduce with increasing concentrations of the extract with values attaining 75, 55 and 47.2% in the presence of 50, 100 and 200 μg/ml extract, respectively ().
Figure 2. Cell viability assay (MTT) following HEAM treatment on human prostate cancer cell line (DU 145). Values are mean ± SEM. *p < 0.05 considered statistically significant.
DNA fragmentation assay
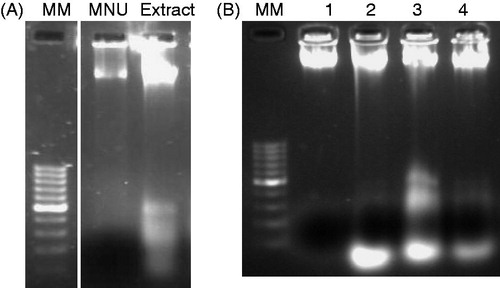
DNA fragmentation, a characteristic feature of apoptosis, was assessed by ladder formation on agarose gel electrophoresis. shows the fragmentation data of mouse DNA following the intake of HEAM (100 mg/kg b.w.) and MNU. The HEAM-treated DNA samples show clear fragmentation while no such observation is made in DNA samples of MNU-treated mice. gives the DNA fragmentation pattern for all animal groups. After 28 weeks of treatment, Group III (Lane 3, HEAM extract) and Group IV animals (Lane 4, MNU + HEAM extract) produced clear nuclear fragmentation patterns, the most prominent being in HEAM-treated mice. DNA from Group II (Lane 1, MNU treated) did not show any fragmentation after 28 weeks of treatment. The PBS-treated samples (Lane 2, ) generated some level of fragmentation, this being in line with observations that normal cells apoptose during development and aging in response to the homeostatic mechanism to maintain cell population in tissues (Elmore, Citation2007).
Figure 3. (A) DNA fragmentation in the presence of MNU and HEAM (100 mg/kg b.w.) on agarose gel. (B) HEAM effect on DNA fragmentation: HEAM and MNU + Extract-treated samples show nuclear fragmentation (Lane1: N-Methyl N-nitrosourea; Lane 2: Phosphate buffer saline (PBS); Lane 3: HEAM extract; Lane 4: (MNU + HEAM).
RT-PCR analysis
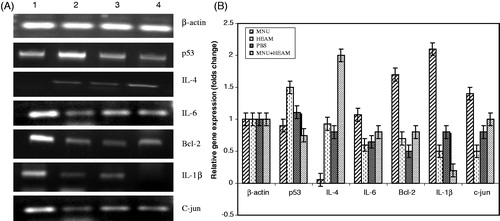
The effect of HEAM extract was studied on the expression of inflammatory cytokines (IL-1β, IL-6), anti-inflammatory cytokine (IL-4), apoptosis-related gene (Bcl-2) and tumor-related genes (p53, c-jun) at the mRNA level by reverse transcriptase–polymerase chain reaction. All the genes were amplified from the same cDNA, synthesized from RNA isolated from liver samples of each group of mice (). β-Actin was used as internal control and amplified independently from the same cDNA. shows that the relative expression of inflammatory cytokines (IL-1β, IL-6) and anti-apoptotic genes (Bcl-2 and c-jun) increased by 2-, 1.3-, 1.7- and 1.5-fold, respectively, in MNU-treated samples and is less marked in the control, HEAM-treated and MNU + HEAM-treated groups. Twenty-eight week HEAM treatment () decreased inflammatory cytokine (IL-1β, IL-6) expression by 90 and 25%, respectively, while Bcl-2 and c-jun expression was reduced by 53 and 30%, respectively. The expression of anti-inflammatory cytokine IL-4 is 2-fold higher in the MNU + HEAM extract-treated group compared to control and HEAM extract-treated samples. The expression of IL-4 is relatively negligible in MNU-treated samples. p53 Expression, in HEAM-treated sample, is 1.5-fold higher than in the control while it is reduced in the MNU + HEAM-treated group.
Figure 4. (A) Effect of HEAM on the mRNA level of tumor related genes (p53, Bcl-2), inflammatory (IL-1β, IL-6 and c-jun) and anti-inflammatory (IL-4) cytokines. Representative photographs of ethidium-bromide-stained 2% agarose gels for each gene after 7 months of treatment. (B) Expression of tumor-related genes (p53, Bcl-2), inflammatory (IL-1β, IL-6 and c-jun) and anti-inflammatory (IL-4) cytokines (quantified in terms of fold change according to densitometric analysis). Each experiment was repeated three times with similar results and results are expressed as means ± SE, p < 0.05. Lane 1: MNU, Lane 2: HEAM (100 mg/kg b.w.), Lane 3: Control (PBS), Lane 4: MNU + HEAM (100 mg/kg b.w.).
Blood cell count
The comparison of blood cell count for the different experimental groups is given in . A significant (p < 0.001) decline in hemoglobin concentration (25%) was observed in the MNU-treated animals (group II) compared to control (PBS). There was no significant change in hemoglobin concentration in the HEAM-treated group (III) compared to control while a slight decrease of 7% was obtained in the MNU + HEAM-treated group (IV). Leukocyte and platelet counts indicate increases of 1- and 4-fold, respectively, for MNU-treated group compared to control. Both control and HEAM groups had relatively similar leukocyte counts, while the platelet count was higher in the HEAM group (56 600; 2-fold increase) than in control (27 000). The MNU + HEAM group had leukocyte and platelet counts much lower than the MNU-treated group but greater than the control group with an increase of only 24% for the former and 3-fold for the latter. gives the effective change in total leukocyte counts for blood samples of animals in all the experimental groups. All values are significant and calculated according to one-way ANOVA. The lymphocyte count for the MNU (Group II)-treated sample decreased by 42% while the count for the HEAM group (III) and MNU + HEAM group (IV) declined only by 11 and 21%, respectively, compared to control. An increase in neutrophil (43%) and monocyte (10-fold) count was observed in the MNU group (II) relative to control. Neutrophil increase was in the order of only 12% for animals on MNU + HEAM (Group IV). No change was observed in the HEAM (group III)-treated samples where the count was similar to the control. A 10-fold increase in monocyte and eosinophil was observed in the MNU (group II)-treated group. The monocyte count in the HEAM group was comparable with the control mice while only a 3-fold increase was noted in Group IV mice. Only a 4-fold rise in eosinophils was recorded for Group IV (HEAM + MNU) subjects while no major significant change occurred for the HEAM group (III) compared to control.
Table 2. Whole blood cell counts in Group I (PBS), Group II (MNU), Group III (HEAM) and Group IV (MNU + HEAM).
Table 3. Leucocyte differential counts in Group I (PBS), Group II (MNU), Group III (HEAM) and Group IV (MNU + HEAM).
Raman analysis
Raman spectra analysis was performed to evaluate the effect of HEAM on DNA structure at nucleic bases and phosphate backbone levels. The spectra of all DNA samples are shown in . The assignment of the Raman band peaks was made according to literature data and is given in . The general features of the Raman spectra of all four samples corresponding to PBS (group I) (); MNU (group II; ); HEAM (group III; ); MNU + HEAM (group IV; ) are relatively similar according to their band assignments. However, differences in their relative intensity were apparent. For the analysis of the Raman bands, the complete spectra (600–1600 cm−1) were divided into six regions as noted in . A total of 15 peaks including 806, 838 and 1216 cm−1 for phosphodiester stretching, 938, 970, 996, 1434 and 1456 cm−1 peaks for deoxyribose and 1252, 1327 and 1357 cm−1 for purine and pyramidine bases were characterized. Differences in intensity were obtained for deoxyribose-phosphate (1152 cm−1), purine bases (1252 cm−1), guanine (1327, 1357 cm−1) and deoxyribose backbone (1456 cm−1) bands below the 1200 range in Group I-treated samples with variation values corresponding to 600 for deoxyribose phosphate, 750 for guanine and adenine and 1100 for deoxyribose backbone (). These assigned peaks increased in intensity (shown at Y-axis) by 50–70% for MNU (Group II)-treated samples as shown in . MNU + HEAM group (IV) had an intermediate peak intensity value with respect to Groups I and II peak magnitudes while the HEAM group (III) peak value intensity was similar to one of the normal group. The major change in spectra was observed at peak 1252 cm−1 where the latter was more intense and prominently increased (4-fold) in MNU-treated DNA samples ().
Figure 5. Raman spectra for all the experimental groups. Comparison of Raman laser spectra of DNA in the region 600–1600 cm−1. These spectra are representative of experiments repeated eight times. Raman conditions and parameters: resolution cm−1, laser power 5 mW exciting source was 514.5 nm Argon ion laser.
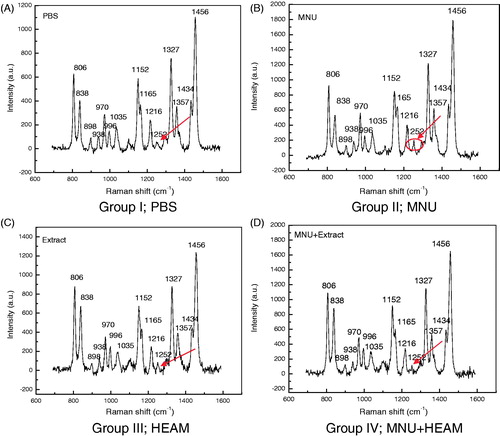
Table 4. Raman bands observed in the spectra of the experimental group treated DNA of liver of Balb/c mice and their tentative assignments with references of earlier reports.
shows the overlay spectra for all experimental groups and indicates the change in intensity of the study groups compared to control. The spectra for MNU (group II) samples showed the highest peak intensity and the formation of a new peak at 1252 cm−1. No similar peak was apparent in the control group while it was faintly observed in the HEAM (Group III)- and the MNU + HEAM (Group IV)-treated groups.
Figure 6. Overlay Raman spectra of DNA samples from Groups I–IV mice. Raman bands at 806, 838, 938, 970, 996, 1035, 1152, 1165, 1216, 1252, 1327, 1357, 1434 and 1456 cm−1 are highlighted. The increase in intensity is observed in MNU (group II)-treated samples followed by MNU + Extract (Group IV)-treated samples while the control (PBS: group I) and Extract (group III)-treated samples had reduced peak intensities for the assigned bands. The major peak alteration is observed at 1252 cm−1 and is characteristic of MNU-treated samples only.
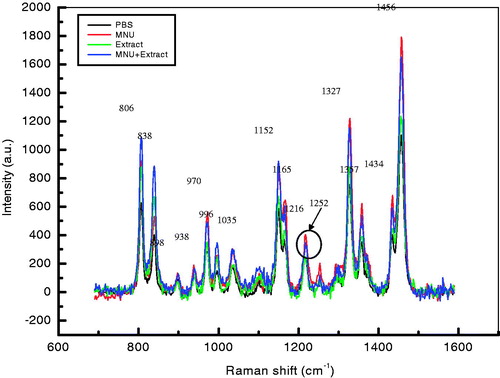
The peak intensities can be arranged in the following order for experimental groups MNU (Group II) > MNU + HEAM (Group IV) > HEAM (Group III) ≈ Control (Group I; ). Using the standard analysis Software Spectra Calc., the peaks appearing in each region were superimposed to the mixture of Lorenz Ian and Gaussian bands to evaluate the extent in intensity, frequency and peak area changes. To assess the precise change in peak intensity and shift, an internal standard (1434 cm−1 band) was selected. This band 1434 cm−1 does not appear to change in intensity in any of four samples. The peak normalization eliminated the effect of variation in DNA sampling. Each measurement was done separately on the same day of DNA isolation.
Discussion
Bioactive plant extracts are increasingly considered as potent chemopreventive elements in an alternative approach to rationally manage cancer progression. MNU is a carcinogen, mutagen and teratogen present in tobacco smoke, processed meats, fish and cheese exerting its toxicity by the transfer of its methyl group to nucleobases in nucleic acids. The intake of this nitro stable compound develops a conducive environment for the activation of inflammatory cytokines with the increased expression of NF-κB leading to hepatocarcinogensis in Balb/c mice (Verma et al., Citation2012).
The MNU-induced hepatocarcinogensis in Balb/c mice which is here suggested as a convenient and compelling animal model to study the mechanisms involved in experimental tumor proliferation and the development of therapeutic strategies was utilized in the assessment of the bioefficacy of a hydroalcoholic extract of A. marmelos (HEAM). show that 100 mg/kg of HEAM treatment in MNU-induced liver cancer mice alters the body weight after 28 weeks. HEAM restored body weight, which was significantly decreased (40% compared to control) in MNU-treated mice. Thus, the protective effect of HEAM can be argued to be due to its anti-proliferative effect as reported by Jagetia et al. (Citation2005) and Lambertini et al. (Citation2004). Costa-Lotufo et al. (Citation2005) showing the cytotoxic effect of A. marmelos on human prostate cancer cell line (DU 145) and tumor cell line in brine shrimp, respectively, provide complementary evidence in disfavor of cancer cell growth.
The inflammatory microenvironment of tumors is characterized by tumor-associated macrophages, tumor-infiltrating lymphocytes which overproduce a range of pro-inflammatory cytokines, in particular tumor necrosis factor (TNF), chemokines, transcription activators and interleukine-1β and -6 among others (Balkwill & Mantovani, Citation2001; Klampfer, Citation2008; Kundu & Surh, 2005; Neergheen et al., Citation2010; Palapattu et al., Citation2004; Sung et al., Citation2012). A significant decrease in inflammatory cytokine (IL-1β, IL-6) expression (≥50%), upregulated in all the MNU-treated group of animals, was observed in Group III (HEAM) and Group IV (HEAM + MNU) mice mRNA after 28 weeks of treatment (), thus suggesting a chemopreventive effect of HEAM. The IL-4 cytokine expression was up regulated in both HEAM (Group III)- and MNU + HEAM (Group IV)-treated groups compared to control while a clear inhibition of its expression was observed in the MNU (Group II)-treated samples (). IL-4 is reported to have marked inhibitory effects on the expression and release of pro-inflammatory cytokines (Opal & DePalo, Citation2000). Its ability to suppress the expression of cytokines therefore lends weight to the observed decreased expression of the inflammatory cytokines (IL-1β, IL-6). Quan et al. (Citation2007) reported Ginseng and Salviae extracts to similarly induce high levels of IL-4 against influenza infection in Balb/c mice while Seki et al. (Citation2012) confirmed the blocking effect of IL-4 on pro-inflammatory cytokine production, thus alleviating hepatic damage in double knockout [DKO] mice.
In this study, HEAM modulated the expression of anti-apoptotic gene bcl-2, c-jun and tumor suppressor gene p53 in Groups III and IV compared to control and MNU-treated groups (). Bcl-2 and c-jun which are overexpressed in a wide variety of cancers and upregulated in MNU-treated samples were consistently reduced by 70% following HEAM treatment at mRNA level. That apoptosis might be one of the most probable mechanisms of hepatoprotective effect of the HEAM extract is also complemented by DNA fragmentation data () emphasizing the presence of pronounced fragmentation patterns in HEAM-treated mice DNA. Similar observations were made by Luo et al. (Citation2008) whereby citrus fruit extracts proved effective against lung cancer cell line as well as in in vivo (nude mice) inducing nuclear fragmentation and apoptosis at 20 and 40 μg/ml. p53 expression was most prominent in Group III animals and attained a relatively high level in MNU + extract (Group IV)-treated mice. The Bcl-2 and p53 expression are therefore interestingly relevant in the context of literature data, which highlight the close relationship between these genes in majority of cancers (Gu et al., Citation2009).
The extract has anti-inflammatory and pro-apoptotic propensities with both preventive and therapeutic potential. HEAM-modulated hemoglobin concentration, leukocyte and platelet as well as lymphocyte, neutrophil, monocyte and eosinophil counts in MNU-induced mice compared to the control group. MNU-treated samples showed () an abnormal elevated level of leucocytes (4-fold), monocytes (10-fold) and neutrophils (43%). It has been reported that abnormally high neutrophil, monocyte or leucocyte counts are associated with poor survival in patients with metastatic carcinoma (Donskov et al., Citation2006; Schmidt et al., Citation2007; Walsh et al., Citation2005). The decrease in lymphocyte count in MNU-treated sample compared to other HEAM-treated groups and its reported association with a more aggressive behavior of the tumor (Guidozzi et al., Citation1994; Hespanhol et al., Citation1995) prompts as to suggest this parameter as a valuable contributive marker in cancer prognosis. HEAM also normalized the leucocyte, neutrophil, monocyte and eosinophil counts and increased the lymphocyte count after 28 weeks of treatment in MNU-induced hepatocarcinogenesis mice, thus providing additional evidence of its beneficial effect and in this particular case highlighting immunomodulatory effect. Similarly, an aqueous extract of Uncaria tomentosa (Willd. ex Schult.) DC. (Rubiaceae) known for its anti-inflammatory and anticancer properties was also reported to increase the immune response in doxorubicin-induced leucopenia in rats by proportionately increasing all fractions of white blood cells in addition to its ability to enhance DNA repair, mitogenic response and leucocyte recovery after chemotherapy-induced DNA damage in humans (Sheng et al., Citation2000, Citation2001). Platelet count was modulated in the presence of HEAM () as observed in the MNU + HEAM group where the numbers were brought down by 50%, suggesting an effective anti-platelet activity at the dose of 100 mg/kg concentration. It is noteworthy that an increase in platelet count has been attributed to an increased expression of inflammatory cytokine (IL-1β, IL-6) as observed in various types of cancer patients (Ishibashi et al., Citation1989). HEAM extract curbed the increased monocyte (1-fold) and neutrophil count (12%) in MNU-induced liver cancer blood samples after 28 weeks (). The changes observed in terms of peak intensity increases in MNU-primed DNA samples are clear indications of carcinogenicity. HEAM mitigated the effects of MNU as shown in . The increase in peak intensity in Raman spectroscopy is reflective of a highly cooperative conformational change occurring within different portions of MNU-treated DNA samples (Verma et al., Citation2012).
The 1252 cm−1 peak assigned for adenine and cytosine is prominent and intense as shown in in MNU-treated samples while its importance is considerably reduced in HEAM-treated samples. The 1200–1600 cm−1 region, assigned to purines and pyramidines, and corresponding to ring electronic structures are very sensitive to base unstacking and metal binding at ring sites (Duguid et al., Citation1996). The prominent 1252 cm−1 band might be a consequence of alkylation at adenine bases and can be interpreted as the outcome of a strong interaction between MNU with the DNA structure. Ruiz-Chica et al. (Citation2006) and Rizvi and Hadi (Citation1984) demonstrated that MNU had a strong affinity for guanine and adenine bases in synthesized Calf DNA. This interaction of MNU–DNA with intense 1252 cm−1 peak is not apparent in any of the plant extract-treated DNA samples as well as in control sample. The interaction between MNU and DNA, and their adducts when accumulated on routine exposure in cells might cause mutation and lead to cancer. This MNU–DNA interaction is markedly inhibited by HEAM. The normal structure and confirmation of nucleic acid backbone and sugar bases in DNA samples are maintained, thereby strongly suggesting an anti-carcinogenic propensity of HEAM against MNU in mice.
Conclusion
The findings in this study are highly demonstrative that A. marmelos can be included among the arsenal of phytotherapeutic plants that have the potential to modulate the incidence of liver cancer. It is indeed an inextricable thought that liver cancer would continue to constitute a major health problem because of the rising incidence of environmental pollutants (dietary, tobacco) and xenobiotics. Plant-based dietary factors with anti-inflammatory and chemopreventive capacities may prove to be effective to circumvent carcinogenicity. Comprehensive research that includes demonstration of clinical efficacy is warranted, a direction that ultimately involves the screening of a number of functional foods and traditional herbal medicines and understanding their molecular modes of actions.
Declaration of interest
This research has been supported by University Grant Commission (UGC) as financial support as SRF to the first author. The authors report no conflicts of interest. The authors alone are responsible for the content and writing of this article.
Acknowledgements
The authors acknowledge the Coordinator, School of Biotechnology and Head of Dept. of Physics, Faculty of Science, BHU for providing the infrastructure and facility. One of the authors (T. B.) wishes to acknowledge the Federation of Indian Chambers of Commerce & Industry (FICCI) and the Government of India for CV Raman International Senior Fellowship award for African Researchers, which was instrumental to this collaboration. T. B. also acknowledges the support of The Tertiary Education Commission (Mauritius). Acknowledgement is also due to Mr. Sunil Kumar Yadav, laboratory/animal attendant for taking care of the mice. RKS is grateful to DST, India for support to set up Laser Micro-Raman spectrometer.
References
- Arul V, Miyazaki S, Dhananjayan R. (2005). Studies on the anti-inflammatory, antipyretic and analgesic properties of the leaves of Aegle marmelos Corr. J Ethnopharmacol 96:159–63
- Arumugam S, Kavimani S, Kadalmani B, et al. (2008). Antidiabetic activity of leaf and callus extracts of Aegle marmelos in rabbit. Sci Asia 34:317–21
- Balkwill F, Mantovani A. (2001). Inflammation and cancer: Back to Virchow?. Lancet 357:539–45
- Costa-Lotufo LV, Khan MT, Ather A, et al. (2005). Studies of the anticancer potential of plants used in Bangladeshi folk medicine. J Ethnopharmacol 99:21–30
- Cragg GM, Newman DJ. (2005). Plants as a source of anti-cancer agents. J Ethnopharmacol 100:72–9
- Donskov F, Hokland M, Marcussen N, et al. (2006). Monocytes and neutrophils as ‘bud guys’ for outcomes of interleukin-2 with and without histamine in metastatic renal cell carcinoma – Results from a randomized phase II trial. Brit J Cancer 94:218–26
- Duguid JG, Bloomfield VA, Benevides JM, Thomas GJ. (1996). DNA melting investigated by differential scanning calorimetry and Raman spectroscopy. J Biophys 71:3350–60
- Elmore S. (2007). Apoptosis: A review of programmed cell death. Toxicol Pathol 35:495–516
- Gao X, Butler IS, Kremer R. (2005). A near infrared Fourier transform Raman spectroscopy of epidermal keratinocytes: Changes in the protein–DNA structure following malignant transformation. Spectrochim Acta Part A 61:27–35
- Gangadevi V, Muthumary J. (2008). Taxol, an anticancer drug produced by an endophytic fungus Bartalinia robillardoides Tassi, isolated from a medicinal plant, Aegle marmelos Correa ex Roxb. World J Microbiol Biotechnol 24:717–24
- Gu Q, Hu C, Chen Q, et al. (2009). Development of a rat model by 3,4-benzopyrene intra-pulmonary injection and evaluation of the effect of green tea drinking on p53 and bcl-2 expression in lung carcinoma. Cancer Detect Prev 32:444–51
- Guidozzi F, Reddy S, Wadee A. (1994). Characterization of peripheral blood and ovarian cancer infiltrating lymphocytes: Effect of HIV infection on phenotypic expression and proliferative response. Gynecol Oncol 53:251–5
- Hespanhol V, Queiroga H, Magalhaes A, et al. (1995). Survival predictors in advanced non-small cell lung cancer. Lung Cancer J IASLC 13:253–67
- Hotckiss JH. (1989). Preformed N-nitroso compounds in foods and beverages. Cancer Surv 8:295–321
- Ishibashi T, Kimura H, Shikama Y, et al. (1989). lnterleukine-6 is a potent thrombopoietic factor in vivo in mice. Blood 74:1241–4
- Jagetia GC, Venkatesh P, Baliga MS. (2005). Aegle marmelos L. Correa inhibits the proliferation of transplanted Ehrlich ascites carcinoma in mice. Biol Pharm Bull 28:58–64
- Kamalakkannan N, Stanely P, Prince M. (2003). Hypoglycaemic effect of water extracts of Aegle marmelos fruits in streptozotocin diabetic rats. J Ethnopharmacol 87:207–10
- Kesari AN, Gupta RK, Singh SK, et al. (2006). Hypoglycemic and antihyperglycemic activity of Aegle marmelos seed extract in normal and diabetic rats. J Ethnopharmacol 107:374–9
- Klampfer L. (2008). The role of signal transducers and activators of transcription in colon cancer. Front Biosci 13:2888–99
- Kundu JK, Surh YJ. (2005). Breaking the relay in deregulated cellular signal transduction as a rationale for chemoprevention with anti-inflammatory phytochemicals. Mutat Res 591:123–46
- Lambertini E, Piva R, Khan MT, et al. (2004). Effect of extracts from Bangladeshi medicinal plants on in vitro proliferation of human breast cancer cell lines and expression of estrogen receptor alpha gene. Int J Oncol 24:419–23
- Lampronti I, Martello D, Bianchi N, et al. (2003). In vitro antiproliferative effects on human tumor cell lines of extracts from the Bangladeshi medicinal plant Aegle marmelos Correa. Phytomedicine 10:300–8
- Luo G, Guan X, Zhou L. (2008). Apoptotic effect of Citrus fruit extract nobiletin on lung cancer cell line A549 in vitro and in vivo. Cancer Biol Ther 7:966–73
- Nadkarni AK. (1986). Dr. K.M. Nadkarni’s Indian Materia Medica, vol. 1. Bombay, India: Popular Prakashan Company, 45
- Neergheen VS, Bahorun T, Taylor EW, et al. (2010). Targeting specific cell signaling transduction pathways by dietary and medicinal phytochemicals in cancer chemoprevention. Toxicology 278:229–41
- Opal SM, DePalo VA. (2000). Anti-inflammatory cytokines. Chest 117:1162–72
- Palapattu GS, Sutcliffe S, Bastian PJ, et al. (2004). Prostate carcinogenesis and inflammation: Emerging insights. Carcinogenesis 26:1170–81
- Prescott B, Steinmetz W, Thomas GJ. (1984). Characterization of DNA structures by laser Raman spectroscopy. Biopolymers 23:235–56
- Quan FS, Compans RW, Cho YK, Kang SM. (2007). Ginseng and Salviae herbs play a role as immune activators and modulate immune responses during influenza virus infection. Vaccine 25:272–82
- Rizvi RY, Hadi SM. (1984). Effect of alkylation with N-methyl-N-nitrosourea and N-ethyl-N-nitrosourea on the secondary structure of DNA. Bioscience Rep 4:729–35
- Ruiz-Chica AJ, Soriano A, Tunon I, et al. (2006). FT-Raman and QM/MM study of the interaction between histamine and DNA. Chem Phys 324:579–90
- Saffhill R, Margison GP, O'Connor PJ. (1985). Mechanisms of carcinogenesis induced by alkylating agents. Biochem Biophys Acta 823:111–45
- Schmidt H, Suciu S, Punt CJA. (2007). Pretreatment levels of peripheral neutrophils and leukocytes as independent predictors of overall survival in patients with American Joint Committee on Cancer Stage IV Melanoma: Results of the EORTC 18951 biochemotherapy trial. J Clin Oncol 25:1562–9
- Seki T, Kumagai T, Kwansa-Bentum B, et al. (2012). Interleukin-4 (IL-4) and IL-13 suppress excessive neutrophil infiltration and hepatocyte damage during acute murine Schistosomiasis japonica. Infect Immun 80:159–68
- Shankarananth V, Balakrishnan N, Suresh D, et al. (2007). Analgesic activity of methanol extract of Aegle marmelos leaves. Fitoterapia 78:258–9
- Sharma GN, Dubey SK, Sharma P, Sati N. (2011). Medicinal values of bael (Aegle marmelos) (L.) Corr.: A review. Inter J Curr Pharm Rev Res 1:12–22
- Sheng Y, Pero RW, Wagner H. (2000). Treatment of chemotherapy induced leukopenia in a rat model with aqueous extract from Uncaria tomentosa. Phytomedicine 7:137–43
- Sheng Y, Li L, Holmgren K, Pero RW. (2001). DNA repair enhancement of aqueous extracts of Uncaria tomentosa in a human volunteer study. Phytomedicine 8:275–82
- Singer S, Kusmierek JT. (1982). Chemical mutagenesis. Annu Rev Biochem 51:655–93
- Somasundaram S, Edmund NA, Moore DT, et al. (2002). Dietary curcumin inhibits chemotherapy-induced apoptosis in models of human breast cancer. Cancer Res 62:3868–75
- Sipro TG. (1987). Raman spectra on the conformations of biological macromolecules. In: Spiro TG, ed. Biological Application of Raman Spectroscopy, vol. 1. New York: JohnWiley, 81–133
- Sung B, Prasad S, Gupta SC, et al. (2012). Chapter 3-regulation of inflammation-mediated chronic diseases by botanicals. Adv Bot Res 62:57–132
- Thomas Jr GJ, Benevides JM. (1985). An A-helix structure for poly(dA-dT) · poly(dA-dT). Biopolymers 24:1101–5
- Thomas Jr GJ, Tsuboi M. (1993). Raman spectroscopy of nucleic acids and their complexes. Adv Biophys Chem 3:1–70
- Verma S, Bahorun T, Kumar A. (2012). N-Methyl N-nitrosourea induced altered DNA structure initiate hepatocarcinogenesis. J Prev Med 54:130–6
- Walsh SR, Cook EJ, Goulder F, et al. (2005). Neutrophil–lymphocyte ratio as a prognostic factor in colorectal cancer. J Surg Oncol 91:81–4
- Weizhong K, Duowei Y, Jianzhong Wu. (1999). Raman spectroscopic study of the influence on herring sperm DNA of heat treatment and ultraviolet radiation. Spectrochim Acta Part A 55:1081–90
- Yifu G, Thomas GJ. (1996). Vibrational analysis of nucleic acids. IV. Normal modes of the DNA phosphodiester structure modeled by diethyl phosphate. Biopolymers 39:813–35