
Abstract
Context: Miconazole (MIZ) and econazole (ECZ) are clinically used as antifungal drugs.
Objective: The drug effect and binding property with transport protein human serum albumin of MIZ and ECZ were studied.
Materials and methods: The antifungal efficiency was investigated by microdiluting drug solutions from 0 to 48 μmol L−1 through microcalorimetry and voltammetry studies. Transmission electron microscopy was used for morphological observations of C. albicans. The interaction with HSA was studied by electrochemical methods, fluorescence spectrometry, electron microscopy, and molecular simulation.
Results: IC50 of MIZ and ECZ for C. albicans were obtained as 19.72 and 29.90 μmol L−1. Binding constants of MIZ and ECZ with HSA of 2.36 × 10⁴ L mol−1 and 3.73 × 10⁴ L mol−1 were obtained. After adding MIZ solution of 12 and 40 μmol L−1, the peak currents increased to 4.887 and 6.024 μA. The peak currents of C. albicans in the presence of 20 and 48 μmol L−1 ECZ were 4.701 and 5.544 μA. The docking scores for MIZ and ECZ of the best binding conformation in site I and site II were 5.60, 4.79, 5.63, and 5.85.
Discussion and conclusion: Strong inhibition to the metabolism of C. albicans and destructive effect was proved for both drugs. The lower IC50, growth rate constant of C. albicans, and higher peak current, reveal stronger antifungal activity of MIZ. Both drugs show an efficient quenching effect to intrinsic fluorescence residues of protein. MIZ mainly binds on site I while ECZ on site II. Molecular modeling experiments give further insight of the binding mechanism.
Introduction
Candida albicans, as a metatroph, exists in nature extensively (Ghannoum, Citation1997). It is also a part of the normal flora within the human body (Tannock, Citation1994). So far, it has been found in the skin, respiratory tract, digestive tract, mouth, vaginal mucosa, and other organs (Ranjard et al., Citation2006). As an opportunistic fungus, the pathogenicity of C. albicans depends on many factors, including the human immune system, infection, the number of bacteria, and bacterial resistance of infection (Mayer et al., Citation2013). In normal circumstances, C. albicans does not cause disease as a general yeast cell type. However, when the physiological factors of micro-environment in vivo change and the organism immunity and resistance decline, C. albicans would be in mass propagation. It would transform into mycelium, and infect the organs shortly. Infection symptoms would be observed clinically after a certain number cells have been infected (Anonymous, Citation2002; Gupta et al., Citation1994).
More than 50 years ago, the first antifungal agent, amphotericin B, was developed and used. Since then, great progress has been made in the prevention and treatment of fungal infection (Arveiller et al., Citation1990). The development is not keeping up with other anti-infective drugs because of the difficulty in the design. Discovery of novel broad-spectrum, high efficiency, and low toxicity antifungal drugs is still very important (Chowdhry et al., Citation1983). In recent years, main drugs clinical used in the treatment of fungal infections are imidazole, carbamates, and polyenes. These drugs present much higher efficacy and lower toxicity compared with previous drugs (Buckton et al., Citation1991; Xu et al., Citation2008). Among these drugs, azoles show high efficiency, low recurrence rate, and adverse reactions are light. The features enable azoles to be used mostly for the treatment of fungal infection. Moreover, because azoles reflect stable metabolism and good absorbance in vivo. It could be applied to the skin, taken orally, and even injected into the body directly. Thus, both shallow and deep fungal infections are able to be treated (Como & Dismukes, Citation1994).
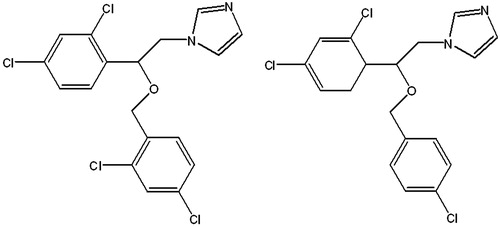
Among azoles drugs, miconazole (MIZ), econazole (ECZ), ketoconazole, itraconazole, fluconazole, and voriconazole are the most commonly used antifungal drugs currently (Lida et al., Citation2009). MIZ and ECZ, which were developed more than 30 years ago, show high efficiency and low toxicity (Mangas-Sánchez et al., Citation2011). They are still used in the clinical treatment of skin disease caused by fungus (Carter & Ho, Citation1994). The molecular structures are shown in . They can inhibit ergosterol synthesis through inhibiting the fungal cytochrome P450 mediated 14-α-sterol demethylation of CYP51 (Helmeste et al., Citation1998). The permeability of cell membrane is affected and the fungal growth is inhibited eventually (Sudlow et al., Citation1975). MIZ and ECZ could also undermine the metabolism of fungus, affect cellular biosynthesis of phospholipids and triglycerids, inhibit the oxidative enzymes, then cause intracellular accumulation of hydrogen peroxide, and finally result in cell degeneration and necrosis of microstructure (Roberts-Thomson et al., Citation2010). For C. albicans, the drugs inhibit their changes from spore form to invasive mycelial form (Lakowicz, Citation2006).
Figure 1. The molecular structures of miconazole (MIZ, left) and econazole (ECZ, right).
In this work, we systematic studied the drug effect and binding behavior with transport protein of MIZ and ECZ using electrochemical methods, fluorescence spectrometry, electron microscopy, and molecular simulation from cellular and molecular levels. An electrochemical method was first used to obtain the important parameters of antifungal activity of the drugs. In additional, the binding properties with human serum albumin (HSA) was studied as an important part of the delivery process, and the interaction mechanism was analyzed by molecular simulation.
Materials and methods
Materials
Candida albicans (ATCC 64550) were supplied by Denmark ROSCO Co. and preserved by Clinical and Genetic diagnosis Center of Zhongnan Hospital of Wuhan University, Wuhan, Hubei Province, China. Peptone and yeast were obtained from Britain OXOID Co, Basingstoke, UK. Luria–Bertani (LB) culture medium (5 g NaCl, 5 g yeast and 10 g peptone dissolved in 1 L purified water, pH = 7.4) was sterilized at 120°C and 1.034 × 10⁵ Pa for 20 min.
MIZ and ECZ were obtained from Wuhan Yuancheng Tech. Development Co. Ltd., Wuhan, China The compounds were dissolved in DMF (N,N-dimethylformamide, AR) as a stock solution and were further diluted by purified water for the experiments. Diluted DMF solution hardly affects the growth and metabolism of the microorganism.
HSA and menadione were obtained from Sigma Company, St. Louis, MO. Moreover, menadione was preserved in the dark as a 20 mmol L−1 ethanol solution. NaCl, KCl, Na2HPO4, and KH2PO4 of AR grade were obtained from Sinopharm Chemical Reagent Co. Ltd, Shanghai, China. All water used in experiments was triple purified with a Millipore ultrapure system, Millipore, Billerica, CA (18.2 MΩ).
Equipment
Electrochemical measurements were performed on CHI660C electrochemical workstation (CHI Company, Chicago, IL). Calorimetric measurements were tested with LKB2277 isothermal calorimetry (Thermometric AB Company, Stockholm, Sweden). Fluorescence spectra were recorded with a LS-55 fluorescence spectrophotometer (Perkin Elmer Company, Waltham, MA) with a constant temperature system. Absorbance spectra were recorded with a TU-1900 double-beam UV–Vis spectrophotometer (Beijing Purkinje General Instrument Co., Ltd., Beijing, China). SEM photographs were taken on TECNAI G2 transmission electron microscope (TECNAI Joint Stock Limited Company, Wanzai County, China). All water used in experiments was triple purified with a Milli-Q Advantage A10 ultrapure water system (Millipore Company, Millipore, Billerica, CA).
Electrochemical measurements
Cyclic voltammetry study
A burnished gold electrode was modified with HSA using the absorption method. A HSA modified tri-electrode system was used as a working electrode. The Ag/AgCl electrode was used as a reference electrode and the platinum electrode as a counter electrode. The scan range was set from 0.1 to 0.6 V. Six cycles were scanned each time with the speed of 50 mV s−1. The system temperature was kept at 298°K during the measurements.
Binding constants of the drugs could be calculated using the Langmuir equation (Zhao et al., Citation2007):
(1)
Here, K is the binding constant between the drugs and HSA. c is the concentrations of the drugs. ΔIp is the decrease of the peak current. ΔIpmax is the decrease of the maximum peak current.
Polarography and voltammetry study
Menadione was used as the medium. Prussiate of potash [K4Fe(CN)6] and yellow prussiate of potash [K3Fe(CN)6] were dissolved into a solution of 5.0 mmol L−1. KCl solution of 0.1 mol L−1 was used as a redox indicator. Fe2+ was produced from Fe3+ after oxidizing the reduced menadione. The drug effect to normal metabolism of microorganism was evaluated by the concentration change of Fe2+ after the equilibrium was attained. The concentration change of Fe3+ could also be used in a similar way.
MIZ and ECZ, 300 μL prussiate of potash (0.3 mol L−1) and 50 μL menadione (20 mmol L−1) were added to the medium after C. albicans was incubated several hours at 37°C (OD600 ≈ 0.5). After incubating for another 2 h, C. albicans were collected in a high-speed centrifuge. Supernatant fluid was taken to test the reduction current of Fe2+. The voltage range was set from 0 to 0.5 V, and the scan speed was 50 mV s−1.
The C. albicans were activated and cultured in the presence of MIZ at the concentrations of 12 and 40 μmol L−1, and ECZ at the concentrations of 20 and 48 μmol L−1. Meanwhile, culture medium and the C. albicans growing without any drugs used as the control were treated in the same way. The supernatant liquor taken from the centrifuged culture was also tested.
Microcalorimetry study of the drug inhibition to the metabolism of C. albicans
The stopped-flow method was used to study the inhibition of two drugs on a LKB2277 isothermal calorimeter. In order to reduce the error and obstruction, the channels and flow cells were flushed with 75% ethanol solution, 0.1 mol L−1 NaOH, 0.1 mol L−1 HCl, and sterile water for 15–20 min. Then 2 mL sample mixture was pumped into flow cells using peripump (LKB-2132 pump). The metabolism heat was auto collected in real-time with collection software. The thermogenic curves (P–t curves) were mapped. The C. albicans growing without any drugs was used as control groups.
Equations (2) and (3) are used to calculate the growth rate constant (Kovarova-Kovar & Egli, Citation1998):
(2)
(3)
Here, P0 and Pt represent the metabolic thermal power of C. albicans at the initial and time t, respectively. k represents the growth rate constant. The metabolic thermal power of every thermogenic curve was calculated. ln Pt ∼ t curves were linear fitted to get the rate constant k. The growth rate constants in the following experiments are obtained using the same equations.
Equation (4) is used to calculate tG (Koch, Citation1993):
(4)
The inhibition ratio of the drugs to C. albicans is calculated according to Equation (5) (Scaringi et al., Citation1991):
(5)
Here, k0 is the growth rate constant of the control, kC is the growth rate constant of the C. albicans in the presence of the drugs.
Fluorescence spectra study of the interaction between the drugs and HSA
The binding sites of the drugs were determined by site competition experiments using warfarin and ibuprofen as site competitors. The concentrations of HSA and the site competitors were 2.0 × 10⁻⁶ mol L−1. The concentrations of ECZ and MIZ were set from 0.5 to 3.5 × 10⁻⁶ mol L−1. The temperature of ECZ/MIZ-HSA systems was kept at 298°K. The excited wavelength was set as 295 nm and the emission wavelength was set from 300 to 480 nm.
The fluorescence quenching spectra were analyzed using the Stern–Volmer Equation (6):
(6)
Here, F0 is the fluorescence emission intensity of only HSA. F is the intensity of HSA with different concentrations of drugs. Q is the concentrations of the drugs, and KSV is the quenching constant.
Molecular modeling study of the binding mode of MIZ and ECZ with HSA
The crystal structure of HSA was obtained from the RCSB Protein Database Bank (PDB code: 1H9Z, 2BXG chain a). The protein structure was analyzed and prepared for the docking experiment. H atoms with H-bond orientation were added. All ligands and water molecules were removed, the relevant side-chains were repaired, and the bumps were fixed. Finally, the protein was charged using the AMBER7 FF99 method (Wang et al., Citation2004). This final structure was used for the Surflex-Dock program to compute the binding mode of the compounds with HSA.
The structures of MIZ and ECZ were generated with Sybyl 8.1 package (SYBYL, Citation2008). The molecules were energy minimized using Tripos Force Field, after been charged with the Gasteiger and Marsili method (Kroemer et al., Citation1996). The total energy of MIZ and ECZ were 23.31 and 33.38 kcal mol−1, respectively. A docking study of the binding mode between the compounds and HSA was conducted by Surflex-Dock program of Sybyl 8.1 software package (Tripos Inc., St. Louis, MO). Two binding sites were protomoled by choosing the corresponding ligands (WAR in 1H9Z and IBP in 2BXG chain a). Additional starting conformations per molecule were set as 7 for both compounds. Angstroms to expand search grid were set to 6 and the density of search was 3.00. Ring flexibility was considered and the grid was treated softly during the docking study. The results were analyzed and the graphs of the binding mode were mapped with the VMD program (Humphrey et al., Citation1993).
Results
The antifungal activity of the MIZ and ECZ against C. albicans
Microcalorimetry study of the inhibition to the metabolism of C. albicans
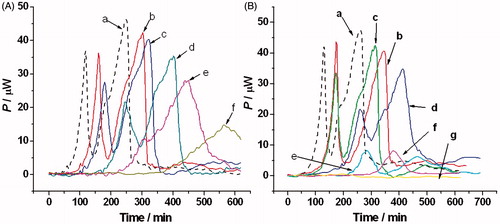
The metabolic heat production of the C. albicans in the presence of two drugs (ECZ and MIZ) was measured with a LKB2277 isothermal calorimeter at 310 K. shows the thermogenic curves of the C. albicans in the presence of different concentrations of the two drugs. The two drugs delayed the growth of C. albicans. Under the ECZ concentrations of 8 and 16 μmol L−1, the peak of the lag phase was delayed 54 min (from 248 to 302 min) and 74 min (from 248 to 322 min). For the same concentrations of MIZ, the delays were 88 min (from 258 to 346 min) and 162 min (from 258 to 420 min).
Figure 2. The thermogenic curves of Candida albicans (P–t curve) in the presence of ECZ and MIZ. (A) The concentrations of ECZ are 0, 8, 16, 20, 28, and 40 μmol L−1. (B) The concentrations of MIZ are 0, 4, 8, 16, 20, 28, and 40 μmol L−1. The thermogenic curve of C. albicans without ECZ is displayed in dash line.
Thermal and dynamic modeling of C. albicans in exponential phase of growth
The growth rate constant k and the generation time tG of C. albicans in the presence of MIZ and ECZ at different concentrations were calculated. In the presence of 8, 20, and 28 μmol L−1 MIZ, the growth rate constants were 0.0450, 0.0253, and 0.0191 min−1, respectively. The generation time tG were 15.39, 27.41, and 36.31 min. For the system with same concentrations of ECZ, the growth rate constants were 0.0481, 0.0374, and 0.0286 min−1. The generation time tG were 14.41, 18.53, and 24.25 min. Maximum heat-producing power Pm and total heat output Q were also calculated from thermogenic curves. In the presence of 40 μmol L−1 MIZ, Pm of the system was reduced from 47.40 to 0.55 μW. The total heat output was reduced from 0.1810 to 0.0061 J. Under the same concentration of ECZ, Pm was reduced from 46.23 to 14.87 μW. The total heat output was reduced from 0.1565 to 0.00601 J. All results are listed in . The growth rate constant k and drug concentrations could be linear fitted well. The fitting lines are shown in .
Figure 3. The linear fitting curves of growth rate constant k and drug concentrations. (A) The concentration of ECZ: 0, 8, 16, 20, 28, and 40 μmol L−1, k = 0.055−9.430 × 10⁻⁴c; (B) the concentration of MIZ: 0, 4, 8, 16, 20, and 28 μmol L−1, k = 0.055−1.370 × 10⁻³c.
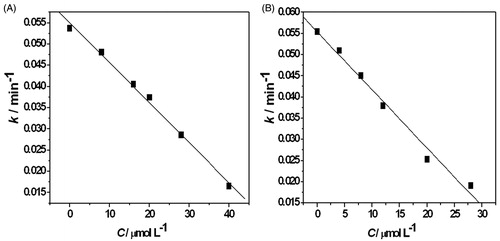
Table 1. The thermal and dynamic parameters of the inhibition of the MIZ and ECZ to the metabolism of Candida albicans.
Inhibition ratio and fifty percent inhibition concentration of MIZ and ECZ
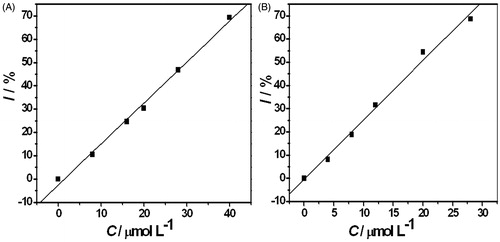
Linear fitting could be applied to drug concentrations and the inhibition rate. The fitting lines are shown in . The half inhibition concentration (IC50) values of both drugs were calculated from the fitting lines. According to the linear relation, the IC50 values of MIZ and ECZ for C. albicans were 19.72 and 29.90 μmol L−1, respectively.
Figure 4. Linear fitting of the drug concentration and the inhibition rate. (A) CECZ: 0, 8, 16, 20, 28, and 40 μmol L−1; I = −2.48 + 1.755c; (B) CMIZ: 0, 4, 8, 16, 20, 28, and 40 μmol L−1; I = −0.50 + 2.56c.
Electrochemistry study of Fe3+ metabolism in the presence of MIZ and ECZ
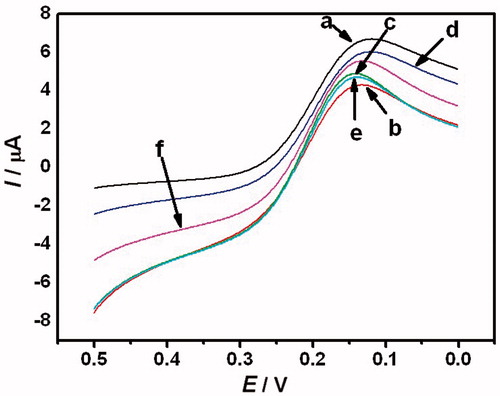
Voltammogram of Fe3+ solution in the presence of different drug concentrations is given in . The culture medium without any drugs and C. albicans shows the highest peak current of 6.690 μA, which reflects the total content of Fe3+ in the culture medium. The value was used as a control. Meanwhile, C. albicans without any drugs shows the lowest peak current of 4.096 μA. This is the result of reducing of Fe3+ to Fe2+ through C. albicans metabolism. In the presence of MIZ at the concentrations of 12 and 40 μmol L−1, the peak currents of culture medium increase to 4.887 and 6.024 μA, respectively. A similar result was observed after adding of ECZ. The peak currents of C. albicans in the presence of 20 and 48 μmol L−1 ECZ were 4.701 and 5.544 μA, respectively.
Figure 5. Voltammogram of Fe3+ in Candida albicans/MIZ and Candida albicans/ECZ systems. (a) The control of culture medium; (b) the control of C. albicans; (c and d) the C. albicans cultured with 12 μmol L−1 and 40 μmol L−1 MIZ; (e and f) the C. albicans cultured with 20 μmol L−1 and 48 μmol L−1 ECZ. The voltage was started at 0.5 V and ended in 0 V. The scan rate was 50 mV s−1.
Morphological observation using TEM
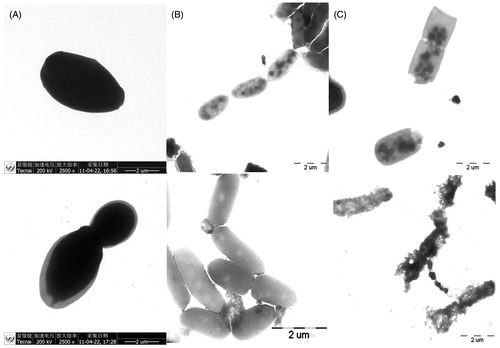
Information about the influence to the fungi form is helpful to the research of drug action mechanism (Vasilas et al., Citation1992). shows TEM images of C. albicans in the absence and presence of different concentrations of MIZ and ECZ. Natural C. albicans growing without any drugs appears oval and spheroidic with a length of about 2–4 μm. The cells show quite low transparency and very clear edges. Little light could pass through the cells. In the presence of 16 μmol L−1 ECZ, C. albicans were deformed slightly and began to swell. The transparency of the cells became higher [see (left)]. When the concentration of ECZ increases to 28 μmol L−1, further deforming and swelling were observed. The outside structure of the cells is partly damaged. Some cells even burst into pieces. Vacuoles could be seen in most cells obviously. However, a rough shape could still be observed for most cells. For the cells cultured with MIZ, a similar influence to cells was observed in the presence of only 12 μmol L−1 MIZ. When the concentration of MIZ increased to 28 μmol L−1, the whole cell structure was deformed. Almost all cells could not maintain the shapes and burst into pieces.
Figure 6. TEM images of Candida albicans with and without drugs. (A) The images of Candida albicans in the absence of drugs; (B) the images of C. albicans in the presence of 16 μmol L−1 ECZ (left) and 28 μmol L−1 ECZ (right); (C) the images of C. albicans in the presence of 12 μmol L−1 MIZ (left) and 28 μmol L−1 MIZ (right).
The interaction of the MIZ and ECZ with HSA
Study of the binding constants using electrochemistry method
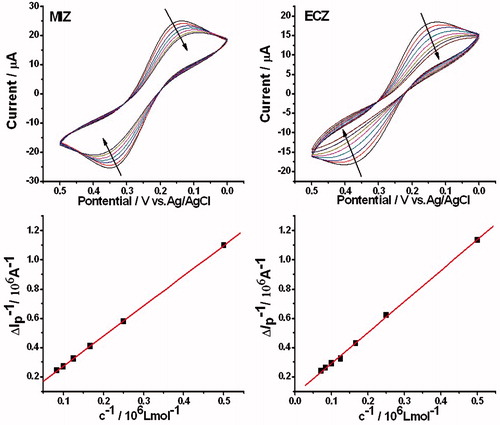
The cyclic voltammograms of MIZ/HSA and ECZ/HSA systems, as well as the plots of the 1/ΔIpmax to 1/c are shown in . The reciprocal of peak current difference and concentrations of the drugs show a good linear relationship. Through linear fitting of the plots, the binding constants of MIZ and ECZ of 2.36 × 10⁴ L mol−1 and 3.73 × 10⁴ L mol−1 were obtained.
Figure 7. Cyclic voltammograms of MIZ/HSA and ECZ/HSA systems and the plots of reciprocal of peak current difference and concentrations of the drug. CMIZ = CECZ = 0, 2, 4, 6, 8, 10, 12, and 14 × 10−6 mol L−1.
Study of the binding sites using fluorescence measurement
The fluorescence spectra of MIZ/HSA and ECZ/HSA systems in the presence of different site markers are shown in and . In order to investigate the binding sites of two drugs, the fluorescence intensity and the drug concentrations were plotted according to Equation (6). The plots and the fitting lines are shown in . Quenching constants were calculated and listed in .
Figure 8. The fluorescence spectra of HSA in the presence of MIZ at different concentrations, and the influence of site-markers warfarin (B) and ibuprofen (C) to the spectra of HSA-MIZ system. CMIZ (a–h) = 0, 0.5, 1, 1.5, 2, 2.5, 3, and 3.5 (×10−6 mol L−1).
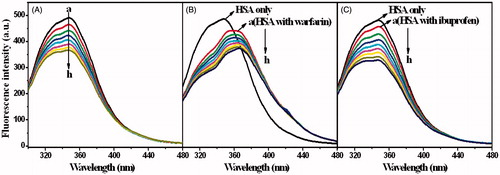
Figure 9. The fluorescence spectra of HSA in the presence of ECZ at different concentrations, and the influence of site-markers warfarin (B) and ibuprofen (C) to the spectra of HSA-ECZ system. CECZ (a–h) = 0, 0.5, 1, 1.5, 2, 2.5, 3, and 3.5 (×10−6 mol L−1).
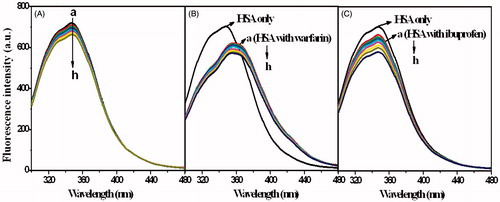
Figure 10. Stern–Volmer plots for the quenching of HSA-drug systems in the presence of site competitors.
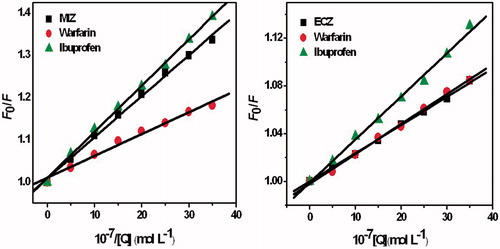
Table 2. The Stern–Volmer constants of competitive experiments of MIZ-HSA and ECZ-HSA systems.
shows that the addition of ibuprofen barely influences the quenching constant of MIZ, while that of ECZ was increased from 2.36 × 10³ L mol−1 to 3.69 × 10³ L mol−1. Addition of warfarin shows obvious influence to the MIZ/HSA system. The quenching constant was decreased from 9.71 × 10⁴ L mol−1 to 5.17 × 10⁴ L mol−1. In addition, only a slight change of the quenching constant of the ECZ/HSA system was observed.
Molecular modeling study
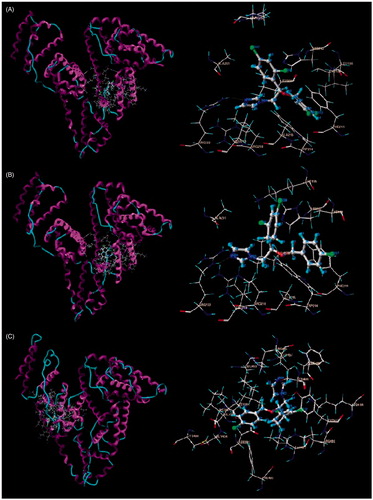
For MIZ, the docking scores (stands for pKd) of the best binding conformation in site I and site II are 5.60 and 4.79, respectively. For ECZ, the docking scores are 5.63 and 5.85 in site I and site II, respectively. In order to get a better insight into the binding conformations and residues involved, the docking results of two drugs were analyzed and shown in . There are more than 10 residues within a distance of 5 Å for both drugs.
Figure 11. Sites and preferred conformations of MIZ and ECZ binding on HSA. (A) MIZ binding on site I; (B) ECZ binding on site I; (C) ECZ binding on site II.
Discussion and conclusion
Four phases were shown in the microbial metabolic cycle: lag phase, exponential phase of growth, stationary phase, and decline phase (Liu et al., Citation2010). With the addition of the both drugs, the lag phase of the C. albicans was prolonged. The exponential phase was delayed and the maximum thermal power was reduced. The lag phase of the C. albicans was delayed 88 min with a low concentration of MIZ, which shows higher efficiency than ECZ. In the presence of higher concentrations of both drugs, MIZ shows higher significant inhibition to the metabolism of the C. albicans. At a concentration of 20 μmol·L−1 of MIZ, the heat released was quite low with a value of less than 10 μW. Hardly any heat was found during the entire 700 min when the concentration of MIZ was as high as 28 and 40 μmol·L−1. For C. albicans with the same concentrations of ECZ, the peak value of heat output during the lag phase could still be as high as 35 μW and 28 μW. Clear pulses between each growth phases were observed when the concentration of ECZ was lower than 28 μmol L−1. When the concentration increased to 28 μmol L−1 and 40 μmol L−1, the regular metabolic cycle was disturbed.
The metabolic thermal power in exponential phase of fungi growth fits an exponential model (Zhao et al., Citation2011). Compared with ECZ under the same concentrations, C. albicans shows a lower growth rate constant and longer generation time with MIZ. Longer generation time tG reflects slower growth and stronger inhibition of the drugs to the fungi growth. It is worth noticing that the total heat output is still high for the systems with ECZ. The Pm value of 28 μmol L−1 and 40 μmol L−1 ECZ is still as high as 28.07 μW and 14.87 μW. The observation suggests that unlike the thorough inhibiting of MIZ, ECZ inhibits the C. albicans by disturbing the metabolic cycle. IC50 value is an important value in the pharmacology study (Trosken et al., Citation2006), which is defined as the concentration of the inhibitor when the growth rate constant of the fungi is half decreased. It is widely used to evaluate the drug effect or toxicity. Compared with ECZ, the lower IC50 of MIZ indicates a stronger drug effect.
The content of Fe3+ in the culture medium could reflect the metabolic activity of C. albicans (Tarinc et al., Citation2010). Higher concentration of MIZ in C. albicans culture leads to higher content of Fe3+, which indicates efficient inhibition of metabolism and propagation of C. albicans. The influence of ECZ to the content of Fe3+ is much weaker than that of MIZ, since a higher peak current was observed for lower concentration of MIZ. This is exactly the evidence of weaker inhibition of ECZ to the metabolism and propagation of C. albicans. The result is in correspondence with the observation of the microcalorimetry experiments.
Series TEM images show obvious drug effect of MIZ and ECZ to C. albicans. Destructive effect is proved and observed directly. Stronger influence of MIZ was observed from the images of C. albicans in the presence of the same concentrations of both drugs, which indicated better antifungal activity of MIZ than ECZ. In addition, different damage of both drugs to the cells suggest different drug action mechanisms. He et al. (Citation2011) studied drug sensitivity for both drugs. The minimum inhibitory concentrations (MIC) for ECZ and MIZ were tested as 5 μg/mL and 3 μg/mL, respectively. The result is consistent to the observation that MIZ shows higher sensitivity to C. albicans than ECZ. More detailed mechanisms for the difference remains for future studies and molecular experiments.
Using the HSA modified gold electrode, the interaction of the drugs and HSA was studied by measuring the peak current of electrolyte solution (Han et al., Citation2012). The peak current decreased with the addition of both drugs. The drugs could achieve the target position through an efficient transportation process, since strong binding with HSA was observed for both drugs. It is obvious that the peak current of ECZ decreased much quicker than that of MIZ, which indicates a stronger binding with HSA for ECZ. ECZ shows a binding constant as high as 1.58-times of MIZ. Thus, ECZ binds with transport protein faster and is released slower.
HSA has three homologous domains (I–III): I (residues 1–195), II (residues 196–383), and III (residues 384–585). Each domain has two sub-domains (A and B) that contain six or four α-helices (Sugio et al., Citation1999). Most hydrophobic amino acids of the α-helices form two cylindric pockets. The main drug-binding sites in HSA are located in sub-domains IIA and IIIA, which are known as Sudlow's site I and site II. Warfarin and ibuprofen could be used as binding site markers for site I and site II, respectively (Sułkowska, Citation2002). In the fluorescence state emission experiments, the emission intensity keeps decreasing with addition of the drugs. MIZ shows a much stronger quenching effect to HSA than ECZ. In the site competition experiments, the intensity decreased appreciably and the emission peak shifted to longer wavelength after adding the warfarin. Addition of the ibuprofen only caused a certain decrease of intensity. Both drugs showed quenching effect to HSA in the presence of two site competitors. The result indicates that MIZ mainly binds on the site I, and ECZ mainly on site II.
In order to get a better understanding of the binding modes of the drugs and HSA, the docking method was used to investigate the binding site and preferred conformations (Cui et al., Citation2008). Two drugs were docked into site I and site II separately. Since a higher score indicates lower Kd and larger binding constant, the main binding site for MIZ is site I (Abootorabi et al., Citation2011). ECZ shows binding on both sites, with slight higher selectivity on site II. The conjugate plane of benzene ring of MIZ preferred the orientation of face–face with the intrinsic fluorescence residue TRP 214. This orientation is beneficial for efficient energy transfer since π–π electron cloud overlapped very well. Meanwhile, the benzene ring plane of ECZ showed a certain angle with TRP 214 in site I and TYR 411 in site II. The conformations were not helpful for efficient energy transfer, and finally lead to a lower quenching constant compared with that of MIZ. The result explains the observation obtained in the fluorescence experiments and gives further confirmation.
In conclusion, the drug effect and binding property with transport protein HSA of miconazole (MIZ) and econazole (ECZ) were systematic studied using microcalorimetry, electrochemistry study, TEM, fluorescence study, and molecular modeling method. Microcalorimetric experiments indicated that different changes of C. albicans growth and metabolism were caused at different drug concentrations. With the drug concentration increases, the maximum thermogenic power was reduced, the growth rate became slower, the generation time was extended, and the total heat of metabolism was decreased. The result shows that both drugs are highly efficient. By comparing the half inhibitory concentration, MIZ showed higher efficiency and stronger effect than ECZ. Meanwhile, same results were concluded by electrochemical method and TEM technology. Experimental results show that the combination of the ECZ-HSA constants greater than MIZ-HSA. Site competition experiments using fluorescence spectrometry indicated that MIZ mainly binds on site I, ECZ binds on both sites with more powerful in conjunction with site II. Using molecular simulation methods, electrochemical and theoretical analyses of fluorescence experiments were proved reliable and the experiment results were further explored.
Declaration of interest
The authors report no declarations of interest.
References
- Abootorabi TZ, Saberi M, Chamani J. (2011). The investigation of the HAS cyclophosphamide interaction as a binary system by molecular docking. Clin Chem 44:220–1
- Anonymous. (2002). Voriconazole. Med Lett Drugs Ther 44:63–5
- Arveiller MR, Maman HL, Giroud JP, Sorenson JR. (1990). Non-steroidal anti-inflammatory drug–copper complex modulation of polymorphonuclear leukocyte migration. Biochem Pharmacol 39:569–74
- Buckton G, Russel SJ, Beezer AE. (1991). Pharmaceutical calorimetry: A selective review. Thermochim Acta 193:195–214
- Carter DC, Ho JX. (1994). Structure of serum albumin. Adv Protein Chem 45:153–203
- Chowdhry BZ, Beezer AE, Greenhow EJ. (1983). Analysis of drugs by microcalorimetry: Isothermal power-conduction calorimetry and thermometric titrimetry. Talanta 5:209–43
- Como JA, Dismukes WE. (1994). Oral azole drugs as systemic antifungal therapy. New Engl J Med 330:263–72
- Cui FL, Zhang QZ, Yan YH, et al. (2008). Study of characterization and application on the binding between 5-iodouridine with HSA by spectroscopic and modeling. Carbohydr Polym 73:464–72
- Ghannoum MA. (1997). Future of antimycotic therapy. Dermatol Ther 3:104–11
- Gupta AK, Sauder DN, Shear NH. (1994). Antifungal agents: An overview. Dermatology 30:677–98
- Han XL, Tian FF, Ge YS, et al. (2012). Spectroscopic, structural and thermodynamic properties of chlorpyrifos bound to serum albumin: A comparative study between BSA and HSA. J Photochem Photobiol B 109:1–11
- He L, Hao JH, Zhang JH, et al. (2011). Minimum inhibitory concentration detection of 9 antifungal drugs to Candida albicans from vulvovaginal candidiasis. Int J Lab Med 43:446–7
- Humphrey W, Dalke A, Schulten K. (1993). VMD – Visual molecular dynamics. J Mol Graphics 14:33–8
- Helmeste DM, Tang SW, Vu R. (1998). Inhibition of platelet serotonin uptake by cytochrome P450 inhibitors miconazole and econazole. Life Sci 62:2203–8
- Koch AL. (1993). Biomass growth-rate during the prokaryote cell-cycle. Crit Rev Microbiol 19:17–42
- Kovarova-Kovar K, Egli T. (1998). Growth kinetics of suspended microbial cells: From single-substrate-controlled growth to mixed-substrate kinetics. Microbiol Mol Biol R 62:646–66
- Kroemer RT, Hecht P, Liedl KR. (1996). Different electrostatic descriptors in comparative molecular field analysis: A comparison of molecular electrostatic and coulomb potentials. J Comput Chem 17:1296–308
- Lakowicz JR. (2006). Principles of Fluorescence Spectroscopy, 3rd ed. New York: Plenum Press Publisher
- Lida F, Sara B, Majid MH. (2009). Electrochemistry of the interaction of furazolidone and bovine serum albumin. Bioelectrochemistry 77:26–30
- Liu L, Lin GM, Shao W. (2010). Application of microcalorimetry in the research of microorganism and cell. Pharm Biotech 17:79–82
- Mayer FL, Wilson D, Bernhard H. (2013). Candida albicans pathogenicity mechanisms. Virulence 4:250–385
- Mangas-Sánchez J, Busto E, Gotor-Fernández V, et al. (2011). Asymmetric chemoenzymatic synthesis of miconazole and econazole enantiomers. The importance of chirality in their biological evaluation. J Org Chem 76:2115–22
- Ranjard L, Lignier L, Chaussod R. (2006). Effects of short-term polymetal contamination on soil bacterial community structure. Appl Environ Microb 72:1684–7
- Roberts-Thomson SJ, Peters AA, Grice DM, Monteith GR. (2010). ORAI-mediated calcium entry: Mechanism and roles, diseases and pharmacology. Pharmacol Ther 127:121–30
- Scaringi L, Blasi E, Cornacchione P, et al. (1991). A rapid Candida albicans hyphal form growth inhibition assay determination of myelomonocytic mediated antifungal activity. Mycoses 34:119–23
- Sudlow G, Birkett DJ, Wade DN. (1975). The characterization of two specific drug binding sites on human serum albumin. Mol Pharmacol 11:824–32
- Sugio S, Kashima S, Mochizuki M, Noda KK. (1999). Crystal structure of human serum albumin at 2.5 Å resolution. Protein Eng Des Sel 12:439–46
- Sułkowska A. (2002). Interaction of drugs with bovine and human serum albumin. J Mol Struct 614:227–32
- SYBYL Software, Version 8.1. (2008). St. Louis (MO): Tripos Associates Inc
- Tannock GW. (1994). Normail Microflora: An Introduction to Microbes Inhabiting the Human Body. 1st ed. London, UK: Springer Publisher
- Tarinc D, Dogan-Topal B, Dolaz M, et al. (2010). Synthesis, characterization, biological activity and voltammetric behavior and determination of cefaclor metal complexes. Curr Anal Chem 6:316–28
- Trosken ER, Adamska M, Arand M, et al. (2006). Comparison of lanosterol-14 alpha-demethylase (CYP51) of human and Candida albicans for inhibition by different antifungal azoles. Toxicology 228:24–32
- Vasilas A, Molina L, Hoffman M, Haidaris CG. (1992). The influence of morphological variation on Candida albicans adhesion to denture acrylic in vitro. Arch Oral Biol 8:613–22
- Wang JM, Wolf RM, Caldwell JW, et al. (2004). Development and testing of a general amber force field. J Comput Chem 25:1157–74
- Xu XJ, Xue Z, Xiao Q, et al. (2008). Antibacterial activities of novel diselenide-bridged bis(porphyrin)s on staphylococcus Staphylococcus aureus investigated by microcalorimetry. Biol Trace Elem Res 125:185–92
- Zhao J, Zheng X, Xing W, et al. (2007). Electrochemical studies of camptothecin and its interaction with human serum albumin. Int J Mol Sci 8:42–50
- Zhao YL, Wang JB, Yan D, et al. (2011). Study of the quantitative quantity–activity relationship of four ginsenosides on splenic lymphocytes growth by microcalorimetry. J Therm Anal Calorim 104:375–82