
Abstract
Context Numerous studies have reported that propolis possesses strong antioxidant activities. However, their antioxidant molecular mechanisms are unclear.
Objective We utilize ethanol extracts of Chinese propolis (EECP) as a reference to compare ethanol extracts of Eucalyptus propolis (EEEP) with ethanol extracts of Baccharis propolis (EEBGP) based on their antioxidant capacities and underlying molecular mechanisms.
Materials and methods HPLC and chemical analysis are utilized to evaluate compositions and antioxidant activities. ROS-eliminating effects of EEBGP (20–75 μg/mL), EEEP (1.25–3.75 μg/mL) and EECP (1.25–5 μg/mL) are also determined by flow cytometry analysis. Moreover, we compared antioxidant capacities by determining their effects on expressions of antioxidant genes in RAW264.7 cells with qRT-PCR, western blot and confocal microscopy analysis.
Results EEBGP mainly contains chlorogenic acid (8.98 ± 0.86 mg/g), kaempferide (11.18 ± 8.31 mg/g) and artepillin C (107.70 ± 10.86 mg/g), but EEEP contains 10 compositions, whereas EECP contains 17 compositions. Meantime, although EEEP shows DPPH (IC50 19.55 ± 1.28), ABTS (IC50 20.0 ± 0.31) and reducing power (2.70 ± 0.08 mmol TE/g) better than EEBGP’s DPPH (IC50 43.85 ± 0.54), ABTS (IC50 38.2 ± 0.33) and reducing power (1.53 ± 0.05 mmol TE/g), EEBGP exerts much higher ROS inhibition rate (40%) than EEEP (under 20%). Moreover, EEBGP strengthen antioxidant system by activating p38/p-p38 and Erk/p-Erk kinase via accelerating nucleus translocation of Nrf2. EEEP and EECP improve antioxidant gene expression only via Erk/p-Erk kinase-Nrf2 signalling pathway.
Discussion and conclusion EEBGP and EEEP exert antioxidant activities via different molecular mechanisms, which may depend on chemical compositions.
Keywords:
Introduction
Propolis is a resinous substance that honeybees collect from the buds, leaves and exudates of trees and mix with their secretions, which include an abundance of flavonoids and phenolic esters (Athikomkulchai et al. Citation2013). Propolis has been used in folk medicine for centuries worldwide and is now known as a natural medicine with broad-spectrum pharmacological activities (Castaldo & Capasso Citation2002), including antioxidant (Ahn et al. Citation2007), anti-inflammatory (Wang et al. Citation2013), anticancer (Ishihara et al. Citation2009), antibacterial (Petrova et al. Citation2010), antidiabetic (Fuliang et al. Citation2005) and hepatoprotective (Zhu, Li et al. Citation2011) activities. However, the chemical compositions and pharmacological activities of propolis vary depending on the plant’s source. Propolis has been classified as seven types, according to the plant sources, including Poplar propolis (Populus spp.), Eucalyptus propolis (Abu et al. Citation2012), Baccharis propolis (dos Santos Pereira et al. Citation2003) (Brazil green propolis), Clusia (Hernandez et al. Citation2005) (Brazil red propolis), Macaranga propolis (Wei et al. Citation2007) (Taiwanese green propolis), Betula propolis and Mediterranean propolis (Popova et al. Citation2010). Poplar propolis and Baccharis propolis are commercially available as daily healthcare products and cosmetics on the market, which is a result of their effective pharmacological activities, especially their antioxidant activity. One study revealed that Baccharis propolis exhibits good hepatoprotective effects both in vivo and in vitro, which is related to its antioxidant activity (Paulino et al. Citation2014). A previous study also showed that the water extract of Baccharis propolis exerts neuroprotective effects via antioxidant actions (Nakajima et al. Citation2007). Additionally, Australia is covered with Eucalyptus plants, and it has been reported that Eucalyptus propolis possesses stronger free radical scavenging activities than does Baccharis propolis (Abu et al. Citation2012). Thus, Eucalyptus propolis may be a potential healthcare product.
Numerous systemic and cellular dysfunctions can potentially contribute to the over-production of reactive oxygen species (ROS), including hyperglycaemia, dyslipidemia, endoplasmic reticulum (ER) stress, advanced glycation end-products, nitric oxide synthase and lipid peroxides, all of which evoke oxidative stress in cells and in plasma (Henriksen et al. Citation2011). Short-term oxidative stress induces inflammation, and persistent oxidative stress can cause some ailments. A previous study revealed that mitochondrial oxidative stress amplifies atherosclerosis by promoting nuclear factor-κB-mediated inflammation in macrophages (Wang, Wang, et al. Citation2014). Moreover, evidence has shown the linkage between oxidative stress and inflammation (Salzano et al. Citation2014). Our previous studies have confirmed that propolis possess anti-inflammatory effects both in vivo and in vitro (Wang et al. Citation2013; Wang, Zhang, et al. Citation2014). Therefore, propolis may enhance the antioxidant prevention system in RAW264.7 cells against inflammation. Moreover, our previous study also confirmed that Chinese propolis (Poplar propolis) and Brazil green propolis can alleviate symptoms of diabetes mellitus by improving the levels of superoxide dismutase, catalase and glutathione peroxidase and by inhibiting malonaldehyde production in rats (Zhu, Chen, et al. Citation2011; Zhu, Li, et al. Citation2011). However, other evidence has shown that oxidative stress is associated with diabetes and its complications (Giacco & Brownlee Citation2010; Brasnyo et al. Citation2011). Although the antioxidant roles of propolis have been extensively reported in vivo and in vitro, the antioxidant capacity and potential molecular antioxidant mechanisms of Baccharis propolis and Eucalyptus propolis remain unclear. Additionally, considering the chronically harmful role of oxidative stress in health, a comparison study on the antioxidant activities and the molecular mechanisms of Baccharis propolis and Eucalyptus propolis in comparison to Poplar propolis is important.
Previously, we studied the quality control of Chinese propolis (Poplar propolis) (Zhang et al. Citation2011; Huang, Zhang, et al. Citation2014) and its pharmacology activities in vitro and in vivo (Hu et al. Citation2005; Zhu, Li, et al. Citation2011; Wang, Zhang, et al. Citation2014). Thus, in this study, the ethanol extracts of Poplar propolis (EECP) were viewed as a criterion to evaluate the antioxidant activities and molecular mechanisms of the ethanol extracts of Baccharis propolis (EEBGP) and the ethanol extracts of Eucalyptus propolis (EEEP) in RAW264.7 cells. The main chemical compositions and free radical scavenging capacities were determined by high-performance liquid chromatography (HPLC) and phytochemical analysis, respectively. We also assessed their ROS elimination activity and measured the expression of HO-1, GCLM (glutamate–cysteine ligase modifier subunit), GCLC (glutamate–cysteine ligase catalytic subunit) and TrxR1 (thioredoxin reductases 1) in RAW264.7 cells to further evaluate the antioxidant activities of EECP, EEBGP and EEEP. Moreover, we studied the modulated roles of MAPKs on the expression of antioxidant genes stimulated by EEEP, EEBGP and EECP. Additionally, the location of Nrf2 (nuclear factor erythroid 2-related factor 2) was determined by confocal microscopy analysis in the presence or absence of EEEP, EEBGP and EECP. To our knowledge, this is the first study to compare EEBGP and EEEP with EECP based on their antioxidant activities and molecular mechanisms.
Materials and methods
Materials
Alkaline phosphatase-conjugated secondary antibody (anti-rabbit IgG), DPPH, ABTS, Trolox, pinocembrin, gallic acid, quercetin and the standards used in the HPLC analysis were purchased from Sigma (St. Louis, MO). Primary rabbit antibodies against HO-1 (lot#:YJ071709CS, monoclonal), GCLM (catalogue#: 5529-1, monoclonal), TrxR1 (lot#: YI012101C, monoclonal), β-tubulin (lot#: YH082302D, monoclonal), p38 (lot#: YF120305C, monoclonal), Erk1 phospho/Erk2 Phospho (p-Erk) (lot#: YH072803C, monoclonal), JNK1 phospho/JNK2 phospho/JNK3 phospho (p-JNK) (lot#: YK031401CS, monoclonal), JNK1(lot#: YH081203, monoclonal), AKt1 (lot#: YJ051502DS, monoclonal) and AKt1 phospho (p-Akt1) (lot#: YH032209C, monoclonal) were purchased from Epitomics (Burlingame, CA). A primary rabbit antibody against phosphor-p38 MAPK (Thr180/Tyr182) (p-p38) (lot#: 4, monoclonal) was purchased from Cell Signaling Technology (Danvers, MA), and an anti-Nrf2 (ab31163, polyclonal) antibody was purchased from Abcam (Cambridge, MA). SB203580, SP600125, LY294002 and PD98059 were obtained from Selleckchem (Houston, TX). Other analytical grade chemicals were purchased from Sangon Biotechnology Co., Ltd. (Shanghai, China).
The collection and extraction of propolis
Poplar raw propolis was obtained from colonies in Shandong, China. Baccharis raw propolis was supplied by the Fengnaibao Company (Nanjing, China), and Eucalyptus raw propolis was collected from colonies in South Australia. All of the raw propolis were collected by Apis mellifera and extracted according to a previously described method (Wang et al. Citation2013). Propolis (Poplar raw propolis, Baccharis raw propolis, Eucalyptus raw propolis) (50 g) was dissolved in 95% ethanol (200 mL) and sonicated for 3 h at 40 °C. The solutions were filtered with Whatman No. 4 filter paper, and the residues were collected and extracted twice (150 mL ethanol each time). The filter solutions were collected together and filtered to remove wax after being stored at 4 °C overnight. All of the supernatants were collected, evaporated and dried to a constant weight at 50 °C in an oven. After drying, the residues were collected and weighed. The propolis yield was calculated according to the method (GB/T 24283-2009). A voucher specimen of the samples (no. 130520) was deposited at the College of Animal Sciences, Zhejiang University. Before the experiment, the EECP, Baccharis propolis and Eucalyptus propolis were redissolved in ethanol and filtered with a 0.22-μm syringe filter. During all experiments, the final concentration of ethanol in the medium did not exceed 0.1% (v/v), which is a safe concentration in RAW264.7 cells.
Total phenolic content
Total phenolic content (TPC) was measured by the modified Folin-Ciocalteu method (Yang et al. Citation2011). Briefly, the reaction solutions (450 μL distilled water, 10 μL sample) were vortexed for 3 min after adding 10 μL Folin-Ciocalteu reagent. Then, the solution was mixed with NaCO3 (30 μL, 2%) and incubated at room temperature for 3 h. Finally, the absorbance was measured at 760 nm (200 μL/well in a 96-well plate). The results were expressed as gallic acid equivalent (GAE) per gram of sample.
Total flavonoid content
Total flavonoid content (TFC) was determined according to the modified method (Yang et al. Citation2011). AlCl3 (150 μL, 2%) was mixed with 150 μL of the ethanol extracts of propolis in a 96-well plate. After incubation at room temperature for 15 min, the absorbance was measured at 435 nm. The results were expressed as milligrams of rutin equivalent (RE) per gram of sample.
Flavonone and dihydroflavonol content
Flavonone and dihydroflavonol content (FDC) was determined by a previously described method with minor modifications (Miguel et al. Citation2010). Briefly, 5 mg of DNP (2,4-dinitrophenylhydrazine) was dissolved in 100 μL 96% sulphuric acid and diluted to 100 mL with methanol. The reactions consisted of 40 μL sample solution and 80 μL DNP solution and incubated at 50 °C for 50 min, cooled and diluted with 280 μL 10% KOH–methanol solutions. Finally, 20-μL reactions were diluted to 1 mL with methanol. The absorbance was determined at 486 nm, and the results were expressed as pinocembrin equivalent per gram of sample.
HPLC analysis of propolis
To study the main compositions of flavonoids and phenolic acids in EEBGP and EEEP, HPLC was conducted according to a previously described method (Cui-Ping et al. Citation2014), and EECP was analysed as a reference. In brief, a Sepax HP-C18 column (150 mm × 4.6 mm, 5 μm; Sepax Technologies, Inc., Newark, DE) was equipped for all analyses. The mobile phase was composed of 1.0% aqueous acetic acid (v/v) (A) and methanol (B) in the gradient mode at 33 °C as follows: 15–40% (B) at 0–30 min, 40–55% (B) at 30–65 min, 55–62% (B) at 65–70 min, 100% (B) at 70–85 min at a flow rate of 1.0 mL/min. The effluent was detected at 280 nm. The injection volume was 5 μL. The monomers that we chose were the main flavonoids and phenolic acids in propolis.
Determination of free radical scavenging activities and reducing power
ABTS cation radical scavenging activity (ABTS)
The ABTS cation radical scavenging activity was measured according to the modified method reported previously (Yang et al. Citation2011). In brief, 100 μL ABTS working solution and 50 μL sample were aliquoted into the 96-well plate. The absorbance was read at 734 nm after the reactions were incubated for 10 min in the dark. The results were expressed as IC50 (μg/mL).
DPPH radical scavenging activity (DPPH)
The hydrogen donating activity was evaluated by direct hydrogen donation to the DPPH radical, according to a previous report with minor modification (Yang et al. Citation2011). The reaction solution included sample and DPPH solutions (1:1), and 100 μL reactions per well were incubated in a 96-well plate at room temperature for 30 min in the dark. The absorbance was detected at 517 nm, and the results were expressed as IC50 (μg/mL).
Superoxide anion radical scavenging activity (SRSA)
The reaction system was modified according to a previously described method (Guanglei & Du Citation2011). Propolis solutions or ethanol (20 μL) and NBT (300 μL, 150 μmol/L) were complemented with NADH (300 μL, 468 μmol/L). Then, PMS (300 μL, 60 μmol/L) was added to the mixture and incubated at room temperature for 10 min, and the reaction mixture was transferred to a 96-well plate (200 μL/well and repeats). The absorbance was read at 560 nm. The superoxide anion radical scavenging activities were expressed as Trolox equivalent (mmol) per gram of propolis.
Oxygen radical absorbance capacity (ORAC)
The ORAC values were determined by M5 according to the previously described method (Shi et al. Citation2012). Fluorescence (225 μL/well, 8.163 × 10⁻⁸ mol/L) was incubated with the sample, blank or trolox solutions (30 μL/well) in a 96-well black polystyrene plate (Costar, USA) at 37 °C for 20 min. Then, AAPH (25 μL, 0.36 M) was added to the mixture and measured every minute for 2 h immediately (excitation wavelength 485 nm and emission wavelength 535 nm). The results were expressed as the Trolox equivalent (mmol) per gram of propolis.
Reducing power measurement (RP)
The power of reducing ferric ions was measured by a modified method (Guo et al. Citation2011). Propolis (125 μL) was mixed with 312.5 μL phosphate buffer (0.2 M, pH 6.6) and potassium ferrocyanate (312.5 μL, 1%). The mixture was preheated at 50 °C for 20 min, followed by adding trichloroacetic acid (312.5 μL, 10%) to the mixture. Then, the mixture was centrifuged at 2000 rpm for 10 min. The reaction solution consisted of the supernatant (1 mL), 312.5 μL distilled water and ferric chloride (62.5 μL, 0.1%). The reaction solution (400 μL) was pipetted into the 96-well plate (200 μL/well), and the absorbance was measured at 700 nm; trolox was used as the reference sample. The results were expressed as the Trolox equivalent (mmol) per gram of propolis.
Cell culture and cell viability assay
The murine macrophage RAW264.7 cell line was a gift provided by Professor Zongping Xia (Life Sciences Institute, Zhejiang University, China). RAW264.7 cells were cultured with culture medium, which consisted of DMEM (Keyi Biotechnology Company, Hangzhou, China) and 10% foetal bovine serum (Gibco, Grand Island, NY), at 37 °C and 5% CO2 in a humidified incubator. The toxicity of EECP, EEEP and EEBGP was determined by the CCK-8 assay kit (DOJINDO, Kumamoto, Japan), according to the manufacturer’s instructions. The absorbance was determined by an ELISA reader at 450 nm (Bio-Rad 680, VT, Hercules, CA).
Determine the level of ROS in RAW264.7 cells
RAW264.7 cells were cultured with the indicated concentrations of propolis for 0.5 h, followed by stimulation with 300 μM H2O2 for 13 h. Then, the cells were washed twice with PBS to remove the extracellular ROS and incubated with new culture medium coupled with 200 μM DCHF-DA for 30 min. After being removed from the culture medium and washed with PBS, the cells were collected by trypsin and centrifuged at 2500 rpm for 5 min twice to remove extracellular compounds. Then, the level of ROS was determined by a BD FACSCalibur (Franklin, NJ).
Quantitative real-time polymerase chain reaction analysis
After treating RAW264.7 cells with certain concentrations of EECP, EEEP and EEBGP for different times, the culture medium was removed, and total RNA was isolated with the RNApure Total RNA kit (AIdlab, Beijing, China). The concentrations of total RNA were determined using a Nano Drop spectrophotometer (ND-2000, NanoDrop Technologies, Shanghai, China). cDNA (1 μg RNA) was synthesized with primeScriptTM RT Reagent kit (TaKaRa, Dalian, China). Finally, cDNA was diluted (1:24) and utilized to conduct quantitative real-time polymerase chain reaction analysis (qRT-PCR) in a final volume of 7 μL with the Mastercycler ep realplex (Eppendorf, Hamburg, Germany) using a SYBR Premix Ex TagTM (TaKaRa) according to the manufacturer’s protocol. The reaction conditions were as follows: 95 °C for 30 s, 95 °C for 5 s and 60 °C for 30 s, followed by the melting curve analysis at 95 °C for 15 s, 50 °C for 15 s and 95 °C for 15 s. Electrophoresis was utilized to separate the PCR products by 1.5% agarose gel, which were stained with GoldView (SBS Genetech, Beijing, China) and visualized under UV light. All of the oligonucleotide primers were designed and synthesized by Sangon Biotech. The sequences of the primers are shown in .
Table 1. Sequences of the primers.
Preparation of protein and western blotting
At the harvest time, the cells were put on ice and washed with cold PBS immediately. Cytoplasmic proteins were lysed with NP40 mixed with protease inhibitors and phosphatase inhibitors, and the lysate was collected after being scraped by the cell scrapers (Corning, New York), vortexed and put on ice for 10 min. Subsequently, the lysate was centrifuged at 16 000 rpm for 10 min at 4 °C, and the supernatant was collected and added to a certain volume of Laemmli’s sample buffer, boiled at 95 °C for 10 min and stored at−80 °C. The concentration of protein was determined by the BCA protein assay kit (Weiao Biotechnology, Shanghai, China). The proteins were separated by 10% sodium dodecyl sulphate–polyacrylamide gel electrophoresis. Then, the gels were transferred to a polyvinylidene difluoride membrane (Millipore, Billerica, MA). The membrane was blocked by 5% non-fat milk for 1 h and incubated with primary antibody for 1 h at room temperature. After three washes with Tris-buffered saline Tween 20, the membrane was incubated with alkaline phosphatase-conjugated secondary antibody for 1 h. The membrane was washed three times and developed with the method (Wang et al. Citation2013).
To determine the location of Nrf2 by immunofluorescence laser scanning confocal microscope analysis
To determine the location of Nrf2, RAW264.7 cells were washed two times for 5 min and fixed with solutions (methanol–acetone, 1:1) for 30 min at room temperature. The cells were washed three times for 15 min and then incubated with PBST (0.5% TRITON, Sangon Biotechnology) for 30 min, followed by incubation with 10% goat serum (Boster Biological Technology, Wuhan, China) for 30 min at room temperature. The cells were treated with anti-Nrf2 antibody (1:100) overnight at 4 °C and at 37 °C for 30 min. After being washed with PBS, the cells were incubated with a secondary Alexa fluor 488-conjugated goat anti-rabbit IgG antibody (1:500) at 37 °C for 1 h. The cells were washed three times, and the nuclei were stained with DAPI (Beyotime Institute of Biotechnology, Shanghai, China) and then analysed by laser scanning confocal microscopy.
Statistical analysis
The data are expressed as the mean ± SD and are representative of three independent experiments. Statistical analysis of the data was conducted with Student’s t-test or one-way ANOVA using the Student–Newman–Keules method using the SPSS software (Chicago, IL) to determine significant differences. Values of p < 0.05 were considered statistically significant.
Results and discussion
The yield rate of propolis
The yield rate of EECP was 57.42%, the yield rate of EEEP was 56.36% and the yield rate of EEBGP was 58.06%. According to the standard (GB/T 24283-2009), the first-grade raw propolis requires an ethanol extract rate of raw propolis that is no lower than 60%. Hence, Poplar raw propolis, Baccharis raw propolis and Eucalyptus raw propolis were good raw propolis.
Determination of polyphenol contents and main composition contents of EECP, EEEP and EEBGP by phytochemical analysis and HPLC analysis
It is generally accepted that propolis has an abundance of polyphenols, which deeply contribute to the biological activities of propolis. As shown in , EEEP possessed the highest TPC value but contained the lowest TFC value. In contrast, EEBGP contained primarily TFC. Moreover, EECP contained the highest polyphenols compared with EEEP and EEBGP. Some studies have indicated that phenolic acids are attributed to the activities of Brazilian propolis (Bankova et al. Citation1995) but that flavonoids are considered to be the main effective compounds of European propolis extracts (Poplar propolis) (Hegazi et al. Citation2000). Thus, the differences in polyphenols between Baccharis propolis and Eucalyptus propolis contribute to their discrepancies in the biological activities.
Table 2. Total phenolic content (TPC), total flavonoid content (TFC) and flavonone, and dihydroflavonol content (FDC) of EECP, EEEP and EEBGP.Table Footnotea
The 22 monomers in EEBGP, EEEP and EECP were further detected by HPLC analysis; 19 of the monomers that we chose () were common in EECP, and the other 3 monomers () were often detected in EEBGP. HPLC chromatograms are shown in , and the contents of the monomers are displayed in . The standards were clearly separated by HPLC analysis (). Two monomers (vanillic and rutin) were not detected in EECP, EEPG and EEBGP, and the other monomers were relatively higher in EECP than in EEBGP and EEEP, except chlorogenic acid, kaempferide and artepillin C (, ). We detected 10 compositions in EEEP, and the total contents of the compositions in EEEP were higher compared with the seven compositions detected in EEBGP (, ). Interestingly, p-coumaric acid was very high in EEBGP but was not detected in EEEP and was low in EECP (, ). Moreover, the peaks of quercetin, chrysin and galangin detected in EEBGP were interferential peaks () because they were not detected by another HPLC method (data not shown). Interestingly, chlorogenic acid, kaempferide, and artepillin C were only detected in EEBGP, and their contents were extremely high, especially for artepillin C (, ). The results indicate that the compositions in EEEP were similar to EECP; however, considerable differences in the compositions exist in EEBGP and EECP. The discrepancies of the compositions of EEBGP, EEEP and EECP provide some insight into the differences in the antioxidant activities and molecular mechanisms.
Figure 1. HPLC chromatograms of the 22 monomers in EEBGP, EEEP and EECP. (A) 1, Vanillic acid; 2, caffeic acid; 3, p-coumaric acid; 4, ferulic acid; 5, isoferulic acid; 6, 3,4-dimethoxycinnamic acid; 7, rutin; 8, cinnamic acid; 9, pinobanksin; 10, naringenin; 11, quercetin; 12, luteolin; 13, kaempferol; 14, apigenin; 15, pinocembrin; 16, 3-O-acetylpinobanksin; 17, chrysin; 18, CAPE; 19, galangin. (B) 20, Chlorogenic acid; 21, kaempferide; 22, artepillin. (C) a, Standards; b, EEBGP; c, EEEP; d, EECP.
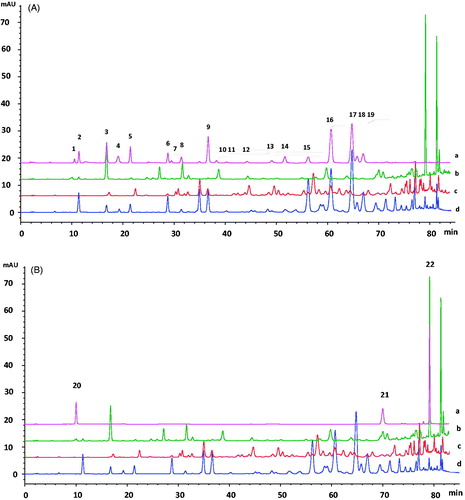
Table 3. Contents of the monomers in EEBGP, EEEP and EECP determined by HPLC analysis.Table Footnotea
Comparisons of free radical scavenging activities and reducing power of EEBGP and EEEP
Numerous studies have used phytochemical experiments, especially ABTS and DPPH methods, to detect the antioxidant capacities of natural products. Nevertheless, some authors have noted that there are problems in evaluating the antioxidant activities of multifunctional food when using a one-dimensional method (Frankel & Meyer Citation2000). Thus, five chemical reactions were used to evaluate the antioxidant capacities of EEEP, EEBGP and EECP.
The results of the evaluations of the free radical scavenging activities and reducing power of propolis are presented in . The results indicated that EEEP exerted more efficient capacities on scavenging DPPH free radicals and ABTS free radicals than did EECP, although EEBGP showed no significant difference compared with EECP. Moreover, EEEP showed a significant higher reducing power than did EECP, and EEBGP displayed a significantly lower reducing power than did EECP. However, EEEP acted less efficiently as a scavenger of superoxide anion in comparison to EECP, but EEBGP was as effective a scavenger as EECP. Furthermore, EEBGP showed inferior oxygen radical absorbance capacity compared with EECP, but EECP and EEEP had the same ability. Some studies have revealed that some phytochemical antioxidant assays (DPPH, FRAP and ABTS) have shortcomings and are based on similar redox reactions (electron transfer-based assays) (Apak et al. Citation2013), but the studies also admitted that it is important to use a single assay that is commonly accepted and validated (Huang et al. Citation2005). In the present study, three different assays were used, and the results () were in accordance with the reports. The present study also confirmed that the ORAC assay (hydrogen atom transfer-based assays) has been broadly applied in academics and the food and supplement industry as a method of choice to quantify antioxidant capacity (Huang et al. Citation2005). The previous study noted that in one laboratory, the results obtained by using one test system could be used for a ranking and that different methods (preferably with different mechanisms) need to be used to evaluate the antioxidant activities of natural food (Apak et al. Citation2013). However, the process of oxidative stress in the body is extremely complex, and phytochemical methods cannot simulate the reaction conditions in the body. Hence, the results merely gave summed or integrated parameters to evaluate the antioxidant activities of EEEP, EEBGP and EECP. Our subsequent cell experiments gave further confirmation for the antioxidant activities of EEEP, EEBGP and EECP.
Table 4. Free radical scavenging activities and reducing power of EECP, EEEP and EEBGP.Table Footnotea
The toxicities of EEEP, EEBGP and EECP in RAW264.7 cells
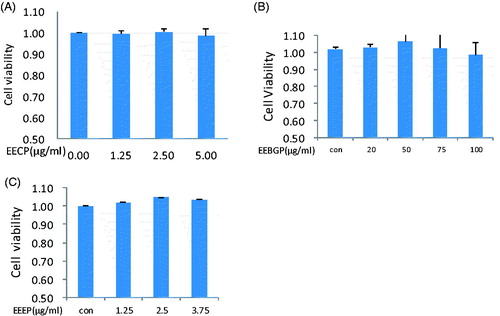
To further study the antioxidant activities and antioxidant molecular mechanisms of EEEP, EEBGP and EECP, RAW264.7 cells were cultured, and the toxicities of EEEP, EEBGP and EECP on RAW264.7 cells were measured. As shown in , EEEP, EEBGP and EECP had no toxicity in RAW264.7 cells at the indicated concentrations; however, higher concentrations of EECP, EEEP and EEBGP were toxic. Subsequent experiments were conducted at the safety concentrations.
Figure 2. The effects of EEEP, EEBGP and EECP on viability of RAW264.7 cells.
Inhibitory effects of EEBGP, EEEP and EECP on the production of ROS in RAW264.7 cells
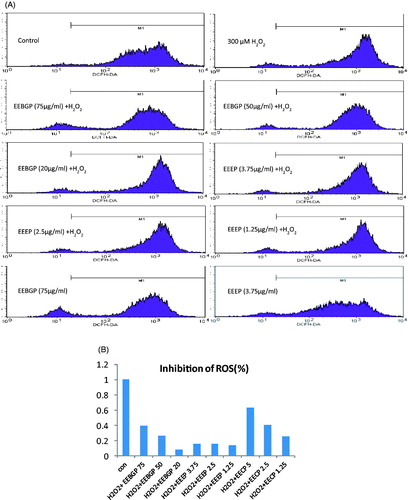
Numerous studies have revealed that propolis can inhibit the production of ROS (Tetsuro et al. Citation2012; Murase et al. Citation2013). To further confirm that EEBGP and EEEP can eliminate free radicals effectively, their elimination effects on ROS induced by H2O2 were measured, and their effects on normal RAW264.7 cells were detected. The results () showed that the peaks of the H2O2-treated group moved to the right compared with the control group, which indicated that H2O2 induced the production of ROS in RAW264.7 cells. Furthermore, the peaks of the propolis-treated group were restored (). The results indicated that EEBGP displayed stronger abilities to eliminate ROS than did EEEP but that EEBGP was slightly inferior to EECP. Additionally, these effects occurred in a dose-dependent manner. Although EEEP exerted the strongest free radicals scavenging activities and reducing power (), it showed the lowest ROS elimination effect. Moreover, the tolerance concentrations of EECP and EEEP were almost the same, but EECP indeed eliminated ROS more effectively than EEEP. These results indicate that evaluating the antioxidant activities with chemical analysis alone is not reliable. Although a previous study reported that ROS exert essential metabolic functions and that the removal of too many ROS can upset cell signalling pathways and actually increase the risk of chronic disease (Finley et al. Citation2011). In this study, EEBGP and EECP alleviated ROS to a level that was slightly lower than the normal level, whereas EEEP had slight elimination effects on ROS. Moreover, the ROS level in the normal RAW264.7 cells was slightly decreased by EECP, EEEP and EEBGP. We also know that the accumulation of ROS leads to the damage of DNA, lipids and proteins. More importantly, the constant production of ROS must be modulated by antioxidant systems that allow ROS to perform useful functions while minimizing oxidative damage (Halliwell Citation2011), and EECP, EEEP and EEBGP could improve the modulation process.
Figure 3. ROS elimination effects of EECP, EEEP and EEBGP in RAW264.7 cells. (A) A representative result of the flow cytometry analysis. (B) Each bar represents the inhibition percentage of ROS regulated by EECP, EEEP and EEBGP with the indicated concentrations (μg/mL).
Stimulation effects of EEEP, EEBGP and EECP on the expression of antioxidant genes (HO-1, TrxR1, GCLM and GCLC)
Some reports have revealed that natural products not only eliminated free radicals directly, but also activated the expression of antioxidant genes to exert antioxidant activities (Finley et al. Citation2011). To further study the antioxidant activities of EEEP, EEBGP and EECP, their effects on the expression of antioxidant genes were investigated, and the results are shown in . The results indicated that EEEP had a slight effect on the expression of antioxidant genes; however, EEBGP and EECP significantly activated the expression of HO-1, GCLM and TrxR1, but not GCLC. Moreover, these genes could be activated by EEEP, EEBGP and EECP in a time- and dose-dependent manner () (the data obtained for different EECP concentrations are not shown). HO mediated an adaptive response to oxidative injury, whose main function is inherently associated with the degradation of oxidative heme to biliverdin, free iron and carbon monoxide (Kikuchi et al. Citation2005). As shown in , EEEP gave a slight effect on the expression of HO-1, the expression of HO-1 peaked at 9 h, and EECP stimulated the expression of HO-1 more effectively than EEEP and peaked at 6 h; however, HO-1 was activated by EEBGP more effectively and constantly than EECP. Moreover, HO-1 protects endothelial cells from oxidative injury and reduces the production of pro-inflammatory mediators by endothelial cells (Jeong et al. Citation2006). Additionally, the deficiency of human HO-1 results in severe persistent endothelial damage (Atsuhiro et al. Citation2002).
Figure 4. Antioxidant gene expression (HO-1, GCLM, TrxR1 and GCLC) at the mRNA level regulated by EECP, EEEP and EEBGP. (A–D) RAW264.7 cells incubated with EECP (5 μg/mL), EEEP (3.75 μg/mL) and EEBGP (75 μg/mL) for the indicated hours. (E–H) RAW264.7 cells treated with the indicated concentrations of EECP, EEEP and EEBGP for 6 h. All the genes expressed at mRNA level were determined by qRT-PCR and GAPDH was used as an internal reference gene. *Represents sample group versus control group; #represents sample group versus sample group. All are mean p < 0.05.
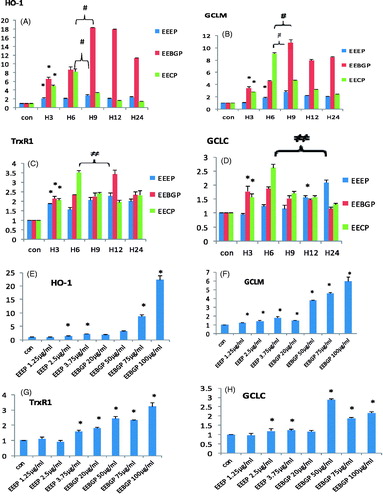
Conversely, TrxR, thioredoxin (Trx) and NADP(H) formed a Trx system, which is involved in regulating numerous oxidative stress-related events (Huang, Xu, et al. Citation2014). In the present study, TrxR1 was slightly activated by EECP, EEEP and EEBGP compared with HO-1 and GCLM (). Moreover, the stimulation effects of EECP on TrxR1 were significantly higher than those of EEEP and similar to those of EEBGP (). TrxR catalysed the regeneration of several antioxidant compounds, including ascorbic acid (vitamin C), selenium-containing substances, lipoic acid, and ubiquinone (Q10) (Nordberg & Arner Citation2001). Additionally, pre-treatment with ambroxol enhanced the capacity of the cells to eliminate ROS, which was largely prevented by the knockdown of cytosolic Trx (Huang, Xu, et al. Citation2014). Interestingly, a previous study noted that TrxR1 activity is decreased despite mRNA up-regulation, which is likely due to the synthesis of aberrant TrxR1 protein without selenocysteine (Fusako et al. Citation2011). According to these results, it might be more functional if propolis were utilized coupled with selenium.
The glutathione (GSH) system is another vital central regulator of cellular redox status, and the rate-limiting enzyme of GSH synthesis is GCL (glutamate–cysteine ligase), which consists of catalytic (GCLC) and modifier (GCLM) subunits, both of which are required for the synthesis of GSH under physiological conditions (Levonen et al. Citation2004). The results in indicate that GCLM was significantly stimulated by EECP, EEEP and EEBGP. The results also showed that the expression effect of EECP on GCLM was significantly higher than that of EEEP and lower than that of EEBGP. Compared with the highest expression of GCLM stimulated by EECP, the highest points of EEEP and EEBGP were shown at 9 h and lagged behind EECP, whereas the expression of GCLC stimulated by EECP, EEEP and EEBGP just gave a slight elevation (). Therefore, EECP, EEEP and EEBGP mainly elevated the level of GSH by regulating GCLM. It may also be that because GCLC is a critical catalytic subunit, a slight change in GCLC may greatly elevate the GSH level. Clinical studies have demonstrated a relationship between low serum GSH levels and coronary artery disease (Morrison et al. Citation1999). Additionally, the intracellular GSH content of macrophages determines the response to the cytotoxic effects of oxidized lipids and other pro-oxidants (Gotoh et al. Citation1993; Bea et al. Citation2003).
Figure 5. Antioxidant gene expression (HO-1, GCLM, TrxR1 and GCLC) at the protein level regulated by EECP, EEEP and EEBGP. RAW264.7 cells treated with EECP, EEEP and EEBGP at the indicated concentrations (A, C) and lengths of time (B, D). The data of antioxidant genes expression effects of EECP were not shown. All the genes expressed at protein level were detected by western blot and β-tubulin was used as an internal reference.
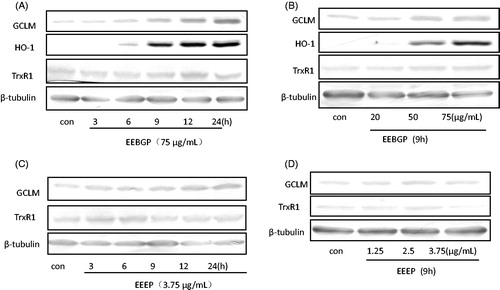
Stimulation effects of EEEP, EEBGP and EECP on the expression of antioxidant genes at the protein level in RAW264.7 cells
We further studied the roles of EECP, EEBGP and EEEP on the antioxidant genes at the protein level. The data are shown in , but the data obtained for EECP are not shown. The results indicated that EEBGP had a more obvious stimulation effect than EEEP on the expressions of HO-1, TrxR1 and GCLM. Moreover, EEEP, EEBGP and EECP had a slight effect on the expression of TrxR1. Because the stimulation effect of EEEP on HO-1 was not obvious, the data are not shown. Compared with EECP, EEBGP had a more significant activation effect on the expression of HO-1 and GCLM, but the highest time-point of EEBGP on the expression of HO-1 and GCLM lagged behind that of EECP. Additionally, EEEP slightly augmented the expression of GCLM, and the highest time point also lagged behind that of EECP. In conclusion, compared with EECP, EEBGP possessed the strongest effects on the expression of HO-1, GCLM and TrxR1, but the activation effects of EEEP were inferior to EECP. The results are in accordance with the effects of EECP, EEBGP and EEEP on the expression of HO-1, GCLM and TrxR1 at the mRNA level.
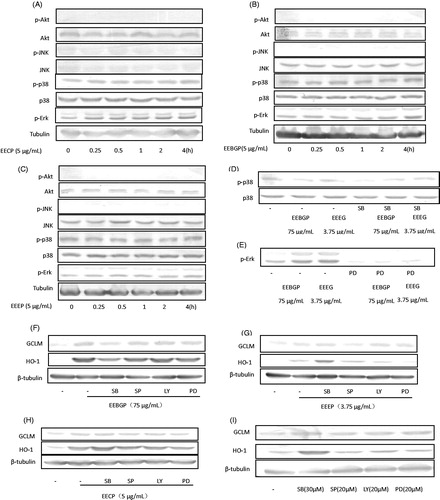
The regulation roles of MAPKs on the expression of HO-1, TrxR1 and GCLM stimulated by EEEP, EEBGP and EECP
A previous study revealed that mitogen-activated protein kinases (MAPKs) may be the potential signalling pathways utilized by green tea polyphenols to activate antioxidant response element(ARE)-dependent genes (Yu et al. Citation1997). In the present study, we studied the roles of MAPKs on the regulation of HO-1, TrxR1 and GCLM stimulated by EECP, EEEP and EEBGP at the protein level, as shown in . The results indicated that p-p38 and p-Erk can be activated by EECP, EEEP and EEBGP, but c-Jun N-terminal kinase (JNK) and AKt cannot (). Some inhibitors (LY294002, inhibitor of Akt/p-Akt; SP600125, inhibitor of JNK/p-JNK; SB203580, inhibitor of p38/p-p38; PD98059, inhibitor of Erk/p-Erk) were utilized to further confirm that MAPKs regulated the expression of HO-1, TrxR1 and GCLM stimulated by EECP, EEBGP and EEEP. The results () showed that the phosphorylation of p38 and Erk were blocked by inhibitors. Because AKt and JNK were not activated by EECP, EEEP and EEBGP, the data of AKt and JNK treated with inhibitors are not shown. After the phosphorylation of Erk was blocked, the expressions of HO-1 and GCLM stimulated by EECP, EEEP and EEBGP were attenuated (). Epigallocatechin gallate induces Nrf2-mediated antioxidant enzyme expression via the activation of PI3K and ERK in human mammary epithelial cells (Na et al. Citation2008); however, chlorogenic acid, which is a dietary polyphenol, protects against acetaminophen-induced liver injury via enhancing the antioxidant prevention system by abrogating the phosphorylation of ERK1/2, JNK, and p38 kinases stimulated by acetaminophen (Ji et al. Citation2013). Interestingly, an inhibitor of p38 stimulated the expression of HO-1 and GCLM. Furthermore, the inhibition of the phosphorylation of p38 could not block the expression of HO-1 and GCLM stimulated by EECP and EEEP (). On the contrary, the expression of HO-1 and GCLM stimulated by EEBGP could be starkly attenuated by the p38 inhibitor () (the TrxR1 data are not shown). Sauchinone suppressed t-butyl hydroperoxide-induced ROS generation by up-regulating HO-1 via the p38 MAPK and Nrf2/ARE pathways in HepG2 cells (Jeong et al. Citation2010), and sanguinarine increased the capacity of the enzymatic antioxidant defense system by activating the p38 MAPK/Nrf2 pathway (Vrba et al. Citation2012). Furthermore, HO-1 expression was decreased by the overexpression of p38α, β, and δ and increased by the overexpression of p38γ (Kietzmann et al. Citation2003). Thus, previous studies proved that antioxidant genes could be activated through p38 MAPK, which is consistent with the current findings for EEBGP. A previous study also noted that SB203580 is a specific inhibitor of the p38α and p38β isoforms and that treatment with SB203580 increased the ARE-reporter activity in HepG2 cells (Keum et al. Citation2006), which is consistent with the results of treatment with SB203580 in the presence or absence of EECP or EEEP (). In conclusion, EEEP and EECP can activate the expression of HO-1, GCLM and TxrR1 via Erk/p-Erk kinase, whereas EEBGP activated Erk/p-Erk and p38/p-p38 kinases to stimulate the expression of the antioxidant gene; however, more experiments need to be done to study which p38 isoforms were activated by EEBGP to stimulate the expression of the antioxidant genes.
Figure 6. The regulation roles of MAPKs. (A–C) The stimulation effects of EEEP, EEBGP and EECP on the expression of MAPKs. (D–E) To determine the inhibition effects of the inhibitors on p38 and Erk, RAW264.7 cells were pre-treated with SB203580 or PD98059 for 0.5 h and then cultured in the presence or absence of EEEP, EEBGP and EECP for 1 h. (F–I) To confirm that the expression of HO-1, GCLM and TrxR1 was regulated by p38/p-p38 kinase or Erk/p-Erk kinase, RAW264.7 cells were pre-treated with SB203580 or PD98059 for 0.5 h and cultured in the presence or absence of EEEP, EEBGP and EECP for 5 h, then the medium was removed, and the cells were cultured with new medium for an additional 4 h. All the genes expressed at protein level were detected by western blot and β-tubulin was used as an internal reference.
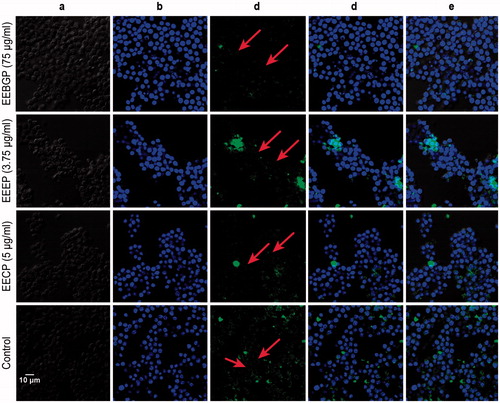
The effects of EEEP, EEBGP and EECP on the nuclear translocation of Nrf2
Nrf2 is a redox-sensitive transcription factor that translocates to the nucleus and binds to AREs located in the promoter regions of relevant genes to induce the transcription of numerous antioxidant and cellular defense genes (Kensler et al. Citation2007). In the present study, we cultured RAW264.7 cells with EECP, EEBGP and EEEP for 4 h, and the translocation effects of Nrf2 were measured by laser scanning confocal microscopy. As shown in , the fluorescence in RAW264.7 cells treated with EEEP, EEBGP and EECP was mainly stained in the nucleus compared with the normal RAW264.7 cells. Under normal conditions, the fluorescence was shown as a ring and was mainly located in the cytoplasm. The study showed that Panax notoginseng saponins stimulated the expression of heme oxygenase-1 (HO-1) and glutathione S-transferase pi 1 via the Nrf2 pathway against cell death induced by H2O2 (Zhou et al. Citation2014). Furthermore, ankaflavin activated Nrf2 to modulate the oxidative stress pathway to improve lung injury and ameliorate the development of airway inflammation (Hsu et al. Citation2012). Therefore, EEEP, EEBGP and EECP could stimulate Nrf2 to translocate into the nucleus to bind to DNA to regulate the expression of HO-1, GCLM and TrxR1. Moreover, numerous studies have confirmed that the activation of p38 and Erk kinases was required to activate Nrf2 in regulating the expression of antioxidant genes (HO-1, TrxR1 and GCLM) (Zipper & Mulcahy Citation2000, Citation2003; Jiang et al. Citation2014). Thus, we inferred that EEBGP regulated the expression of HO-1, TrxR1 and GCLM genes via the p38 and Erk kinases/Nrf2 signal pathways. EEEP activated antioxidant gene (HO-1, GCLM and TrxR1) expression through the Erk kinases/Nrf2 signal pathway, which was similar to EECP.
Figure 7. Nucleus translocation effects of Nrf2 stimulated by EECP, EEBGP and EEEP in RAW264.7 cells. Treatment of RAW264.7 cells were conducted with the indicated concentrations of EECP, EEBGP and EEEP for 4 h and Nrf2 nucleus translocations were assessed by laser scanning confocal microscopy. (A) Morphology of the RAW264.7 cells. (B) DAPI image of the nuclei. (C) Image of Nrf2 in RAW264.7 cells stained with Alexa Fluor 488-conjugated anti-rabbit IgG antibody. (D) Merged image of DAPI and Alexa Fluor 488-conjugated anti-rabbit IgG antibody. (E) Merged image of DAPI and Alexa Fluor 488-conjugated anti-rabbit IgG antibody and the morphology of RAW264.7 cells to clearly show the location of Nrf2.
Conclusion
The study implied that the composition of EEEP was similar to EECP to some extent and that EEBGP was significantly different from EECP. The results indicated that EEBGP exerted stronger effects on the expression of antioxidant genes than did EECP but that EEBGP had lower eliminating ROS effects than did EECP. Additionally, the stimulation effects on the antioxidant genes and the elimination ROS effects of EEEP were inferior to those of EECP and EEBGP. Additionally, the antioxidant molecular mechanism of EEBGP was significantly different from that of EECP and EEEP, but EEEP was similar to EECP. As a result, the antioxidant molecular mechanisms were dependent on the compositions of EEBGP, EEEP and EECP. Moreover, EEBGP, EEEP and EECP may enhance the antioxidant prevention systems to improve the anti-inflammatory ability of RAW264.7 cells. Our studies gave some insights into the relationship between the antioxidant capacities of propolis and disease. We will further study the pharmacological activity of propolis in diabetes animal models based on the antioxidant molecular mechanism of propolis, which we have confirmed in this study.
Funding information
This work was supported by a grant from the National Natural Science Foundation of China (No. 31272512) and the earmarked fund for Modern Agro-industry Technology Research System from the Ministry of Agriculture of China (CARS-45).
Disclosure statement
The authors have declared that there are no conflicts of interest.
References
- Abu MA, Koolaji N, Duke RK, Tran VH, Duke CC. 2012. Prenylated cinnamate and stilbenes from Kangaroo Island propolis and their antioxidant activity. Phytochemistry. 77:251–259.
- Ahn M, Kumazawa S, Usui Y, Nakamura J, Matsuka M, Zhu F, Nakayama T. 2007. Antioxidant activity and constituents of propolis collected in various areas of China. Food Chem. 101:1383–1392.
- Apak R, Gorinstein S, Böhm V, Schaich KM, Özyürek M, Güçlü K. 2013. Methods of measurement and evaluation of natural antioxidant capacity/activity (IUPAC Technical Report). Pure Appl Chem. 85:957–998.
- Athikomkulchai S, Awale S, Ruangrungsi N, Ruchirawat S, Kadota S. 2013. Chemical constituents of Thai propolis. Fitoterapia. 88:96–100.
- Atsuhiro KM, Yoshio OM, Akihiro YM, Shoichi Koizumi M, Isao NM. 2002. Heme oxygenase-1 deficiency: the first autopsy case. Hum Pathol. 33:125–130.
- Bankova V, Christov R, Kujumgiev A, Marcuccic MC, Popov S. 1995. Chemical composition and antibacterial activity of Brazilian propolis. Z Naturforsch C J Biosci. 50:167–172.
- Bea F, Hudson FN, Chait A, Kavanagh TJ, Rosenfeld ME. 2003. Induction of glutathione synthesis in macrophages by oxidized low-density lipoproteins is mediated by consensus antioxidant response elements. Circ Res. 92:386–393.
- Brasnyo P, Molnar GA, Mohas M, Marko L, Laczy B, Cseh J, Wittmann I. 2011. Resveratrol improves insulin sensitivity, reduces oxidative stress and activates the Akt pathway in type 2 diabetic patients. Br J Nutr. 106:383–389.
- Castaldo S, Capasso F. 2002. Propolis, an old remedy used in modern medicine. Fitoterapia. 73:s1–s6.
- Cui-ping Z, Shuai H, Wen-ting W, Shun P, Xiao-ge S, Ya-jing L, Fu-liang H. 2014. Development of high-performance liquid chromatographic for quality and authenticity control of Chinese propolis. J Food Sci. 79:C1315–C1322.
- dos Santos Pereira A, de Miranda Pereira AF, Trugo LC, Neto FRdA. 2003. Distribution of quinic acid serivatives and other phenolic compounds in Brazilian propolis. Z Naturforsch C. 2003:590–593.
- Finley JW, Kong AN, Hintze KJ, Jeffery EH, Ji LL, Lei XG. 2011. Antioxidants in foods: state of the science important to the food industry. J Agric Food Chem. 59:6837–6846.
- Frankel EN, Meyer AS. 2000. The problems of using one-dimensional methods to evaluate multifunctional food and biological antioxidants. J Sci Food Agric. 80:1925–1941.
- Fuliang H, Hepburn HR, Xuan H, Chen M, Daya S, Radloff SE. 2005. Effects of propolis on blood glucose, blood lipid and free radicals in rats with diabetes mellitus. Pharmacol Res. 51:147–152.
- Fusako U, Akio Y, Fujimura M. 2011. Post-transcriptional defects of antioxidant selenoenzymes cause oxidative stress under methylmercury exposure. J Biol Chem. 286:6641–6649.
- Giacco F, Brownlee M. 2010. Oxidative stress and diabetic complications. Circ Res. 107:1058–1070.
- Gotoh N, Graham A, Nikl E, Darley-Usmar VM. 1993. Inhibition of glutathione synthesis increases the toxicity of oxidized low-density lipoprotein to human monocytes and macrophages. Biochem J. 296:151–154.
- Guanglei S, Du Q. 2011. Antioxidant activity comparation of polysaccharides from nine traditional edible fungi in China. Biomed Eng Inform. 4:1196–1200.
- Guo X, Chen B, Luo L, Zhang X, Dai X, Gong S. 2011. Chemical compositions and antioxidant activities of water extracts of Chinese propolis. J Agric Food Chem. 59:12610–12616.
- Halliwell B. 2011. Free radicals and antioxidants – quo vadis? Trends Pharmacol Sci. 32:125–130.
- Hegazi AG, Abd El Hady FK, Abd Allah FA. 2000. Chemical composition and antimicrobial activity of European propolis. Z Naturforsch C J Biosci. 55:70–75.
- Henriksen EJ, Diamond SMK, Marchionne EM. 2011. Oxidative stress and the etiology of insulin resistance and type 2 diabetes. Free Radic Biol Med. 51:993–999.
- Hernandez IM, Fernandes MC, Cuesta-Rubio O, Piccinelli AL, Restrelli L. 2005. Polyprenylated benzophenone derivatives from Cuban propolis. J Nat Prod. 68:931–934.
- Hsu WH, Lee BH, Huang YC, Hsu YW, Pan TM. 2012. Ankaflavin, a novel Nrf-2 activator for attenuating allergic airway inflammation. Free Radic Biol Med. 53:1643–1651.
- Hu F, Hepburn HR, Li Y, Chen M, Radloff SE, Daya S. 2005. Effects of ethanol and water extracts of propolis (bee glue) on acute inflammatory animal models. J Ethnopharmacol. 100:276–283.
- Huang D, Ou B, Prior RL. 2005. The chemistry behind antioxidant capacity assays. J Agric Food Chem. 53:1841–1856.
- Huang J, Xu J, Tian L, Zhong L. 2014. A thioredoxin reductase and/or thioredoxin system-based mechanism for antioxidant effects of ambroxol. Biochimie. 97:92–103.
- Huang S, Zhang CP, Li GQ, Sun YY, Wang K, Hu FL. 2014. Identification of catechol as a new marker for detecting propolis adulteration. Molecules. 19:10208–10217.
- Ishihara M, Naoi K, Hashita M, Itoh Y, Suzui M. 2009. Growth inhibitory activity of ethanol extracts of Chinese and Brazilian propolis in four human colon carcinoma cell lines. Oncol Rep. 22:349–354.
- Jeong GS, Lee DS, Li B, Byun E, Kwon DY, Park H, Kim YC. 2010. Protective effect of sauchinone by upregulating heme oxygenase-1 via the P38 MAPK and Nrf2/ARE pathways in HepG2 cells. Planta Med. 76:41–47.
- Jeong GS, Oh GS, Pae HO, Jeong SO, Kim YC, Shin MK, Chung HT. 2006. Comparative effects of curcuminoids on endothelial heme oxygenase-1 expression: ortho-methoxy groups are essential to enhance heme oxygenase activity and protection. Exp Mol Med. 38:393–400.
- Ji L, Jiang P, Lu B, Sheng Y, Wang X, Wang Z. 2013. Chlorogenic acid, a dietary polyphenol, protects acetaminophen-induced liver injury and its mechanism. J Nutr Biochem. 24:1911–1919.
- Jiang G, Hu Y, Liu L, Cai J, Peng C, Li Q. 2014. Gastrodin protects against MPP sup sup induced oxidative stress by up regulates heme oxygenase-1 expression through p38 MAPK/Nrf2 pathway in human dopaminergic cells. Neurochem Int. 75:79–88.
- Kensler TW, Wakabayashi N, Biswal S. 2007. Cell survival responses to environmental stresses via the Keap1-Nrf2-ARE pathway. Annu Rev Pharmacol Toxicol. 47:89–116.
- Keum YS, Yu S, Chang PP, Yuan X, Kim JH, Xu C, Kong AN. 2006. Mechanism of action of sulforaphane: inhibition of p38 mitogen-activated protein kinase isoforms contributing to the induction of antioxidant response element-mediated heme oxygenase-1 in human hepatoma HepG2 cells. Cancer Res. 66:8804–8813.
- Kietzmann T, Samoylenko A, Immenschuh S. 2003. Transcriptional regulation of heme oxygenase-1 gene expression by MAP kinases of the JNK and p38 pathways in primary cultures of rat hepatocytes. J Biol Chem. 278:17927–17936.
- Kikuchi G, Yoshida T, Noguchi M. 2005. Heme oxygenase and heme degradation. Biochem Biophys Res Commun. 338:558–567.
- Levonen AL, Landar A, Ramachandran A, Erin KC, Dale AD, Giuseppe Z, Darley-usmar VM. 2004. Cellular mechanisms of redox cell signalling: role of cysteine modification in controlling antioxidant defences in response to electrophilic lipid oxidation products. Biochem J. 378:373–382.
- Miguel MG, Nunes S, Dandlen SA, Cavaco AM, Antunes MD. 2010. Phenols and antioxidant activity of hydro-alcoholic extracts of propolis from Algarve, South of Portugal. Food Chem Toxicol. 48:3418–3423.
- Morrison JA, Jacobsen DW, Sprecher DL, Killian R, Philip K, Daniels SR. 1999. Serum glutathione in adolescent males predicts parental coronary heart disease. Circulation. 100:2244–2247.
- Murase H, Shimazawa M, Kakino M, Ichihara K, Tsuruma K, Hara H. 2013. The effects of Brazilian green propolis against excessive light-induced cell damage in retina and fibroblast cells. Evid Based Complement Alternat Med. 2013:238279.
- Na HK, Kim EH, Jung JH, Lee HH, Hyun JW, Surh YJ. 2008. Epigallocatechin gallate induces Nrf2-mediated antioxidant enzyme expression via activation of PI3K and ERK in human mammary epithelial cells. Arch Biochem Biophys. 476:171–177.
- Nakajima Y, Shimazawa M, Mishima S, Hara H. 2007. Water extract of propolis and its main constituents, caffeoylquinic acid derivatives, exert neuroprotective effects via antioxidant actions. Life Sci. 80:370–377.
- Nordberg J, Arner ES. 2001. Reactive oxygen species, antioxidants, and the mammalian thioredoxin system. Free Radic Biol Med. 31:1287–1312.
- Paulino N, Barbosa A, Paulino A, Marcucci M. 2014. Hepatoprotective effect of green propolis is related with antioxidant action in vivo and in vitro. Oxid Antioxid Med Sci. 3:43–50.
- Petrova A, Popova M, Kuzmanova C, Tsvetkova I, Naydenski H, Muli E, Bankova V. 2010. New biologically active compounds from Kenyan propolis. Fitoterapia. 81:509–514.
- Popova MP, Graikou K, Chinou I, Bankova VS. 2010. GC-MS profiling of diterpene compounds in Mediterranean propolis from Greece. J Agric Food Chem. 58:3167–176.
- Salzano S, Checconi P, Hanschmann EM, Lillig CH, Bowler LD, Chan P, Ghezzi P. 2014. Linkage of inflammation and oxidative stress via release of glutathionylated peroxiredoxin-2, which acts as a danger signal. Proc Natl Acad Sci USA. 111:12157–12162.
- Shi H, Yang H, Zhang X, Yu LL. 2012. Identification and quantification of phytochemical composition and anti-inflammatory and radical scavenging properties of methanolic extracts of Chinese propolis. J Agric Food Chem. 60:12403–12410.
- Tetsuro K, Misato I, Hirokazu H, Adachi T. 2012. Propolis suppresses CdCl2-induced cytotoxicity of COS7 cells through the prevention of intracellular reactive oxygen species accumulation. Biol Pharm Bull. 35:1126–1131.
- Vrba J, Orolinova E, Ulrichova J. 2012. Induction of heme oxygenase-1 by Macleaya cordata extract and its constituent sanguinarine in RAW264.7 cells. Fitoterapia. 83:329–335.
- Wang K, Ping S, Huang S, Hu L, Xuan H, Zhang C, Hu F. 2013. Molecular mechanisms underlying the in vitro anti-inflammatory effects of a flavonoid-rich ethanol extract from Chinese propolis (poplar type). Evid Based Complement Alternat Med. 2013:127672.
- Wang K, Zhang J, Ping S, Ma Q, Chen X, Xuan H, Hu F. 2014. Anti-inflammatory effects of ethanol extracts of Chinese propolis and buds from poplar (Populus xcanadensis). J Ethnopharmacol. 155:300–311.
- Wang Y, Wang GZ, Rabinovitch PS, Tabas I. 2014. Macrophage mitochondrial oxidative stress promotes atherosclerosis and nuclear factor-kappaB-mediated inflammation in macrophages. Circ Res. 114:421–433.
- Wei JH, Chih HH, Chia LW, Jen KL, Yue WC, Chun LL, Chen CN. 2007. Propolin G, a prenylflavanone, isolated from Taiwanese propolis, induces caspase-dependent apoptosis in brain cancer cells. J Agric Food Chem. 55:7366–7376.
- Yang H, Dong Y, Du H, Shi H, Peng Y, Li X. 2011. Antioxidant compounds from propolis collected in Anhui, China. Molecules. 16:3444–3455.
- Yu R, Jiao JJ, Duh JL, Krishnamurthy G, Tan TH, Kong ANT. 1997. Activation of mitogen-activated protein kinases by green tea polyphenols: potential signaling pathways in the regulation of antioxidant-responsive element-mediated Phase II enzyme gene expression. Carcinogenesis. 18:451–456.
- Zhang CP, Zheng HQ, Liu G, Hu Fl. 2011. Development and validation of HPLC method for determination of salicin in poplar buds: application for screening of counterfeit propolis. Food Chem. 127:345–350.
- Zhou N, Tang Y, Keep RF, Ma X, Xiang J. 2014. Antioxidative effects of Panax notoginseng saponins in brain cells. Phytomedicine. 21:1189–1195.
- Zhu W, Chen M, Shou Q, Li Y, Hu F. 2011. Biological activities of Chinese propolis and Brazilian propolis on streptozotocin-induced type 1 diabetes mellitus in rats. Evid Based Complement Alternat Med. 2011:468529.
- Zhu W, Li YH, Chen ML, Hu FL. 2011. Protective effects of Chinese and Brazilian propolis treatment against hepatorenal lesion in diabetic rats. Hum Exp Toxicol. 30:1246–1255.
- Zipper LM, Mulcahy RT. 2000. Inhibition of ERK and p38 MAP kinases inhibits binding of Nrf2 and induction of GCS genes. Biochem Biophys Res Commun. 278:484–492.
- Zipper LM, Mulcahy RT. 2003. Erk activation is required for Nrf2 nuclear localization during pyrrolidine dithiocarbamate induction of glutamate cysteine ligase modulatory gene expression in HepG2 cells. Toxicol Sci. 73:124–134.