
Abstract
Context Gynostemma pentaphyllum (Thunb.) Makino has been used in traditional medicine for the treatment of hyperlipidaemic with a long history.
Objective: The objective of this study was to evaluate the influence of Gynostemma pentaphyllum (GP) and atorvastatin on amino acids from the plasma and liver tissue of hyperlipidaemic rats.
Materials and methods The rats were fed a high-fat diet continuously for 11 weeks for the construction of hyperlipidaemic model. The hyperlipidaemic rats were treated with Gynostemma pentaphyllum (120 mg/kg) and atorvastatin (1.8 mg/kg) for 4 weeks, and the rats were intragastric administration one time every day. Chromatographic separation was performed on a Shim-pack XR-ODSIII C18 analytical column (75 mm × 2.0 mm i.d., 1.6 μm, Shmadazu Corp., Tokyo, Japan). The biomarkers of amino acids were identified by principal component analysis (PCA) and partial least squares discriminant analysis (PLS-DA).
Results After feeding with a high-fat diet, the TC and LDL-C values of the hyperlipidaemic mode rats increased dramatically (p < 0.01). The established method allowed a target analysis of 12 kinds of amino acids. PCA studies showed that the plasma amino acids had not returned to normal after GP treatment, but those had recovered slightly after atorvastatin treatment. GP has almost no impact on the metabolism of amino acids, while atorvastatin can modify the metabolism of amino acids via self-regulatory mechanisms.
Discussion and conclusion UPLC/DAD combined with SCX-SPE can be successfully used for profiling analysis of amino acids. By the comparison of biomarkers following treatment with GP and atorvastatin, the influence of the two drugs on biomarkers is revealed.
Keywords:
Introduction
Hyperlipidaemic is a common metabolic disease that can cause cardiovascular and cerebrovascular complications (Grover et al. Citation2003; Chen Citation2004; Jellinger et al. Citation2012), which are significant public health problems and major causes of death in developed and developing countries (Murray & Lopez Citation1997; Choudhary et al. Citation2005). Amino acids, being the basic units of proteins, are cell-signalling molecules that regulate gene expression (Sharer Citation2014; Zhang et al. Citation2014), and are precursors for a number of different biological molecules. Amino acid equilibrium is closely related to its metabolism, and the analysis of amino acids is an effective diagnostic approach and many of these conditions are amenable to treatment (Paik et al. Citation2008). Accordingly, the development of a method for the accurate and rapid profiling analysis of amino acids is of great clinical significance.
Gynostemma pentaphyllum (Thunb.) Makino (GP) is a perennial creeping plant belonging to the family Cucurbitaceae. The main chemical composition of Gynostemma pentaphyllum is polysaccharides and saponins (Liang & Sun Citation2002; Kao et al. Citation2008; Yang et al. Citation2008; Li et al. Citation2012). GP acts as an immune system regulator and is able to reduce lipid levels and cholesterol in vivo (Cour et al. Citation1995; Huyen et al. Citation2012; Qin et al. Citation2012), but there is little information about its mechanism of action. GP affects lipid metabolism, and it exerts its antihyperlipidaemic effect by increasing the level of phosphatidylcholine (Wang et al. Citation2013). Atorvastatin belongs to the statin family and it is a HMG-CoA reductase inhibitor, which reduces the synthesis of cholesterol (Naoumova et al. Citation1997; Kang et al. Citation2007), and it has been used as a positive control drug. However, there is no information whether its regulation of amino acids in the body is effective.
Profiling analysis is a form of quantitative analysis aimed at a few preselected metabolites, and is one of a number of metabonomic research strategies (Nobeli et al. Citation2003; Nicholson & Lindon Citation2008). It reflects the different metabolic states of the body, and identifies specific biomarkers to describe and distinguish different states of biological systems. UPLC/DAD is a method with a short analysis time, a large peak capacity, with a high detection sensitivity and high resolution. Amino acid derivatives can be detected with a very high sensitivity and efficiently separated by UPLC/DAD.
Based on UPLC/DAD technology, this study focused on producing a profiling analysis of amino acids from plasma and liver of hyperlipidaemic rats to find biomarkers of amino acids associated with hyperlipidaemic. By means of a comparative study of GP and atorvastatin, the different targets of the two drugs were revealed, and the therapeutic mechanisms of action of the two drugs were clarified.
Materials and methods
Chemicals and reagents
Acetonitrile and methanol were obtained from Fisher Scientific Co., Ltd. (Corning, NY). Glacial acetic acid, triethylamine, sodium acetate anhydrous, acetic acid and ammonia were obtained from Concord Co., Ltd. (Tianjin, China). Phenyl isothiocyanate was obtained from Bellancom Life-Science Co., Ltd. (San Francisco, CA) while α-aminobutyric acid (Lot: BCBB2521V), used as an internal standard (IS), was obtained from Sigma-Aldrich (St. Louis, MO). Standard samples of amino acids (Lot no. 140624-200805) were supplied by the National Institute for the Control of Pharmaceutical and Biological Products (Beijing, China). Standard samples of glutamic acid, serine, glycine, arginine, tyrosine, valine, methionine, isoleucine, leucine, phenylalanine, tryptophan and lysine were dissolved in 0.1 mol/L HCl solution to obtain 0.24, 0.24, 2.0, 1.8, 5.9, 3.0, 1.3, 2.0, 3.0, 2.0, 3.0 and 2.0 mg/mL, respectively, of mixed standard stock solution. Internal standard solution (20.6 μg/mL) was obtained by dissolving α-aminobutyric acid in 0.1 mol/L HCl which was then stored at 4 °C.
Animal experiments
Ethics statement
The protocols used in this study were all approved by the Medical Ethics Committee of Shenyang Pharmaceutical University (protocol number: SYPU-IACUC-C2015-0074). All the procedures were performed in accordance with the Regulations governing Affairs Concerning Experimental Animals and were approved by the State Council of the People’s Republic of China.
Animal care and maintenance
Male rats (SD) were fed under standard laboratory conditions with food and water available in the Experimental Animal Center of Shenyang Pharmaceutical University (China) (Wang et al. Citation2013).
Construction of the hyperlipidaemic model
Forty rats were randomly divided into four groups: a control group, a hyperlipidaemic group, a GP-treated group and an atorvastatin-treated group (n = 10 rats/group). All groups were fed a high-fat diet continuously for 11 weeks, except for the control group. Blood samples (each 1.5 mL) were collected by retro-orbital bleeding from the rats each week. The blood samples were centrifuged and then the supernatant was sent to a local hospital for determination of total cholesterol (TC), triglycerides (TG), high-density lipoprotein (HDL-C) and low-density lipoprotein (LDL-C) to validate the model (Wang et al. Citation2013).
Drug treatment
Four groups were fed a normal diet when the hyperlipidaemic model was established. The rats in GP-treated group were given GP (Guangzhou Baiyunshan Heji Huangpu Traditional Chinese Medicine Co., Ltd., batch number D1D001) at a dose of 120 mg/kg/d for 4 weeks while the rats in the atorvastatin-treated group were given atorvastatin calcium tablets (Pfizer Pharmaceuticals Limited, Mumbai, India, batch number 018312k) at a dose of 1.8 mg/kg/d also for 4 weeks. The rats were intragastric administration one time every day. The animals in the control and hyperlipidaemic groups received the same volume of saline as the drug-treated groups, and all administrations were performed by oral gavage (Wang et al. Citation2013).
Sample collection for UPLC/DAD analysis
Plasma collection
Samples of blood (2 mL) were collected in tubes containing heparin via retro-orbital bleeding from each rat before model construction (week 0), after model construction (week 11), and after drug treatment (week 15). Each collected blood sample was immediately centrifuged at 4000 × g for 10 min and the plasma was transferred to a tube and all plasma samples were stored at −80 °C until analysis.
Liver collection
All rats were put to death by ether asphyxiation at the end of administration and dissected to obtain their livers. Samples of liver tissues (5 g) were weighed accurately and mixed with 6 mL normal saline to prepare liver homogenates using a homogenizer. The homogenates were then transferred to tubes and stored at −80 °C until analysis.
UPLC analysis
Chromatography
A SHIMADZU LC-30A system equipped with a binary pump, an SPD-M20A DAD detector, an automatic injector and LC-Solution software (Shmadazu Corp., Tokyo, Japan) was used. Chromatographic separation was performed on a Shim-pack XR-ODSIII C18 analytical column (75 mm × 2.0 mm i.d., 1.6 μm, Shmadazu Corp., Tokyo, Japan), the temperature of which was maintained at 35 °C during the analysis. Samples of 5 μl were injected followed by elution with a combination of 30 mmol/L sodium acetate aqueous solution–acetonitrile (97:3, v/v) (A) at pH = 6.5 adjusted with glacial acetic acid and acetonitrile–water (80:20, v/v) (B).
The elution followed a gradient at a constant flow rate of 0.3 mL/min. For the separation of samples, the gradient elution of mobile phase was set as 0–20% (B) for 0–4 min, 20–30% (B) for 4–8 min, 30–60% (B) for 8–10 min, 60–100% (B) for 10–10.01 min, and 100–100% (B) for 10.01–13 min. Detection was carried out at a wavelength of 200–400 nm.
Pretreatment of plasma/liver homogenate for UPLC analysis
About 100 μL acetic acid (0.1 mol/L, pH = 2.8) and 20 μL internal standard solution were added to 100 μL plasma/20 μL liver homogenate, and the mixed solution was vortexed for 30 s. The cation exchange of the solid phase extraction column (SPE-SCX, 100 mg/mL, Simon Aldrich Company, Deutschland, Germany) was activated by 2 mL methanol (Tang et al. Citation2013) and then 2 mL acetic acid(0.1 mol/L), and the entire sample was then loaded onto the SCX-SPE cartridge and drawn through by gravity. After washing the column with 2 mL acetic acid (0.1 mol/L) and then 2 mL methanol, the column was finally eluted with methanol containing 5% ammonia. The collected eluent was dried under nitrogen, then, 100 μL of the initial mobile phase was added to the residue, followed by 100 μL triethylamine (14%, diluted with acetonitrile) and 100 μL phenyl isothiocyanate (0.1 mol/L, diluted with acetonitrile). After vortexing, the mixed solution was allowed to stand at room temperature for 1 h. Then, 400 μL hexane was added, and the solution was vortexed for 1 min. After being allowed to stand for 10 min, the lower layer of the solution was subjected to UPLC/DAD analysis.
Validation of the assay method
In order to monitor the reproducibility and stability of the analysis platforms, including sample preparation and instrument performance, aliquots of all plasma/liver homogenate samples were mixed together to prepare a pool of quality control (QC) samples.
Linearity and range
Series standard solutions of amino acid (100 μL) was mixed with 20 μL IS was used to perform UPLC/DAD analysis, and the values of the peak areas of the amino acids divided by that of the IS were recorded as AX/Ai. The concentrations of standard amino acid solution were used as the X-axis and the values of AX/Ai were used as the Y-axis for the linear regression analysis.
Precision and accuracy
Plasma QC samples (100 μL) were spiked with 100 μL low, medium and high concentrations of mixed standard solution of amino acid, and then processed as described in the section “Linearity and range”. Each concentration of sample was prepared for five parallel replications. The accuracy and the intra-day precision were presented as the relative recovery and RSD%; the inter-day precision was presented as the RSD% over 3 successive days (n = 3). Liver QC samples (20 μL) were processed in the same way as plasma.
Stability
The post-preparative stability (RE%) of samples was tested by analyzing six prepared QC samples kept in a refrigerator (maintained at 4 °C) for 24 h, compared with freshly prepared QC samples (n = 6). The room temperature stability (RE%) of QC samples was determined by keeping six freshly prepared QC samples (n = 6) at room temperature for 4 h. The stability following the freeze-thawing process (RE%) was evaluated by analyzing QC samples that underwent 3 freeze/thaw cycles compared with freshly thawed QC samples (n = 6).
Recovery
Solid phase extraction was used or the isolation of amino acids from rat plasma and liver. The extraction recovery was calculated from the ratios of samples before and after extraction.
Data analysis
All the collected samples were analyzed with the validated method, and all the UPLC/DAD data were imported into Microsoft Excel for labelling, and then imported into SIMCA–P11.5 (Umetrics, Umea, Sweden) for principal component analysis. Each peak area was normalized using IS before multivariate data analysis.
The data matrix was constructed using the UPLC/DAD responses of each peak as variables. Principal component analysis (PCA) was initially employed to obtain an overview of amino acids from the controls and models and to evaluate the analytical performance (Wang et al. Citation2005; Sonkar et al. Citation2012). Prior to the analyses, the values of all of the variables were centred and scaled. In order to specify hyperlipidaemic-related metabolic variations, partial least squares-discriminant analysis (PLS-DA) was conducted for the control and model groups. Data were visualized using principal component scores plots and loadings plots. Each dot on the scores plot represented a sample, and each dot on the loadings plot represented a peak observed in the corresponding chromatogram (Barker & Rayens Citation2003). The Variable Importance in the Projection (VIP) value was used to evaluate the variable contribution and identify potential biomarkers.
Results
Hyperlipidaemic model biochemical parameters
There was no significant difference in any of the biochemical parameters in the normal group. After 11 weeks of feeding with a high-fat diet, the TC and LDL-C values of the other three groups increased dramatically (p < 0.01) compared with those before modelling, which indicated the success of the model construct. After administration of GP and atorvastatin for 4 weeks, the values of TC and LDL-C in the medicated groups were significantly reduced (p < 0.01) (Wang et al. Citation2013).
Metabonomic profiling by UPLC
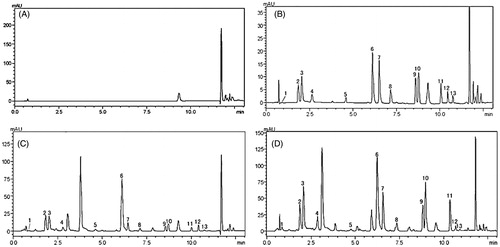
Twelve compounds were identified in the profiling analysis using the UPLC/DAD chromatographic method ().
Figure 1. Representative UPLC/DAD chromatograms. (A) Blank solvent, (B) 12 amino acid derivatives of standard solution, (C) amino acid derivatives in a representative plasma sample, (D) amino acid derivatives in a representative liver homogenate sample. (1) Glutamic acid; (2) serine; (3) glycine; (4) arginine; (5) is; (6) tyrosine; (7) valine; (8) methionine; (9) isoleucine; (10) leucine; (11) phenylalanine; (12) tryptophan; (13) lysine.
Assay validation
Standard curve
The standard curve and the linear range of the plasma and liver samples are listed in and , respectively. The correlation coefficients were all equal to or greater than 0.99, and the results showed that the linear range could be used for the analysis of amino acids in plasma and liver.
Table 1. Calibration curves of 12 amino acids derivatives for plasma.
Table 2. Calibration curves of 12 amino acids derivatives for liver.
Precision and accuracy
The precision and accuracy results of amino acid of plasma samples are shown in Table S1 (Appendix A), and those of liver samples are shown in Table S2 (Appendix B). The intra-day precision was 3.2–15.2% and 3.4–14.2% in plasma and liver, respectively, and the inter-day precision was 4.0–16.7% and 4.4–15.7% in plasma and liver, respectively. All the results obtained indicated that the method had good repeatability and stability.
Stability
The post-preparative stability of plasma and liver was −4.1 to 10.4% and −7.9 to 4.6%, and the room temperature stability of plasma and liver was −6.2 to 7.8% and −5.4 to 8.1%, respectively. The stability of freeze-thawing was −1.0 to 15.9% and −0.4 to 13% for plasma and liver, respectively. The results showed that the established analysis method conformed to the analysis requirements of biological samples. Specific experimental data are shown in Table S3 (Appendix C).
Recovery
The recovery of amino acids from plasma was 83.1.6 ± 2.1%–89.8 ± 2.5%, and that from liver was 79.4 ± 3.0%–85.6 ± 2.6%. Results were all within acceptable levels and tolerances.
PCA study
Multivariate analysis of potential amino acid biomarkers
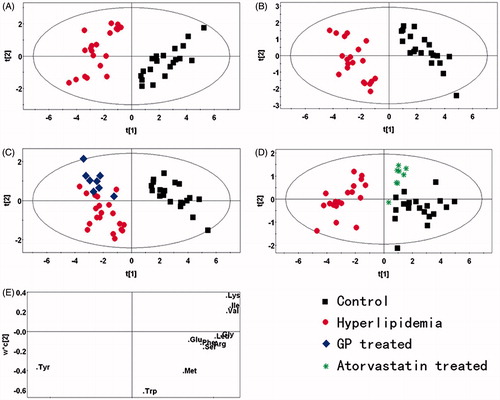
Pattern recognition analysis was conducted using PCA and PLS-DA. The PCA analysis of the UPLC/DAD spectra of plasma from rats in the control and model groups is shown in . The samples of the two groups were well separated. A supervised learning method was used to remove non-essential factors to improve the accuracy of the classification. PLS-DA was applied to discriminate between the normal and model groups (). The results of the control, model and GP/atorvastatin treatment groups are shown in ). The control and model groups could be clearly discriminated due to the marked differences in their metabolite profiles. The GP-treated group was distributed around the model group, suggesting that the metabolite profiles of the hyperlipidaemic rats had not recovered and the plasma amino acids had not returned to normal after GP treatment. The atorvastatin-treated group was distributed around control groups, suggesting that the metabolite profiles of the hyperlipidaemic rats had been restored to normal after atorvastatin treatment. The loading plot is shown in .
Figure 2. PR analysis of the UPLC/DAD spectra of rat plasma. (A) PCA analysis of the spectra of plasma from normal and model rats (R2X = 0.752, Q2 = 0.574). (B) Scores plot of the PLS-DA analysis of the spectra from the plasma of normal and hyperlipidaemic rats (R2X = 0.749, R2Y = 0.939, Q2 = 0.92). (C) Scores plot of the PLS-DA analysis of the spectra from the plasma of normal, hyperlipidaemic and GP-treated rats (R2X = 0.776, R2Y = 0.822, Q2 = 0.738). (D) Scores plot of the PLS-DA analysis of the spectra from the plasma of normal, hyperlipidaemic and atorvastatin-treated rats (R2X = 0.777, R2Y = 0.758, Q2 = 0.668). (E) Loading plot of the PLS-DA analysis of the spectra from the plasma of normal and hyperlipidaemic rats (box: control group; dot: model group; diamond: GP-treated group; star: atorvastatin-treated group).
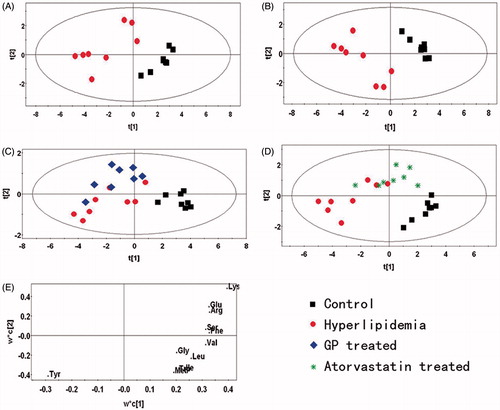
The PCA and PLS-DA of the UPLC/DAD spectra from rat livers in the control and model groups are shown in , respectively. The PLS-DA results from the normal, model and GP-treated groups are shown in , and the results of the normal, model and atorvastatin-treated groups are shown in . The control and model groups were clearly separated. The GP-treated group was distributed around the model group, indicating that the metabolite profiles of the hyperlipidaemic rats had not recovered and the plasma amino acids had not been restored to normal after GP treatment. The atorvastatin-treated group was distributed among the control and model groups, suggesting that the metabolite profiles of the hyperlipidaemic rats had recovered slightly after atorvastatin treatment. The loading plot is shown in .
Figure 3. PR analysis of the UPLC/DAD spectra of rat liver. (A) PCA analysis of the spectra of liver from normal and model rats (R2X = 0.907, Q2 = 0.555). (B) Scores plot of the PLS-DA analysis of the spectra from the liver of normal and hyperlipidaemic rats (R2X = 0.777, R2Y = 0.934, Q2 = 0.902). (C) Scores plot of the PLS-DA analysis of the spectra from the liver of normal, hyperlipidaemic and GP-treated rats (R2X = 0.828, R2Y = 0.811, Q2 = 0.581). (D) Scores plot of the PLS-DA analysis of the spectra from the liver of normal, hyperlipidaemic and atorvastatin-treated rats (R2X = 0.755, R2Y = 0.773, Q2 = 0.569). (E) Loading plot of the PLS-DA analysis of the spectra from the liver of normal and hyperlipidaemic rats. (box: control group; dot: model group; diamond: GP-treated group; star: atorvastatin-treated group).
Potential biomarkers were selected according to the VIP values from the pattern recognition model. These variables representing amino acids were far from the origin in the loading plot, which indicated their greater contribution to the classification. The significance of variations between groups in the data regarding biological parameters was determined by the paired-sample t-test, using SPSS19.0 (IBM, New York, NY). p values less than 0.05 were considered to be statistically significant. Points with VIP values greater than 1.0 and with p values less than 0.05 were regarded as final biomarkers.
Quantitative amino acid metabolic profiles
Quantitative alterations of amino acids in plasma
Compared with the control group, the levels of tyrosine increased in the model group, while glycine, valine, isoleucine, leucine and lysine levels decreased. Tyrosine and glycine tended to recover in the GP-treated group compared with the model group, and tyrosine, glycine, valine and lysine tended to recover in the atorvastatin-treated group compared with the model group. The variation between biomarkers in the model group and the GP/atorvastatin-treated groups is shown in .
Table 3. Quantitative analysis of amino acids of plasma in four groups of rats (x ± s, μg/mL).
Quantitative alterations of amino acids in liver
Compared with the control group, the levels of tyrosine increased in the model group, while glutamic acid, arginine, valine, phenylalanine and lysine levels decreased. None of amino acids exhibited a significant alteration in the GP-treated group compared with the model group, and arginine, valine, and phenylalanine exhibited different levels of recovery in the atorvastatin-treated group compared with the model group. The variation between biomarkers in the model group and the GP/atorvastatin-treated groups is shown in .
Table 4. Quantitative analysis of amino acids of liver in four groups of rats (x ± s, μg/mL).
Discussion
Biological significance of the analysis of amino acids with regard to hyperlipidaemic
Hyperlipidaemic is related to the metabolism of lipids, glucose and proteins. Hyperlipidaemic is caused metabolic disorders, so hyperlipidaemic could result from the consumption of protein, which is broken down to amino acids. The oxygenolysis of amino acids is catalyzed by different enzymes and by different pathways. The degradation products of amino acids are involved in the Krebs cycle and are oxidized to carbon dioxide and water in the form of five kinds of products, acetyl-CoA, succinyl-CoA, α-ketoneglutaric acid, fumaric acid and oxaloacetic acid, which are all intermediate products of the Krebs cycle. Protein is broken down to glucogenic amino acids, ketogenic amino acids, or glucogenic and ketogenic amino acids. Glucogenic amino acids are transformed to succinyl-CoA, α-ketoglutaric acid, fumaric acid and oxaloacetic acid, which can finally be metabolized to glucose and glycogen. Ketogenic amino acids are mainly transformed to acetyl-CoA. In our previous study, the level of ketone bodies was higher in hyperlipidaemic rats than that in normal rats (Wang et al. Citation2013). A large amount of ketone bodies were generated from fatty acids as well as ketogenic amino acids.
It was shown that the level of tyrosine increased significantly, while the level of glycine, valine, isoleucine, leucine, lysine, glutamic acid, arginine and phenylalanine decreased significantly in the hyperlipidaemic group compared with the normal group. Hyperlipidaemic causes a reduction in most amino acids in the body and, so, hyperlipidaemic could result in a higher protein catabolism. The balance of amino acids was disordered, which did not help in the repair and regeneration of liver cells. The levels of glucogenic amino acids decreased, including glycine, valine, glutamic acid and arginine. In earlier research, it was shown that the level of glutamine increased in hyperlipidaemic rats (Wang et al. Citation2013). The reduction in glucogenic amino acids indicated that large amounts of amino acids underwent oxidative breakdown to produce ammonia. Ammonia and glutamic acids were combined to generate glutamine, resulting in an increase in glutamine concentration. The levels of ketogenic amino acids were reduced, including leucine and lysine. This indicated that ketogenic amino acids were converted to generate ketone bodies or fatty acids, resulting in an accumulation of ketone bodies. The level of tyrosine increased while those of isoleucine and phenylalanine were reduced. The metabolism of tyrosine was associated with phenylalanine, and phenylalanine is needed for the metabolism of tyrosine. The results showed that the level of phenylalanine was reduced while that of tyrosine was increased, indicating that most of the phenylalanine was metabolized to tyrosine.
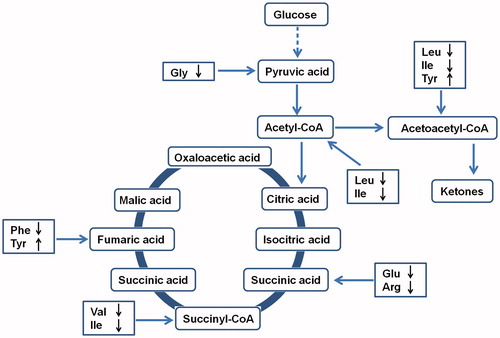
Amino acids have many physiological functions and, thus, affect a variety of physiological reactions in the body. Hyperlipidaemic can lead to metabolic disorders of amino acids, and many physiological reactions are affected by amino acid disorders because of their variety of physiological functions. If the level of one or more amino acids is too low, the normal metabolism of the human body is disrupted, and this might lead the occurrence of various diseases (Han et al. Citation2010). The metabolic network diagram is shown in .
Figure 4. A summary of the related metabolic pathways for amino acids that changed significantly in hyperlipidaemic group. “↑” and “↓” represent the compound is up- and down-regulated compared with the control group.
Mechanism analysis of GP and atorvastatin for the treatment of hyperlipidaemic
Summarizing the serum and liver results, the level of glycine and tyrosine recovered to normal after GP treatment. The levels of glycine, valine, lysine, arginine, tyrosine and phenylalanine exhibited different degrees of recovery after atorvastatin treatment. GP contains a variety of compounds including saponins, polysaccharides, flavonoids, organic acids and trace elements, and it is rich in several kinds of amino acids like aspartic acid, threonine, serine and glutamic acid. The therapy of hyperlipidaemic with GP mainly involves an improvement in lipid metabolism, especially lipoid metabolism, but with little impact on the metabolism of amino acids. The levels of glycine and tyrosine were improved by GP, but these two amino acids are involved in many metabolic pathways in vivo, and these two amino acids are apt to return to normal when the lipids tend to be normal. Atorvastatin can not only inhibit reductase HMG-CoA in liver but can also restore the levels of amino acids to normal through its regulatory mechanism, involving glucogenic amino acids and ketogenic amino acids.
Conclusion
UPLC/DAD combined with SCX-SPE can be successfully used for profiling analysis of amino acids. The balance of the metabolism of amino acids in hyperlipidaemic rats is disturbed, and the ways in which GP and atorvastatin regulate amino acids are different. GP has almost no impact on the metabolism of amino acids, while atorvastatin can modify the metabolism of amino acids via self-regulatory mechanisms. This study provides a scientific basis for the application of profiling analysis in drug mechanism research.
Disclosure statement
The authors declare that they have no conflict of interest.
Funding information
This work was supported by National Natural Science Foundation of China (NSFC: 81503035) and Educational Department of Liaoning Province of China (NSFC: L2014394).
References
- Barker M, Rayens W. 2003. Partial least squares for discrimination. J Chemometr. 17:166–173.
- Chen HZ. 2004. Current status of blood lipid level and treatment of hyperlipoidemia in Chinese population. Chin J Integr Med. 2:81–82.
- Choudhary MI, Naheed S, Jalil S, Alam JM, Atta-ur-Rahman. 2005. Effects of ethanolic extract of Irisgermanica on lipid profile of rats fed on a high-fat diet. Ethnopharmacology. 98:217–220.
- la Cour B, Mølgaard P, Yi Z. 1995. Traditional Chinese medicine in treatment of hyperlipidaemia. J Ethnopharmacol. 46:125–129.
- Grover SA, Dorais M, Coupal L. 2003. Improving the prediction of cardiovascular risk: interaction between LDL and HDL cholesterol. Epidemiology. 14:315–320.
- Han XF, Huang YH, Wang LX. 2010. Classification of diabetes volunteers based on plasma amino acids metabolic profiling. Chin J Anal Chem. 38:697–701.
- Huyen VT, Phan DV, Thang P, Hoa NK, Ostenson CG. 2012. Gynostemma pentaphyllum tea improves insulin sensitivity in type 2 diabetic patients. J Nutr Metab. 2013:765383.
- Jellinger PS, Smith DA, Mehta AE, Ganda O, Handelsman Y, Rodbard HW, Shepherd MD, Seibel JA. 2012. American association of clinical endocrinologists' guidelines for management of dyslipidemia and prevention of atherosclerosis. Endocr Pract. 18:1–78.
- Kang L, Hu SJ, Sun YX. 2007. Effect of atorvastatin on HMG–CoA reductase expression in spontaneously hypertensive rats. Chin J Pathophysiol. 23:44–48.
- Kao TH, Huang SC, Inbaraj BS, Chen BH. 2008. Determination of flavonoids and saponins in Gynostemma pentaphyllum (Thunb.) Makinoby liquid chromatography-mass spectrometry. Anal Chim Acta. 626:200–211.
- Li N, Wu CF, Xu XY, Liu X, Zhao Y-Q. 2012. Triterpenes possessing an unprecedented skeleton isolated from hydrolyzate of total saponins from Gynostemma pentaphyllum. Eur J Med Chem. 50:173–178.
- Liang SX, Sun HW. 2002. Determination of six nutritional elements in Chinese herbal medicines by graphite furnace atomic absorption spectrometry. Spectrosc Spect Anal. 22:847–849.
- Murray CJ, Lopez AD. 1997. Global mortality, disability, and the contribution of risk factors: global burden of disease study. Lancet. 349:1436–1442.
- Naoumova RP, Dunn S, Rallidis L, Abu-Muhana O, Neuwirth C, Rendell NB, Taylor GW, Thompson GR. 1997. Prolonged inhibition of cholesterol synthesis explains the efficacy of atorvastatin. J Lipid Res. 38:1496–1500.
- Nicholson JK, Lindon JC. 2008. Systems biology: metabonomics. Nature. 455:1054–1056.
- Nobeli I, Ponstingl H, Krissinel EB, Thornton JM. 2003. A structure-based anatomy of the E. coli metabolome. J Mol Biol. 334:697–719.
- Paik MJ, Moon SM, Kim KR, Choi S, Ahn YH, Lee G. 2008. Target metabolic profiling analysis of free amino acids in plasma as EOC/TBDMS derivatives by GC-SIM-MS. Biomed Chromatogr. 22:339–342.
- Qin R, Zhang J, Li C, Zhang X, Xiong A, Huang F, Yin Z, Li K, Qin W, Chen M, et al. 2012. Protective effects of gypenosides against fatty liver disease induced by high fat and cholesterol diet and alcohol in rats. Arch Pharm Res. 35:1241–1250.
- Sharer JD. 2014. Amino acid disorders. In: Encyclopedia of the neurological sciences. 2nd ed. New York: Elsevier. p. 136–147.
- Sonkar K, Purusottam RN, Sinha N. 2012. Metabonomic study of host-phage interaction by nuclear magnetic resonance and statistical total correlation spectroscopy-based analysis. Anal Chem. 84:4063–4070.
- Tang XX, Zheng MC, Zhang YY, Fan SJ, Wang C. 2013. Estimation value of plasma amino acid target analysis to the acute radiation injury early triage in the rat model. Metabolomics. 9:853–863.
- Wang C, Kong H, Guan YF, Yang J, Gu J, Yang S, Xu G. 2005. Plasma phospholipid metabolic profiling and biomarkers of type 2 diabetes mellitus based on high performance liquid chromatography/electrospray mass spectrometry and multivariate statistical analysis. Anal Chem. 77:4108–4116.
- Wang M, Wang F, Wang YN, Xiaonan Ma, Min Zhao, Chunjie Zhao. 2013. Metabonomics study of the therapeutic mechanism of Gynostemma pentaphyllum and atorvastatin for hyperlipidemia in rats. PLoS One. 8:e78731.
- Yang X, Zhao Y, Yang Y. 2008. Isolation and characterization of immunostimulatory polysaccharide from an herb tea, Gynostemma pentaphyllum Makino. J Agric Food Chem. 56:6905–6909.
- Zhang YY, Zhou X, Li C, Wu J, Kuo JE, Wang C. 2014. Assessment of early triage for acute radiation injury in rat model based on urinary amino acid target analysis. Mol Biosyst. 10:1441–1449.