Abstract
Objectives. Measuring strain in multiple myocardial layers using 2-dimensional tissue Doppler imaging may provide valuable diagnostic information about non-transmural disease. However, its feasibility in humans has not been demonstrated previously, and optimal machine settings not defined. Design. From parasternal short axis, zoomed tissue Doppler imaging of the left ventricular inferior wall was obtained in 23 young, healthy humans. Images were recorded with six different machine settings. Velocity, strain rate and strain were measured in two and three layers across the wall. Result. For two-layer-measurements, all subendocardial values were significantly higher than the subepicardial ones (p<0.003 for all data sets). Minimal radial and maximal lateral averaging resulted in largest strain differences: 106.4±32.6% (mean±SD) subendocardially versus 54.2±20.1% subepicardially. By similar settings in three layers, strain was 105.7±34.5% subendocardially, 81.2±26.9% midmyocardially and 48.3±26.9% subepicardially (p <0.05). Conclusion. We have demonstrated that it is feasible to measure radial velocity, strain rate and strain in up to three individual layers in young healthy humans, and the diagnostic potentials should be tested on patient groups.
Disease may affect only a portion of the entire myocardial wall thickness. For instance, reduction in coronary flow first manifests as a reduction of function in the subendocardial layer, as is shown experimentally and recognised clinically in subendocardial infarctions. Midmyocardial and subepicardial scarring is a typical magnetic resonance imaging finding in myocarditis (Citation1). Although measurement of radial strain has been claimed to differentiate transmural and non-transmural infarction, even when measured as an average across the whole wall thickness (Citation2), measuring strain separately in multiple myocardial layers could give more direct information about function in layers as shown by a recent experimental study (Citation3). Theoretically, improved ultrasound spatial resolution should allow quantitating function of separate layers within the myocardial wall, and yield more precise, local data, opening for better understanding of the cardiomechanics, and eventually providing better sensitivity for assessing non-transmural diseases.
Tissue Doppler imaging (TDI) provides quantitative data of myocardial deformation, and has become an extensively used research tool, applied to many disease conditions. Little clinical data is available using strain on deformation in layers. Myocardial velocity gradient has been obtained by TDI M-mode technique (Citation4). Two studies showed longitudinal strain in the subendocardial layer only (Citation5,Citation6), and a recent study has shown radial two-layer-measurement in patients with Duchenne muscular dystrophy (Citation7).
The purpose of this preliminary methodologic study was twofold: first, to evaluate the feasibility to measure radial velocity, strain and strain rate for two and three layers in left ventricular inferior wall in healthy young humans, comparing our results with previously published values from animal experiments; and second, to investigate the effect of different radial and spatial averaging during TDI data acquisition.
Material and methods
Patients
Young, healthy, non-obese adults, mainly working at the hospital, were invited to participate. Thirty two agreed and were examined. The subjects had no history of cardiac disease and used no cardiovascular drugs. Unintended tilting of the imaging plane from the level of papillary tips towards the mitral anulus occurred in several recordings, and forced us to reject nine participants. The error was due to the zooming, which hid neighbouring anatomic landmarks and which was kept continuously through the acquisition of a complete set of six recordings without intermittent unzooming. It caused diverging TDI patterns towards the end of the series of six recordings planned for comparison of different averaging settings. Major changes in curve shapes from one averaging setting to the next, unlikely to be caused by change of averaging, were used as exclusion criterion. The remaining 23 healthy persons, 16 men, seven women, 27.5±5.7 years (SD) constitute the study group. The protocol was accepted by the regional ethics committee. Invited candidates gave written informed consent.
Echocardiography
All echocardiographies were performed by one cardiologist. The participants were examined in left recumbent position with a General Electric Vivid 7 Vantage or Dimension echocardiograph (GE Vingmed Ultrasound, Horten, Norway) using a 3.0 MHz matrix transducer. Second harmonic imaging was used for 2-dimensional (2D) B-modal images, and fundamental frequency for TDI. ECG-leads were connected and ECG displayed including impedance-derived respiratory indication. The recordings were stored digitally in the manufacturer’s raw data format on magnet-optical discs. Loops of at least five cardiac cycles were recorded for each occasion.
Introductory, conventional echocardiogram was performed, looking for any pathology. From parasternal long axis 2D image, left ventricular dimensions were measured at the level of the mitral chordae following the American Society of Echocardiography guidelines. Continuous Doppler recording of the outflow of the left ventricule was used for event timing, securing that heart rate deviated maximally 10% between the blood Doppler recordings and TDI.
For the TDI we chose the inferior left ventricular wall in parasternal short axis. This view offers a perpendicular insonation of a free part of the left ventricular wall, independent of the insertion of the interventricular septum, and is well exposed in most individuals. Additionally, it is less disturbed by reverberations than is the near-field of the ultrasound beam. Short rather than long axis was chosen in order to secure precisely inferior sampling, avoiding oblique insonation of neighbouring lateral or septal wall.
From parasternal short axis view at the level of the tips of the papillary muscles, with the ultrasound beam perpendicular to the inferior left ventricular wall, the high resolution zoom function was activated to display a sector of approximately 4*3 cm. (). We checked that the complete thickness of the inferior wall was continuously within the sector, and activated TDI. If TDI colour coding indicated aliasing, the velocity scale was adjusted from the default of 0.16 m/s, to approx. 0.24 m/s. The pulse frequency was 2.4 MHz.The pulse length was 0.64 (μs. The beam width depends upon the degree of beam focusing, the focal point depth, and the number of beams, again dependent upon the 2D sector width. At approximately 11 cm depth with 2–5 cm 2D sector width, as used in this study, the beam width was approximately 3 mm. In the velocity estimation, a range gate (axial size of the sample volume) of 1.0 mm was used. These commercially available software versions use a weighted linear regression of the velocities over the strain length (Citation8). No temporal smoothing was used during the estimation of strain rate and strain from velocities. For curve displaying, the default settings of temporal smoothing [MSOfficel], 30 ms for velocity curves and 40 ms for strain rate curves were kept unchanged.
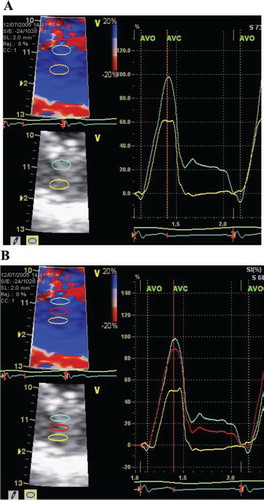
Figure 1. Radial strain in the inferior left ventricular wall.
Panel A: Two-layer-measurement. To the left, zoomed image with region of interest 3*6 mm and strain length 2 mm. To the right, strain curve through one heart cycle, with ECG at the bottom. AVO = aortic valve opening. AVC = aortic valve closure. Panel B: Three-layer-measurement. Region of interest 2*6 mm. Otherwise as for panel A.
For each of the six spatial averaging machine settings () a cineloop was recorded.
Table I. The six different settings of machine averaging during TDI acquisition.
Lateral averaging gives the number of beams involved in the Doppler shift registration. The adjustment choice presented with this software offered five levels of lateral averaging, corresponding approximately to 1–3 beams. In this study the lowest, the middle, and the highest were compared (LAI to LA3).
The radial averaging gives the number of range gates averaged along the beam. The adjustment choice in this case was four levels of averaging, covering one to four range gates, corresponding to approximately 1–3 mm along the beam (RA1 – RA4 in this study). Thus the radial averaging levels in correspond to approximately 1 mm for minimal radial averaging (RA1) and 3 mm (3 range gates) for maximal radial averaging (RA4).
Postprocessing
Off-line measurements were made with EchoPac-PC® (5.0 and 6.0 GE Vingmed Ultrasound, Horten, Norway). In all cases we looked carefully at a curved anatomical M-mode through the area intended for measurement, considering both velocity, strain rate, and strain display to choose a cardiac cycle of optimal quality, avoiding drop-outs and static artifacts, preferring a cycle close to the end-exspirium. Neither the cine compound function nor manual averaging over several cardiac cycles was used.
For two-layer-measurement we set the size of the regions of interest to 3 mm radially and 6 mm laterally, and strain length of 2 mm (). Two regions of interest were positioned evenly in the inferior wall, representing the subendocardial, and subepicardial halves.
For three-layer-measurement we sized the regions of interest to 2 mm radially and 6 mm laterally, kept strain length at 2 mm (), and positioned three regions of interest evenly in the inferior wall, representing the subendocardial, midmyocardial, and subepicardial thirds. Because the data acquisition area with this software extends ½ strain length above and below the region of interest, we kept a free zone between the region of interest and the myocar-dial wall border (endocardium and epicardium, resp.) of minimally ½ strain length, and aimed at avoiding overlap between regions of interest whenever possible (). The same beat was used for two- and three-layer-measurement.
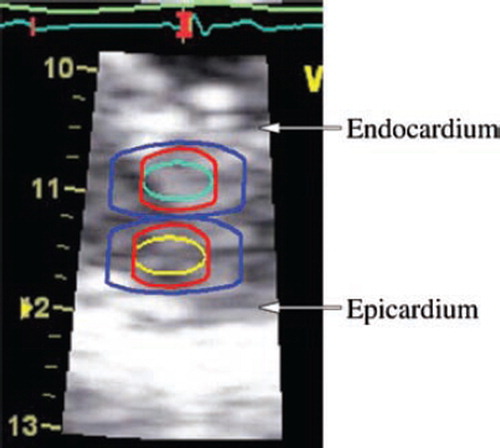
Figure 2. Sampling for two-layer-measurement, demonstrated on an image frozen in end-systole. Cyan and yellow are original regions of interest in the subendocardial and subepicardial halves, 3*6 mm. The red extension indicates the additional sampling of ½ strain length in the axial direction on both sides of the region of interest. In this recording with strain length = 2 mm, 1 mm is added on either side. The blue extension depicts minimum averaging (RA1/LAI in this study) and is an indication of the limitation in image resolution. Resolution is, in the radial direction ½ pulse length ≈ 0.5 mm, and in the lateral direction up to one beam width ≈ 3 mm. The resulting total sampling dimensions are approximately 6*10 mm (blue extension).
Regions of interest were first anchored at the beginning of the QRS complex. To make the regions of interest track the tissue, we positioned additional anchors at the beginning and the end of the E-wave, and before the A-wave. We took particular care with the early systole, often adding extra anchors to optimize tracking and to secure even distribution of the regions of interest across the myocardial wall, as judged from the 2D image. On velocity and strain rate curves, peak value through systole, in early diastole and at the atrial contraction were measured. Occasional higher peaks in the isovolumic phases were disregarded. Strain was measured at peak and at aortic valve closure as defined from continuous Doppler registration of the transaortic blood flow. Integration of strain rate into strain was started at the beginning of the QRS complex. Strain drift was corrected by linear compensation.
Reproducibility
Recordings from ten randomly selected participants were used for reproducibility assessment. From each participant the recording of one randomly selected average setting was postprocessed de novo by one of the authors who had not participated during the primary postprocessing, and who was blinded to the primary choice of cardiac cycle selected for postprocessing. Three- as well as two-layer-postprocessings were performed, with velocity, strain rate and strain. Comparison between first and second postprocessing was done twice, first for all ten participants, and second for those six for whom both readers blindedly had selected the same cardiac cycle for postprocessing.
Statistics
The data were analysed using a commercial statistical package (SigmaStat 3.1, Systat Software, CA, USA). Continuous variables were compared by means of t-test between two groups and by means of one-way analysis of variance between three groups. For reproducibility assessment, the first and second postprocessing results were compared by means of intraclass correlation coefficient. The cases, in which the same beat had by chance been selected for postprocessing, underwent a separate evaluation of reproducibility. Values are given as mean±SD throughout the study. P-values below 0.05 were regarded statistically significant.
Results
Conventional echocardiograms confirmed hearts of normal structure, with normal systolic and diastolic function and absence of valvular disease in all cases. All participants had sinus rhythm, heart rate 63 ±8 beats/min. Left ventricular inferior wall thickness was 0.81±0.17 cm in end-diastole and 1.34±0.19 cm in end-systole, and the distance from the probe to the end-diastolic midwall was 10.7±1.0 cm.
Results of the TDI measurements are shown in and and Figures (). Peak strain, and peak systolic velocity and strain rate were lower in the subepicardial than subendocardial layer (p < 0.003), irrespective of the degree of spatial averaging and for both two- and three-layer-measurements. Peak E wave strain rate was significantly lower subepicardially only in recordings with low radial averaging, and also for the other variables low radial and high lateral averaging tended to improve separation between the layers, though the effect was modest. The zoomed TDI cineloops achieved a frame rate of 280±61 /s.
Table II. Peak systolic velocity and strain rate, and peak strain in two and three myocardial layers. Mean values±SD, n = 23.
Table III. Diastolic velocity and strain rate in two and three myocardial layers. Mean values ±SD, n = 23.
Figure 3. Peak systolic strain rate for two- (panel A) and three- (panel B) layer-measurements.
RA = radial averaging, LA = lateral averaging (4 resp. 3 = maximum, 1 = minimum). Mean±SD. “a” denotes significant difference (p < 0.05) from subendocardial value. “b” denotes significant difference (p < 0.05) from midmyocardial value.
Figure 4. Peak strain for two- (panel A) and three- (panel B) layer-measurements.
RA = radial averaging, LA = lateral averaging (4 resp. 3 = maximum, 1 = minimum). Mean±SD. “a” denotes significant difference (p < 0.05) from subendocardial value. “b” denotes significant difference (p < 0.05) from midmyocardial value.
Figure 5. Peak E wave strain rate for two- (panel A) and three- (panel B) layer-measurements.
RA = radial averaging, LA = lateral averaging (4 resp. 3 = maximum, 1 = minimum). Mean±SD. “a” denotes significant difference (p < 0.05) from subendocardial value. “b” denotes significant difference (p < 0.05) from midmyocardial value.
Recording these six cineloops required maximally 5 minutes. Postprocessing of a complete set of six recordings for both two and three layers, including entering of velocity, strain rate and strain results required 3 hours per participant.
Peak systolic strain from two-layer-measurement was subendocardially 95.7±29.7%; 94.7±36.6; 95.2±29.5; 94.5±29.3; 96.4±29.9; and 95.1±32.7 for the six averagings, resp. Peak systolic subepicardial strain was 52.9± 18.0; 50.3±21.6; 53.5± 18.7; 47.7±20.4; 53.7±29.1; and 46.3± 19.9, resp. (compare with peak strain in lower left part of ). Neither velocity, strain rate, nor strain differed between the three levels of lateral averaging.
Postsystolic thickening occurred in approximately 60% of the recordings, with strain differences up to 58% (mean 12%) between strain at time of aortic valve closure and at peak. The postsystolic shortening did not differ between the layers, nor between two-and three-layer-postprocessings.
The interobserver agreement for velocity was good (intraclass correlation coefficient = 0.89±0.06 for peak S and E from three-layer-measurements, and 0.80±0.24 peak S and E from two-layer-measurements). For strain rate, it was fair (intraclass correlation coefficient = 0.57±0.20 for three-layer-measurements, 0.74±0.11 for two-layer-measurements). Peak strain had better interobserver agreement subepicardially (intraclass correlation coefficient = 0.78 for three-layer-measurements and 0.93 for two-layer-measurements) than subendo-cardially (intraclass correlation coefficient = 0.33 for three-layer-measurements and 0.53 for two-layer-measurements). Separate analysis within the six cases for whom the same cardiac cycle had by chance been selected twice, yielded similar reproducibility as for all ten.
Discussion
Main findings
This study shows that it is possible to obtain radial tissue velocity, strain rate, and strain values from two and three separate layers of the human left ventricular myocardial wall, using TDI with high resolution zoom, small strain length and small region of interest.
The degree of spatial averaging was on this scanner not critical for two-layer-measurements. For three-layer-measurements the averaging settings did influence the separation of strain rate and strain values of individual layers. With minimal radial and maximal lateral averaging the strain rate and strain values were significantly different between the three layers.
Comparison with other works
Systolic radial wall thickening has, based on geometric deformation models, been calculated to be approximately three times as large subendocardially as subepicardially (Citation9). Thus, our finding of peak strain around 100% subendocardially and 50% subepicardially is in agreement with geometric requirements.
To our knowledge this work is the first to use 2D TDI to quantitate radial strain in multiple layers in humans, as previous articles give no strain values. Both longitudinal and radial strain in multiple layers of the myocardial wall has previously been studied in detail in animals by use of radioopaque beads (Citation10). In most of these studies, strain has been found to increase from subepicardium towards subendocardium [Citation6,Citation11–13], as in our study, but also strain being highest in the midmyocardial layer has been reported (Citation14). Nevertheless, we interpret the strain differences found in our work as a valid representation of a real difference, in accordance with the majority of previous animal publications.
Several echocardiographic methods have been proposed for measurement of deformation in different layers of the myocardial wall, including TDI methods based on colour M-mode (Citation13,14), colour 2D (Citation3), and pixel tracking (Citation15,16). To our knowledge, no study comparing these methods has been published.
Peak systolic radial strain of 61.4% has previously been reported from 214 healthy adult volunteers, by use of a scanner identical to ours, but postprocessed with a large region of interest that averaged the strain across most of the myocardial wall (Citation17).
In our present work, the averaged end-systolic strain from the two-layer-measurements (95.1 and 46.3%) was 70.7%, and the wall thickness increase on the B-modal image 65%.
In contrast, strain measured by magnetic resonance imaging is lower (Citation18), radially often around 50%. For all magnetic resonance imaging studies, the frame rate is lower than for TDI studies.
Our strain values are high relative to the values from studies in anaesthized animals, probably due to most anaesthetics being negatively inotropic (Citation19). In TDI articles, the region of interest size and strain length are rarely specified, in spite of their importance, particularly for multilayer strain measurements. Incomplete information makes adequate comparison between studies difficult.
Protocol details
Zooming in the width of the 2D image improves temporal resolution. In this study the frame rate was well above the recommended minimum for TDI studies (Citation20,Citation21).
In depths typically used for transcutaneous applications, spatial resolution is – in spite of zooming – approximately twice as good along as across the beam, which we exploited by sampling from the inferior wall in parasternal short axis view.
The choice of strain length as small as 2 mm made the strain rate signal noisy, but was necessary to minimise overlap of the areas from which the velocity data were taken for strain calculation (see ). In the thinnest walls some overlap between the regions of interest for three-layer-measurements still was inevitable. The large difference between the deformation in the different myocardial layers suggests that separation between the layers was achieved. To the contrary, with the low reproducibility for endocardial strain rate and peak strain values during three-layer-measurement, these endocardial measurements seem to be less useful with the current settings. As blood and pericardium will have Doppler shifts very different from any myocardial tissue, we gave priority to avoiding inclusion of either of those extramyocardial tissues in the data acquisition areas, over avoiding overlap between adjacent data acquisition areas. We also tried to avoid including trabeculae, which can disturb TDI calculations (Citation22).
Our midmyocardial strain values are closer to the subendocardial ones, i.e. greater than the average of subendocardial and subepicardial values, suggesting a nonlinear strain gradient across the myocardial wall. Similar findings are shown in an animal study (Citation19), while another animal study shows a more linear strain profile through the myocardial wall (Citation12). This difference has been suggested to be caused by the opening of the pericardium (Citation14), but the matter remains under debate. The strain changes steeply through the wall, so that even small malpositionings of the region of interest may erroneously bring the strain value closer to that of an adjacent layer.
Peak rather than aortic valve closure time was chosen as primary strain variable because a number of normal segments exhibit some degree of postsystolic active function. This has been shown in both animal studies as postsystolic thickening in short axis, and in humans as postsystolic shortening in long axis (Citation23). Our present findings unite nicely with those previous results, and our finding of peak systolic strain 10–14% below peak strain, with an unchanged ratio between subendocardial and subepicardial values, was as expected.
Influence of spatial averaging
Assuming a real strain difference between the layers of the myocardial wall, we have regarded the statistical significance of such differences as an indication of appropriateness of the six averaging settings. By this assessment, there is little effect of changing the averaging setting, merely a trend towards better separation during three-layer-measurements.
Altogether, the area on which the deformation calculations are based, is larger than indicated on the screen (). On the other hand, increasing the radial averaging manually, adds relatively little to the indicated area. This corresponds to the lack of influence from these adjustments, as found in our study.
Increasing lateral averaging might introduce an angle error, which would falsely reduce results, particularly the strain rate and strain estimates. As no significant reduction occurred in any variable from lowest to highest lateral averaging, our described protocol seems to avoid this source of error. Still, high lateral averaging may pose a problem in very small ventricles.
Reproducibility
Noise in the strain rate estimation is a well known problem in TDI, and the lower intraclass correlation coefficient for strain rate than for velocity was thus expected. The peak strain in subendocardial layers, however, had lower intraclass correlation coefficient than expected. A possible explanation is that the endocardial border can have been misinterpreted on the 2D image, and some trabeculae included in the area on which the estimation is based. As shown on , that area is larger than the region of interest indicated on the screen. Thus, influence from trabeculae and the blood between them may have occurred, even if the region of interest per se has been kept within the solid myocardium. The endocardial border is less clear on a 2D image than the pericardial one, and consequently the two readers may have positioned the subendocardial regions of interest more differently than the subepicardial ones. The epicardial echo is strong, and known to disturb TDI analysis. From our reproducibility results, however, attention should also be given to the endocardial border.
The fact that variation did not differ between all re-read cases and cases re-read on the same heart beat, suggests that the positioning of the region of interest means more than the selction of heart beat to the TDI outcome.
Wall thickness
Our participants had no left ventricular hypertrophy. The possibilities and limitations for multiple layer measurements shown in this study apply to a minimum distance between various regions of interest, rather than to a specific number of regions across the wall. Thus in cases of thicker walls, allowing for more regions to be placed across the wall while respecting our minimum distance between adjacent regions, the separation results from this study should apply still for such an increased number of regions.
High fraction of rejected acqusitions
Nine of 32 participants (28%) were rejected in this serial study of six different averaging settings. The high fraction of rejected individuals does not indicate low feasibility of the multiple layer method per se. Indeed, we recorded and postprocessed adequate singular cineloops from all 32 initial participants, sufficient for two- and three-layer-measurements. However, distinct motion pattern changes between the last recordings within the set of six, showed how the plane in nine of the cases had drifted off from its origin, precluding comparison between the six recordings. Only the 23 series in which all six recordings were comparable, have been included in the study. Thus, these nine rejected ones merely reflect the difficulty in repeating acquisition six times without any change in probe position.
Clinical relevance
The present work shows that velocity, strain rate and strain may be measured independently in subendocardial, midmyocardial, and subepicardial thirds of the left ventricular myocardial wall, offering a method for evaluation of these layers separately. It opens for a more detailed evaluation of cardiomechanics in health and disease, even though multilayer analysis is but one of many parts in the complex contraction pattern (Citation10). The new method is expected to be particularly relevant in ischaemia and hypertrophy. Yet, it remains to be examined if such measurements add diagnostic information on top of established methods.
Study limitations
The population studied consisted of young adults with excellent echogeneity. It would require further studies to assess the applicability of our findings to groups of patients with various diseases. The postprocessing was not blinded. Thus it is theoretically possible that knowledge about level of averaging in each loop influenced us during postprocessing.
Only separation along the ultrasound beam has been investigated, and similar separation laterally remains to be tested. The protocol was time consuming. Simplified into one cineloop however, acquisition would take less than 1 minute and postprocessing and careful evaluation 10–15 minutes.
As the profound TDI changes in the cases of unintended tilting towards the mitral anulus showed, the method depends upon precise sample positioning, and we recommend minimal time between activating the zoom and acquiring the samples.
The regions of interest were carefully anchored through the cardiac cycle, in order to track the respective layers of the myocardial wall correctly. Yet, this anchoring did not track the .1 cm motion of the basal ventricular myocardium, through the imaging plane towards the apex during systole and back towards the atrium during diastole. Thus, effectively it was not the same piece of myocardium that was examined throughout the cardiac cycle.
Conclusion
It is possible to measure radial systolic strain in multiple myocardial layers. These results are obtained by use of standard colour TDI with commercially available software. Separation of two layers is reliable, while separation into three layers is problematic in non-hypertrophic walls, as shown by the variation in strain values. Subendocardial strain is two to three times as large as the subepicardial strain. Our findings suggest that TDI should be tested in patients for assessment of radial deformation in separate layers.
Acknowledgements
Equipment was purchased with financial support from the Research Council of Norway (Project no. 166200/V00). Information about technical details was provided by GE Vingmed Ultrasound, Horten and Bergen, Norway. The study was also supported by the former Locus for Cardiac Research, University of Bergen.
Declaration of interest: The authors report no conflicts of interest. The authors alone are responsible for the content of this paper.
References
- Assomull RG, Lyne JC, Keenan N, Gulati A, Bunce NH, Davies SW, . The role of cardiovascular magnetic resonance in patients presenting with chest pain, raised troponin, and unobstructed coronary arteries. Eur Heart J. 2007;28:1242–9.
- Weidemann F, Dommke C, Bijnens B, Claus P, D’hooge J, Mertens P, . Defining the transmurality of a chronic myocardial infarction by ultrasonic strain-rate imaging – Implications for identifying intramural viability an experimental study. Circulation. 2003;107:883–8.
- Matre K, Moen CA, Fannelop T, Dahle GO, Grong K. Multilayer radial systolic strain can identify subendocardial ischemia: An experimental tissue Doppler imaging study of the porcine left ventricular wall. Eur J Echocardiogr. 2007;8:420–30.
- Uematsu M, Miyatake K, Tanaka N, Matsuda H, Sano A, Yamazaki N, . Myocardial velocity gradient as a new indicator of regional left ventricular contraction: Detection by a two-dimensional tissue Doppler imaging technique. J Am Coll Cardiol. 1995;26:217–23.
- Sengupta PP, Mehta V, Arora R, Mohan JC, Khandheria BK. Quantification of regional nonuniformity and paradoxical intramural mechanics in hypertrophic cardiomyopathy by high frame rate ultrasound myocardial strain mapping. J Am Soc Echocardiogr. 2005;18:737–2.
- Vitarelli A, Morichetti MC, Conde Y, Cimino E, D’Orazio S, Stellato S, . Assessment of severity in aortic stenosis-incremental value of endocardial function parameters compared with standard indexes. Ultrasound Med Biol. 2007;33:1224–35.
- Ogata H, Nakatani S, Ishikawa Y, Negishi A, Kobayashi M, Ishikawa Y, . Myocardial strain changes in Duchenne muscular dystrophy without overt cardiomyopathy. Int J Cardiol. 2007;115:190–5.
- Hanekom L, Lundberg V, Leano R, Marwick TH. Optimisation of strain rate imaging for application to stress echocardiography. Ultrasound Med Biol. 2004;30:1451–60.
- Hexeberg E, Homans DC, Bache RJ. Interpretation of systolic wall thickening. Can thickening of a discrete layer reflect fibre performance?. Cardiovasc Res. 1995;29:16–21.
- Cheng A, Nguyen TC, Malinowski M, Daughters GT, Miller DC, Ingels NB, Jr Heterogeneity of left ventricular wall thickening mechanisms. Circulation. 2008;118:713–21.
- Hashimoto I, Li X, Hejmadi BA, Jones M, Zetts AD, Sahn DJ. Myocardial strain rate is a superior method for evaluation of left ventricular subendocardial function compared with tissue Doppler imaging. J Am Coll Cardiol. 2003;42:1574–83.
- Maruo T, Nakatani S, Jin Y, Uemura K, Sugimachi M, Ueda-Ishibashi H, . Evaluation of transmural distribution of viable muscle by myocardial strain profile and dobutamine stress echocardiography. Am J Physiol Heart Circ Physiol. 2007;292:H921–H927.
- Wang J, Urheim S, Korinek J, Abraham TP, McMahon EM, Belohlavek M. Analysis of postsystolic myocardial thickening work in selective myocardial layers during progressive myocardial ischemia. J Am Soc Echocardiogr. 2006;19:1102–11.
- D’hooge J, Missant C, Claus P, Rex S, Eroglu E, Rademakers FE, . Gradients in radial strain across the cardiac wall studied with epicardial ultrasound. IEEE ultrasound symposium (Montreal, Canada). 2006;748–51.
- Adamu U, Schmitz F, Becker M, Kelm M, Hoffmann R. Advanced speckle tracking echocardiography allowing a three-myocardial layer-specific analysis of deformation parameters. Eur J Echocardiogr. 2009;10:303–8.
- Becker M, Ocklenburg C, Altiok E, Futing A, Balzer J, Krombach G, . Impact of infarct transmurality on layer-specific impairment of myocardial function: A myocardial deformation imaging study. Eur Heart J. 2009;30:1467–76.
- Kuznetsova T, Herbots L, Richart T, D’hooge J, Thijs L, Fagard RH, . Left ventricular strain and strain rate in a general population. Eur Heart J. 2008;29:2014–23.
- Moore CC, Lugo-Olivieri CH, McVeigh ER, Zerhouni EA. Three-dimensional systolic strain patterns in the normal human left ventricle: Characterization with tagged MR imaging. Radiology. 2000;214:453–66.
- Matre K, Fannelop T, Dahle GO, Heimdal A, Grong K. Radial strain gradient across the normal myocardial wall in open-chest pigs measured with Doppler strain rate imaging. J Am Soc Echocardiogr. 2005;18:1066–73.
- D’hooge J, Jamal F, Bijnens B, Thoen J, Heimdal A, Van de Werf F, . Calculation of strain values from strain rate curves: How should this be done?. IEEE ultrasound symposium (San Juan, Puerto Rico). 2000;1269–72.
- Storaa C, Lind B. Distribution of left ventricular longitudinal peak systolic strain and impact of low frame rate. Ultrasound Med Biol. 2004;30:1049–55.
- D’hooge J, Schlegel J. Evaluation of transmural myocardial deformation and reflectivity characteristics. IEEE ultrasound symposium (Atlanta, USA). 2001;1185–8.
- Voigt JU, Lindenmeier G, Exner B, Regenfus M, Werner D, Reulbach U, . Incidence and characteristics of segmental postsystolic longitudinal shortening in normal, acutely ischemic, and scarred myocardium. J Am Soc Echocardiogr. 2003;16:415–23.