
Abstract
Objectives. The aim of this study was to compare health-related quality of life (HRQoL) scores obtained from the instrument Short Form (SF)-36 through the so-called SF-6D utilities, and those obtained from 15D, in patients with ST-elevation myocardial infarction (STEMI), and to evaluate the consequences in estimation of quality adjusted life years (QALYs). Design. This was a sub-study of the Norwegian District Treatment of STEMI, in which patients with STEMI treated with tenecteplase, were randomized to early angioplasty or standard management (n = 266). HRQoL data were collected at all visits (0, 1, 3, 7 and 12 months). All patients with complete data were included (n = 248). Results. The score range was 0.33–1.0 for SF-6D and 0.49–1.0 for 15D. Mean utility scores from 15D were higher and had different distribution compared to scores from SF-6D. Mean QALY for the whole group was higher using 15D than SF-6D (0.89 vs. 0.77). The incremental number of QALYs with early angioplasty compared to standard treatment was 0.005 (95% CI: − 0.018 to 0.028) using SF-6D, and 0.004 (95% CI: − 0.010 to 0.018) using the 15D instrument. Conclusions. Choice of instrument may influence HRQoL scores, but not necessarily the gain in QALYs.
Introduction
Acute myocardial infarction may affect both physical and mental health in the short and long term. Treatment aims to avoid death or deterioration of health-related quality of life (HRQoL). To capture survival as well as HRQoL, the benefit of interventions is often measured in terms of quality-adjusted life years (QALYs) (Citation1).
Improvement in HRQoL can be measured with generic or disease-specific instruments, but in a cost–utility analysis, a preference-based generic instrument has to be used (Citation1). The value (utility) of a health state is measured on a scale where 0 is a health state equivalent to death and 1 indicates full health. The score reflects preferences in a general population for different health states relative to death and perfect health. QALYs combine survival and HRQoL into one measure, and it is represented by the area under the curve with utility (score) on the y-axis and time (life years) on the x-axis.
Short Form (SF)-36 is among the most commonly used generic instruments to evaluate HRQoL and is clinically useful by giving a health profile (Citation2,Citation3). SF-6D was developed to translate SF-36 score into a preference-based utility score and thereby allowing SF-36 to be used in health–economic analysis (Citation4). Sintonen 15D was developed for health–economic analysis (Citation5). It has five levels for each of the 15 dimensions, translating the score from the questionnaire directly into a utility measure.
There is no gold standard for valuing health states, that is, measuring utilities. It is important to acknowledge that HRQoL tools used in cost–utility analysis may influence the result and consequently, the priority setting. Previous studies of various patient populations have shown that the tools are not interchangeable (Citation6–11). Longitudinal studies to compare the impact of different tools on cost–utility analyses have been requested. Few comparisons between 15D and SF-6D have been published so far, and none in a population with myocardial infarction.
In the NORwegian Study on District treatment of ST-Elevation Myocardial Infarction (NORDISTEMI), we evaluated the benefits and costs of two strategies after thrombolysis in patients with ST-elevation myocardial infarction (STEMI; 12,13). HRQoL was measured using 15D, but data were also collected using SF-36.
The aim of this study was to compare HRQoL scores obtained from the instrument SF-36 through so-called SF-6D utilities, and those obtained by 15D, in patients with STEMI, to explore whether reduced left ventricular ejection fraction (LVEF) translates into reduced HRQoL and to evaluate the consequences in estimation of QALYs.
Material and methods
Patients
NORDISTEMI (NCT 00161005) was an open, prospective, randomized controlled trial performed in a rural, south-eastern part of Norway (2005–2009). In brief, 266 patients, aged 18–75 years, with acute STEMI of less than 6 h of duration and greater than 90 min expected time delay to angioplasty were treated with aspirin, tenecteplase, enoxaparin, and clopidogrel and randomized to either an early invasive or a conservative strategy (standard treatment). Follow-up visits were performed at 1, 3, 7, and 12 months. The study design and main results have been published earlier (Citation12,Citation13). After 3 months, nuclear imaging (SPECT) with determination of LVEF was performed. The study was approved by the Regional Committee for Medical Research Ethics (603–04238) and complies with the revised Declaration of Helsinki. Informed consent was obtained from the participants.
HRQoL instruments
HRQoL was registered at all visits. At hospital admission, the patients were carefully instructed to report their HRQoL as experienced 14 days before the infarction (baseline values).The questionnaires were mailed in advance of a scheduled meeting, and returned by mail if the follow-up was performed over phone (1- and 7- month follow-ups).
SF-36 encompasses eight dimensions of health status including physical functioning, role limitations due to physical problems, body pain, general health, vitality, social functioning, role limitations due to emotional problems, and mental health (Citation2,Citation3). This instrument has been validated and is a frequently used HRQoL instrument (Citation1). The Norwegian SF-36 standard version 1.2 was applied (Citation3). SF-6D is a utility instrument in which 11 items from SF-36 are converted into a six-dimensional health state with 2–6 levels for each dimension, and translated into a utility score using an algorithm developed by John Brazier (Citation4). Altogether, 249 health states were evaluated directly, while the rest were imputed from regression analyses.
The 15D is a generic, multi-attribute utility measure capturing 15 dimensions with five response levels for each dimension (from no problems to severe problems) (Citation6). The items are mobility, vision, hearing, breathing, sleep, eating, speech, bladder/bowel function, usual activities, mental function, discomfort/pain, depression, distress, vitality, and sexual activity. It was developed through a three-staged valuation procedure in the Finnish population (Citation5). The procedure decided the relative importance of the 15 dimensions on a 0–100 scale and within dimensions values on a 0–100 scale. Averaging, transformation and interpolation was done to obtain a preference weight for a level of a dimension and thereafter multiplied with the importance of that dimension. Final score was obtained using an additive model. For 15D as well as SF-6D, the minimal important difference is estimated to 0.03 by the instrument developers when examining within-patient changes (Citation5,Citation14). Other studies have recommended higher values.
Statistical analysis
Sample size calculation was performed for the primary endpoint of the main NORDISTEMI study (Citation12), and not for this sub-study. Histograms were used to present the distribution of the utility scores. Due to non-normality distribution, bootstrapping with 1000 replications was used to obtain mean, standard deviation (SD), confidence intervals (CI) and also for comparisons of means. For 15D, regression analyses were performed to handle missing data on sexual activity (www.15d-instrument.net). Agreement between the utility instruments was assessed using Bland–Altman plots. Spearman's rank correlation coefficient was used to evaluate the association between the QALYs obtained and the clinical and demographic values. One-year QALYs were estimated by assuming a linear relation between utility score from consecutive visits. The incremental QALYs for the early invasive compared to those of conservative strategy were estimated initially with crude data. To adjust for differences in baseline utility score a regression analysis with “group” and baseline utility as independent variables and QALYs as the dependent variable was performed (Citation15). Due to multiple comparisons, a Bonferroni correction of the significance threshold was used. A p value of less than 0.005 was considered statistically significant. Statistical analyses were performed using Epi Info version 3.4.3, 2005 and Statistical Package for Social Sciences (SPSS) version 18.
Results
Patients
A total of 266 patients were included in the NORDISTEMI study. The SF-36 questionnaires were returned by 258 patients at baseline, 255 at 1 month, 252 at 3 months, 250 at 7 months, and 250 at 12 months. These patients also returned the 15D questionnaire. The reasons for nonresponse were death (n = 7), stroke with aphasia (n = 2), incomplete questionnaire (n = 1), and unwillingness to participate (n = 8). Only those with complete data from all follow-up visits were included in this sub-study (n = 248). The clinical characteristics of this subgroup were well balanced except for an increased prevalence of hypertension in the late invasive group (). A total of 238 patients completed nuclear imaging after 3 months with estimation of LVEF, finding a mean value of 61% (SD: 13).
Table I. Baseline characteristics.
The response to the second item in SF-36 is reported to give an expression of the patient's self-evaluation of HRQoL. At 1-year follow-up, 83% of the participants described their health as “about the same or better than one year ago”. This represents an insignificant increase from baseline (75%).
SF-6D
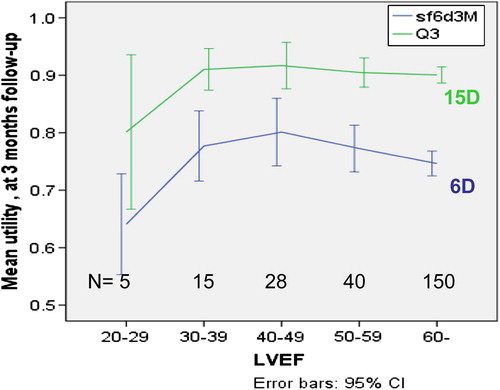
At baseline, the mean SF-6D score was 0.78 (SD: 0.14) in the whole group (n = 248). The lowest mean utility value was observed 1 month after the myocardial infarction with restoration of HRQoL at the 7-month follow-up. A significant reduction in utility was observed from baseline to 1-month follow-up with a mean difference of 0.06 (95% CI: 0.04–0.08, p = 0.001). No significant difference between the groups was observed at any point of time (). In patients with LVEF 40% or greater (n = 219), the utility values at 3 months was 0.76 (SD: 0.14) compared to 0.74 (SD: 0.12) among those with LVEF less than 40% (n = 19, mean difference: 0.02; 95% CI: − 0.04 to 0.08, p = 0.62).
Table II. Health-related quality of life (6D and 15D scores) according to strategy and time, presented as mean values (SD) and mean difference (SE).
15D
At baseline, the mean 15D score was 0.91 (SD: 0.09) in the whole group (n = 248). As with SF-6D, the lowest mean utility value was observed 1 month after the myocardial infarction with restoration of HRQoL at the 7-month follow-up. A significant reduction in utility was observed from baseline to 1-month follow- up with a mean difference of 0.02 (95% CI: 0.01–0.03, p = 0.001). No significant difference between the groups was observed at any point of time ().
The utility values at 3 months was 0.90 (SD: 0.09) in those with LVEF 40% or greater compared to 0.88 (SD: 0.09) among those with LVEF less than 40% (mean difference 0.02, 95% CI:− 0.02 to 0.06, p = 0.40).
Comparison between SF-6D and 15D
Both SF-6D and 15D utility scores had unimodal, but otherwise different distributions (). At all visits, more patients obtained maximum values using 15D than 6D, at baseline 13% versus 8%. A ceiling effect was observed, especially for 15D. This population was not suited for evaluating floor effects. The 15D instrument yielded higher values across all health states. The difference seemed to diminish with increasing utility score. This was shown in data from all follow-up visits, but illustrated here only by Bland–Altman plots of baseline and 1-month utility values (). The two instruments seemed to have equal ability to capture symptoms from reduced LVEF ().
Figure 1. Distribution of scores from SF-6D and 15D, presenting data from baseline to 1-month follow-up visit.
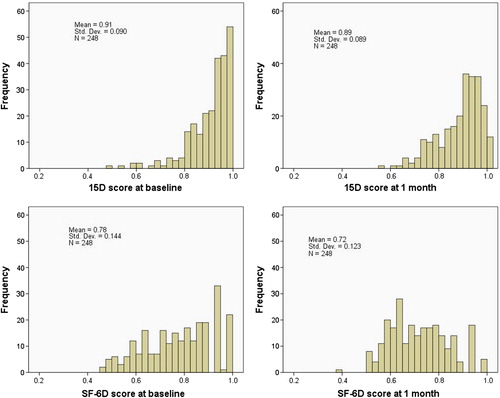
Figure 2. Bland–Altman plots to explore agreement between SF-6D and 15D utility at baseline and 1 month. Perfect agreement is represented by a horizontal line at y = 0 (stippled line). The other lines represent mean, ± 2 SD.
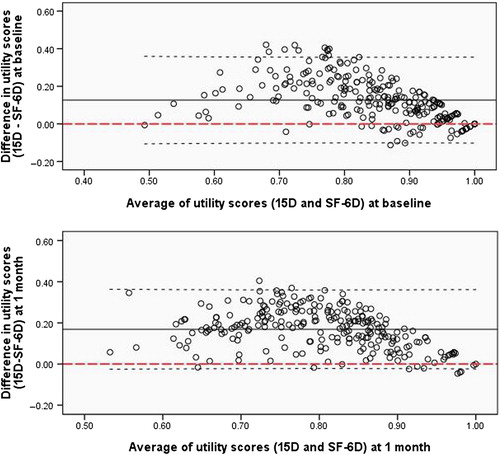
Figure 3. Utility scores related to left ventricular ejection fraction (LVEF) measured using nuclear imaging (SPECT) at 3-month follow-up visit.
Correlation with other health state measures
No significant correlation between LVEF and QALYs was observed (). Although some had chest pain, few experienced typical angina in daily life, and we did not test for correlation between angina and QALY.
Table III. Correlations (Spearman's r value) between the QALYs obtained with the utility instruments SF-6D and 15D and clinical and demographic variables in the study population (n = 248).
QALY evaluation
As a consequence of higher utility score during the whole period, the mean 1-year QALY for the whole group was correspondingly higher in 15D versus SF-6D (0.89 vs. 0.77). When evaluated by SF-6D, the mean QALYs was 0.77 (SD: 0.11) in the early invasive and 0.77 (SD: 0.12) in the conservative group with a mean difference of 0.004 (95% CI: − 0.02 to 0.03, p = 0.77,) in favor of the early invasive strategy. The corresponding results using 15D were 0.91 (SD: 0.08) in the early invasive and 0.90 (SD: 0.08) in the conservative group with a mean difference of 0.009 (95% CI: − 0.01 to 0.03, p = 0.39; Supplementary Figure 1, which is only available in the online version of the journal. Please find this material with the following direct link to the article: http://www.informahealthcare.com/doi/abs/10.3109/14017431.2014.923581).
When adjusting for baseline scores (Citation15), the incremental number of QALYs was 0.005 (95% CI: − 0.02 to 0.03, p = 0.69) using SF-6D and 0.004 (95% CI: − 0.01 to 0.02, p = 0.60) using the 15D instrument. Both results are consistent with no effect of early invasive treatment on the HRQoL. The mean difference in QALYs between those with LVEF 40% or greater (n = 219) and LVEF less than 40% (n = 19) was 0.04 (95% CI: − 0.01 to 0.10, p = 0.14) using the 6D and 0.03 (95% CI: − 0.01 to 0.06, p = 0.17) using the 15D instrument.
Discussion
In this cohort of patients with STEMI, we demonstrated discrepancies between two commonly used utility measures, 15D and SF-6D. The same pattern during follow-up was observed; the 15D instrument resulted in higher utility scores than 6D, and therefore higher QALYs. The difference in utility seemed to vary in magnitude across levels of health states, diminishing when utility is reaching 1.0, which is a consequence of the scale with 1.0 representing perfect health. According to both instruments, STEMI seems to result in a temporary and modest reduction in HRQoL. A small reduction in HRQoL was observed in those with LVEF less than 40%, but the difference was not significant. When using 15D and SF-6D to evaluate incremental QALYs, similar results were obtained. As recommended, we controlled for baseline utility when calculating QALYs (Citation15). Baseline utility enters directly into the calculation and represents a strong predictor of QALYs (Citation15). This correction had minor implications in this study as the imbalance between treatment groups was modest.
Our study confirms the relationship between SF-6D and 15D described earlier by Lillegraven and co-workers in patients with rheumatoid arthritis (Citation7). They reported a moderate agreement between SF-6D and 15D (Citation7), a weak correlation with demographic variables and moderate correlation with disease-specific measures. They concluded that choice of instrument might have an impact on cost–utility analyses because the utility weights are so diverging (Citation7). In the comparison of HRQoL instruments in a HIV/AIDS population, the difference between SF-6D and 15D seemed less pronounced (Citation11) and maximum value was obtained for 10%, equally with both instruments. In cardiac rehabilitation patients the difference in mean utility scores seemed even larger than in our study (Citation10).
Some of the differences between SF-6D and 15D might be due to different concepts of health being measured and the health dimensions they capture. In SF-36, the questions are measuring the performance of the individual, while the 15D is asking for the individual's perception of the situation. This may influence patients’ responses. As an example, especially older people might be satisfied with their physical capacity without being able to walk for long distances or to perform heavy housework. The perspective of the 15D is to assess the current condition, while the standard version of SF-36 has a 4-week time-frame for many of the questions. Although, we instructed the patients carefully to report from the last 2 weeks for both instruments, this difference has to be taken into account when interpreting the results. The questionnaires also differ in length, format, and response categories. Different methods have been used to elicit preferences and different statistical models have been applied to generate the utility scores (Citation1,Citation4,Citation5).
In the main NORDISTEMI study, the composite endpoint death, stroke, or reinfarction was significantly in favor of the early invasive strategy. In this sub-study, however, neither HRQoL instruments were able to detect differences between the two treatment groups. This might either be explained by limited clinical importance of the intervention, little impact of this composite endpoint on patients self-reported quality of life or inability of SF-36 and 15D to capture a real difference in outcome. However, both instruments captured a modest reduction in HRQoL 1 month following a STEMI. Furthermore, they both captured a small, although non-significant, reduction in HRQoL in those with LVEF less than 40%.
The choice of effect measure in a clinical trial is difficult and has to be related to population and intervention to be studied. Composite cardiovascular endpoints may have weakness (Citation16,Citation17), and recently, new methods taking severity of the single items in the composite endpoint and multiple endpoints into account have been suggested (Citation18,Citation19). When using this “weighted composite endpoint method”, the positive effect in the TRANSFER-AMI study, also comparing an early invasive to a conservative strategy after fibrinolysis, was lost (Citation20).
Lately, it has been focused on the need for patient reported health status when evaluating cardiovascular health (Citation21). The SF-36/6D and 15D instruments are not perfect, but the development and valuation processes are well described. Although utility seems dependent on the HRQoL instrument, QALY might be an attractive outcome to measure in clinical studies. It attends to the severity and to multiple events, combining mortality and HRQoL into a single measure as a graded response, different from the composite cardiovascular endpoints where the seriousness of the components differs, but counts equally.
Limitations
In this sub-study, the patients who died (n = 7) were not incorporated in the estimation of QALYs. Due to the low number and the even distribution between the groups, this will have minor implications, but inclusion would probably have reduced the difference between the instruments. In this study, the SF-36 questionnaire was utilized, using the 6D questionnaire directly might have given another result. The number of patients with LVEF less than 40% was low (n = 19), probably contributing to the lack of significance of the reduction in HRQoL seen in this group. The follow-up visits differed in context and this might have influenced the result.
Conclusion
In patients with STEMI treated with thrombolysis, mean utility score and mean QALYs were higher with the instrument 15D than with those of SF-6D. This difference did not influence the 1-year incremental number of QALYs. Both instruments captured a temporary reduction in HRQoL after STEMI and a small, although nonsignificant, reduction in HRQoL in those with LVEF less than 40% compared with the others.
Supplementary Figure 1
Download PDF (47.5 KB)Acknowledgment
We thank Dr. John E. Brazier for providing us with the algorithm for translating SF-36 scores to 6D scores and then to utilities, and also Dr. Ph. Kim Rand-Hendriksen for valuable comments in the preparation of the paper.
Declaration of interest: The authors report no declarations of interest. The authors alone are responsible for the content and writing of the paper.
This sub-study was funded by Innlandet Hospital Trust, Brumunddal, Norway (grant no. 150232).
References
- Brazier J, Ratcliffe J, Saloman JA, Tsuchiya A. Measuring and Valuing Health Benefits for Economic Evaluation. Oxford: Oxford University Press; 2007.
- Ware JE, Snow KK, Kosisnki M, Gandek B. SF-36 Health Survey. Manual and Interpretation Guide. Boston, MA: The Health Institute, New England Medical Center; 1993.
- Loge JH, Kaasa S, Hjermstad MJ, Kvien TK. Translation and performance of the Norwegian SF-36 Health Survey in patients with rheumatoid arthritis.I. Data quality, scaling, assumptions, reliability, and construct validity. J Clin Epidemiol. 1998;51:1069–76.
- Brazier J, Roberts J, Deverill M. The estimation of a preference-based measure of health from the SF.-36. J Health Econ. 2002;21:271–92.
- Sintonen H. The 15D instrument of health-related quality of life: properties and applications. Ann Med. 2001;33: 328–36.
- Conner-Spady B, Suarez-Almazor ME. Variation in estimation of quality-adjusted life-years by different preference-based instruments. Med Care. 2003;41:791–801.
- Lillegraven S, Kristiansen IS, Kvien TK. Comparison of utility measures and their relationship with other health status measures in 1041 patients with rheumatoid arthritis. Ann Rheum Dis. 2010;69:1762–67.
- Whitehurst DGT, Bryan S. Another Study showing that two preference-based measures of health-related quality of life (EQ-5D and SF-6D) are not interchangeable. But why should we expect them to be. Value Health. 2011;14:531–38.
- Sørensen J, Linde L, Ostergaard M, Hetland ML. Quality-adjusted life expectancies in patients with rheumatoid arthritis - comparison of index scores from EQ-5D, 15D, and SF-6D. Value Health. 2012;15:334–39.
- Moock J, Kohlmann T. Comparing preference-based quality-of-life measures: results from rehabilitation patients with musculoskeletal, cardiovascular, or psychosomatic disorders. Qual Life Res. 2008;17:485–95.
- Stavem K, Frøland SS, Hellum KB. Comparison of preference-based utilities of the 15D, EQ-5D and SF-6D in patients with HIV/AIDS. Qual Life Res. 2005;4:971–80.
- Bøhmer E, Hoffmann P, Abdelnoor M, Arnesen H, Halvorsen S. Efficacy and safety of immediate angioplasty versus ischemia-guided management after thrombolysis in acute myocardial infarction in areas with very long transfer distances. J Am Coll Cardiol. 2010;55:102–10.
- Bøhmer E, Kristiansen IS, Arnesen H, Halvorsen S. Health and cost consequences of early versus late invasive strategy after thrombolysis for acute myocardial infarction. Eur J Cardiovasc Prev Rehabil. 2011;18:717–23.
- Walters SJ, Brazier JE. What is the relationship between the minimally important difference and health state utility values? The case of the SF.-6D. Health Qual Life Outcomes. 2003;1:4.
- Manca A, Hawkins N, Sculpher MJ. Estimating mean QALYs in trial-based cost-effectiveness analysis: the importance to control for baseline utility. Health Econ. 2005;14:487–96.
- Tomlinson G, Detsky AS. Composite endpoints inrandomized trials: there is no free lunch. JAMA. 2010; 303:267–8.
- Ferreira-Gonzáles I, Permanyer-Miralda G, Busse JW, Bryant DM, Montori VM, Alonso-Coello P, et al. Methodologic discussions for using and interpreting composite endpoints are limited, but still identify major concerns. J Clin Epidemiol. 2007;60:651–7.
- Bakal JA, Westerhout CM, Cantor WJ, Fernández-Avilés F, Welsh RC, Fitchett D, et al. Evaluation of early percutaneous coronary intervention vs. standard therapy after fibrinolysis for ST-segment elevation myocardial infarction: contribution of weighting the composite endpoint. Eur Heart J. 2013;34:903–8.
- Pocock SJ, Ariti CA, Collier TJ, Wang D. The win ratio: a new approach to the analysis of composite endpoints in clinical trials based on clinical priorities. Eur Heart J. 2012;33:176–82.
- Cantor WJ, Fitchett D, Borgundvaag B, Ducas J, Heffernan M, Cohen EA, et al. Routine early angioplasty after fibrinolysis for acute myocardial infarction. N Engl J Med. 2009;360: 2705–18.
- Rumsfeld JS, Alexander KP, Goff DC, Graham MM, Ho PM, Masoudi FA, et al. Cardiovascular health: the importance of measuring patient-reported health status. Circulation. 2013;127:2233–49.