Abstract
Background: The forced oscillation technique (FOT) is a noninvasive method with which to measure respiratory system resistance (Rrs) and reactance (Xrs) at a wide range of frequencies during breathing at rest in a short time. The purpose of this study was to assess the differences in Rrs and Xrs between patients with chronic obstructive pulmonary disease (COPD) and asthma using a new method of FOT with colored 3-dimensional visualization. Methods: Fifty-one patients with stable COPD and 49 patients with controlled or partly controlled asthma were enrolled. Whole-breath or within-breath changes of Rrs and Xrs were measured and compared between the diseases. Results: The colored 3-dimensional images clarified the complex oscillatory properties of the respiratory system. Whole-breath resistance (the difference in Rrs at 5 and 20 Hz) and reactance (Xrs at 5 Hz and resonant frequency), and within-breath changes in reactance (Xrs at 5 Hz and resonant frequency) discriminated between patients with COPD and asthma. In multivariate regression analyses, inspiratory-expiratory differences in Xrs at 5 Hz contributed significantly to the differentiation between COPD and asthma, independent of age, gender, body weight, and pulmonary function. Conclusion: This new method of FOT is useful in the differential diagnosis of COPD and asthma.
INTRODUCTION
The forced oscillation technique (FOT) is a noninvasive method with which to measure respiratory impedance, the spectral relationship between pressure and airflow (Citation1). The real part of impedance is called respiratory system resistance (Rrs), whereas the imaginary part is called respiratory system reactance (Xrs), which is supposed to reflect elastic and inertial properties of the lung. Forced oscillations are superimposed on tidal breathing, avoiding the need for any special breathing maneuver or noticeable interference with respiration. The impulse oscillation system has been introduced as a commercially available version of FOT, which offers respiratory impedance at a wide range of frequencies (Citation2).
Oscillatory properties of the respiratory system are generally expressed by a single curve of Rrs and Xrs versus frequency; however, technical advances in the impulse oscillation system enabled excellent time resolution, sufficient to draw variances with respiratory cycles. Increasing numbers of reports have examined the usefulness of the impulse oscillation system in the evaluation or management of obstructive diseases, including, chronic obstructive pulmonary disease (COPD) or asthma (Citation3–7).
Recently, Kurosawa et al. developed a new method of FOT with 3-dimensional color images with an added time axis to visualize the respiratory cycle dependence; that is, Rrs was higher and Xrs changed to shift more negative in the expiratory phase compared to the inspiratory phase (Citation8–10). Also, this apparatus clearly showed the frequency dependence of Rrs during expiration and inspiration; that is, Rrs increased at lower frequencies and fell with increasing frequencies in COPD. Three-dimensional colored images are potentially a tool with which to understand the complex oscillatory properties of the respiratory system.
In this cross-sectional study we measured respiratory resistance and reactance using a new method of FOT capable of colored 3-dimensional data visualization in patients with COPD and with asthma, and examined whether there were any differences between COPD and asthma and which oscillometric indices were useful in differentiating these diseases.
METHODS
Subjects
Fifty-one patients with COPD and 49 patients with bronchial asthma who attended outpatient clinics at Shizuoka General Hospital for routine check-ups between October 2009 and September 2010 were enrolled in this study.
The patients with COPD satisfied the definition of the Global Initiative for Chronic Obstructive Lung Disease (GOLD) (Citation11) and the severity was classified accordingly. They were clinically stable and had no exacerbations, defined as increased dyspnea associated with a change in the quality and quantity of sputum, for at least one month before the study. They were excluded from the study if they (1) had any history of asthma; (2) had atopy, defined by positive specific IgE antibodies to at least 1 inhalant allergen, including house dust mites, grass pollens, molds, cockroaches, cats, or dogs; (3) had had any acute viral infections within at least one month before the study; and, (4) were receiving home oxygen therapy.
The patients with asthma satisfied the definition of asthma of the Global Initiative for Asthma (GINA) (Citation12) and were receiving inhaled corticosteroids with or without other medications, including long-acting β2-agonists, leukotriene receptor antagonists, or sustained release theophylline for at least 3 months. Patients were excluded from the study if they (Citation1) had had any acute viral infections within at least 1 month before the study; (Citation2) were current smokers or had a smoking history of >10 pack-years; and (Citation3) had COPD.
Thirteen healthy control subjects without pulmonary diseases were recruited from our hospital staff. The protocols were approved by the local ethics committee and informed consent was obtained from all subjects prior to the study.
Measurement of respiratory impedance and spirometry
In the same examination day, when their clinical symptoms were stable, measurements of respiratory impedance using FOT and spirometry were performed. To avoid any influence of forced breathing, spirometry was performed after FOT. Short-acting β2-agonists were not used for more than 12 hours before these tests in every case. Respiratory impedance was measured with FOT using a commercially available machine (MostGraph-01; Chest M.I., Co. Ltd., Tokyo, Japan), which was developed by Kurosawa et al. (Citation8–10) and met standard recommendations (Citation1).
Using this machine, both random noise and Hanning impulse were available as oscillation signals. Impulse oscillatory signals generated by a loud speaker at intervals of 0.25 seconds were applied to the respiratory system through the mouthpiece during tidal breathing at rest. The mouth pressure and flow signals were measured and calculated to obtain Rrs and Xrs properties against oscillatory frequency ranging from 5 to 35 Hz. During measurements, the subjects supported their cheeks firmly to reduce upper airway shunting while sitting with their neck in a comfortable neutral posture. Since the curves of Rrs and Xrs versus frequency could be obtained every 0.25 seconds, they were serially lined up against the time axis with assigned color gradients, resulting in colored 3-dimensional imaging patterns. The results of measuring oscillatory properties were available as the mean values of inspiration or expiration phases, or mean changes during a respiratory cycle, thereby enabling whole-breath or within-breath (inspiratory-expiratory) analyses.
In the present study, we used Rrs at 5 and 20 Hz (R5 and R20, respectively), and the difference between R5 and R20 (R5–R20) as an indicator of the frequency dependence of Rrs, which is supposed to reflect inhomogeneous ventilatory mechanics, especially in COPD (Citation13). We also used Xrs at 5 Hz (X5), which reflects elastic or inertial properties of the lung and resonant frequency (Fres) where Xrs crosses zero and the elastic and inertial forces are equal in magnitude and opposite (Citation1). Each oscillatory index was expressed as whole-breath, inspiratory and expiratory phases, and the differences between inspiratory and expiratory phases (Δ).
A Chestac-8800 spirometer (Chest M.I., Co. Ltd.) was used to measure spirometry according to the standards of the American Thoracic Society (Citation14). Subjects’ backgrounds, including age, gender, height, body weight, and smoking history, were collected retrospectively from their medical records.
Statistical analysis
Comparisons among 3 subject groups were made using the Kruskal-Wallis test, followed by multiple comparisons among groups using the Mann–Whitney U-test. P values in multiple comparisons were adjusted using Holm's method. The chi-square or Fisher's exact test was used to test significance in group differences with respect to the percentage of patients in various categories. Correlations between variables were performed using the Spearman rank correlation coefficient. The Wilcoxon signed rank test was used to analyze inspiratory-expiratory changes in the same subjects. Since Rrs and Xrs are predictable by age, gender, height, and body weight (Citation1), and are known to have moderate correlations with FEV1 (Citation3, 4), we performed subgroup analyses comparing patients with COPD and those with asthma: aged over 60 years old, FEV1 < 80% predicted, and matching age and FEV1.
Following these, we performed multivariate logistic regression analyses to adjust effects among multiple variables for the diagnosis of COPD. Model selection was made by the best subset selection procedure using Akaike's information criteria (AIC). All statistical analyses were performed using R version 2.11.1 (The R Foundation for Statistical Computing, Vienna, Austria, 2010). A value of p < 0.05 was considered significant for the results of all statistical analyses, and all tests were 2-sided.
Table 1 Characteristics of the Study Patients
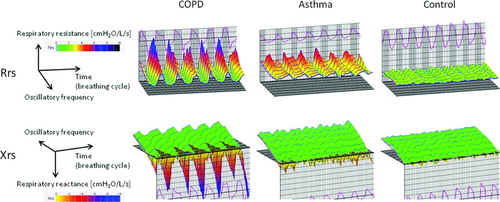
Figure 1 Colored 3 dimensional images of respiratory system resistance (Rrs) and reactance (Xrs) in each representative subject. Exp, expiratory; insp, inspiratory.
RESULTS
Characteristics of the subjects
The characteristics of the study subjects are shown in . Patients with COPD were staged according to the GOLD criteria (11 stage 1, 18 stage 2, 19 stage 3, and 3 stage 4 COPD). Patients with asthma included 39 atopic patients, had a disease duration of 15 ± 10 (years, mean ± SD), and were classified according to the GINA criteria of asthma control (21 controlled and 28 partly controlled). Overall, the patients with COPD were older and had more impaired pulmonary functions than those with asthma.
Colored 3-dimensional visualization of oscillatory properties
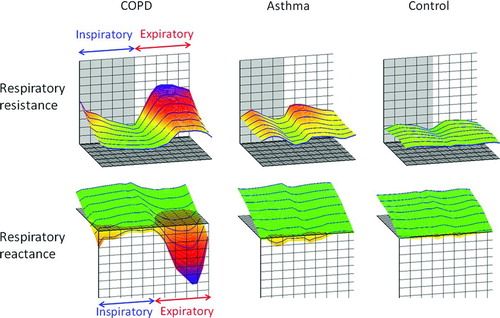
shows typical colored 3-dimensional images of Rrs and Xrs in each representative subject. Respiratory cycle dependence; Rrs was higher and Xrs shifted more negative in the expiratory phases compared to the inspiratory phases, and negative frequency dependence; Rrs increased at lower frequencies and fell with increasing frequencies, which was marked in patients with COPD. In contrast, Rrs was moderately high over the entire frequency and respiratory cycle, and Xrs shifted slightly negative in patients with asthma. There were few within-breath changes or frequency dependence in the control subjects. shows colored 3-dimensional visualization of the arithmetic means of oscillatory properties in a respiratory cycle in each subject.
Figure 2 Colored 3 dimensional visualization of arithmetic means of oscillatory properties in a respiratory cycle in each representative subject.
Whole-breath analyses: comparison between COPD, asthma, and controls
The results of whole-breath analyses of Rrs and Xrs are shown in Tables and . There were weak or moderate correlations between Rrs and Xrs values and FEV1 and FEV1 /FVC. Overall, Rrs and Xrs values showed greater values in the more severe patients with COPD or asthma. R5 was significantly higher in patients with COPD than in controls, but not in those with asthma. There was no difference in R20 among patients with COPD, asthma, and controls. R5–R20 and Fres were significantly higher and X5 was significantly lower in patients with COPD than in those with asthma and the controls.
Table 2 Correlations between Pulmonary Function and Rrs or Xrs in Whole-breath Analyses
Table 3 Whole-Breath and Within-Breath Analyses of Respiratory System Resistance and Reactance
Within-breath analyses: comparison between inspiratory and expiratory phases
The R5, R20, and R5–R20 values were significantly higher in the expiratory phase than in the inspiratory phase in all subject groups (). In contrast, X5 values were significantly lower in the expiratory phase than in the inspiratory phase only in patients with COPD, whereas Fres values were significantly higher in the expiratory phase in both patients with COPD and asthma than in controls ().
Figure 3 Within-breath changes of respiratory system reactance. Exp, expiratory; X5, reactance at 5 Hz; Fres, resonant frequency; insp, inspiratory.
Within-breath analyses: comparison between COPD, asthma, and controls
There was no significant difference in inspiratory, expiratory, and the difference between inspiratory and expiratory phases (Δ) of R5 and R20 among patients with COPD, asthma, and controls (). Inspiratory and expiratory R5–R20 were significantly higher in patients with COPD than in those with asthma and controls; however, there was no difference in Δ(R5–R20) between patients with COPD and asthma. Inspiratory, expiratory, and Δ of X5 and Fres were significantly lower or higher, respectively, in patients with COPD than in those with asthma or controls, except for inspiratory X5.
Comparison between COPD and asthma: patients aged over 60 years old or with FEV1 < 80% predicted and patients with matching age and FEV1 (% predicted)
In patients aged over 60 years old, whole-breath and Δ of R5–R20, X5, and Fres significantly discriminated between the 45 patients with COPD and the 20 patients with asthma. In patients with FEV1 < 80% predicted, however, ΔX5 only was significantly lower in the 40 patients with COPD than in the 23 patients with asthma, but not whole-breath or within-breath oscillometric properties. Further, in patients with matching age and FEV1 (% predicted), ΔX5 only discriminated between 26 patients with COPD and 26 patients with asthma.
Multivariate analyses
The models consisted of patients’ backgrounds, pulmonary function, and oscillometric indices. The selected model included six variables as follows: age, male gender, body weight, VC, FEV1, and ΔX5 (AIC = 79.9, ). The adjusted odds ratio of ΔX5 was 2.142, indicating that the greater differences in X5 within the breathing cycles significantly contributed to the diagnosis of COPD, independent of age, gender, body weight, and pulmonary functions. If ΔX5 was replaced by whole-breath R5–R20, X5, and Fres, Δ(R5–R20), or ΔFres, they were not significant.
Table 4 Multivariate Logistic Regression Analyses
DISCUSSION
We assessed the differences in Rrs and Xrs between patients with COPD and asthma using a new method of FOT capable of colored 3-dimensional data visualization. We demonstrated that whole-breath R5–R20, X5, and Fres and within-breath changes in Xrs (ΔX5 and ΔFres) discriminated between patients with COPD and those with asthma. In multivariate regression analyses, ΔX5 contributed significantly to the differentiation between COPD and asthma, independent of age, gender, body weight, and pulmonary function (VC and FEV1).
Using FOT, Rrs was almost constant against the oscillation frequency in healthy subjects; however, Rrs increased at lower frequencies and fell with increasing frequencies in patients with COPD. This phenomenon has been called the frequency dependence of Rrs, which is explained on the basis of the mechanical inhomogeneity of the lungs (Citation1). The method developed by Kurosawa et al. (Citation8–10) and used in this study clearly showed the negative frequency dependence of Rrs by colored 3-dimensional images. Further, this method clearly demonstrated that Rrs was higher and Xrs shifted more negative in the expiratory phase compared to the inspiratory phase. These phenomena are called respiratory cycle dependence. To the best of our knowledge, this is the first study to compare respiratory Rrs and Xrs with colored 3-dimensional images among patients with COPD, asthma, and healthy controls.
We consider the colored 3-dimensional analyses convenient for the following reasons. First, respiratory resistance is colored according to each approximate value (cmH2O/L/s): 1–2, green; 3, yellow; 5, red; and 8, blue, while reactance is also colored: plus values, green; and minus values, from yellow to blue (). Thus, colorimetric display enables us to know the measured values: green means low or normal resistance and blue means very high resistance, and so on. Secondly, colorimetric display shows disease-specific patterns.
Typical patients with COPD show green in the inspiratory phases and yellow-red-blue gradations in the expiratory phases, reflecting the respiratory cycle dependence. COPD patients also have the negative frequency dependence, that is, blue at lower frequencies and yellow or red at higher frequencies. In contrast, patients with asthma show overall yellow patterns. If duration of the disease is very long or patients have uncontrolled asthma, the colorimetric display resembles the COPD pattern. Thirdly, colorimetric analyses enable us to detect slight changes in oscillatory indices. In comparison before and after treatment in COPD, for example, disappearance of blue at the top means the improvement in the course of the disease.
In the present study, the measurement of whole-breath R5 and R20 showed no significant difference among patients with COPD, asthma, and controls except for the difference in R5 between patients with COPD and controls; however, whole–breath R5–R20 was significantly higher in patients with COPD than in those with asthma and controls. The measurement of whole-breath Xrs showed that X5 was significantly more negative and Fres was more elevated in patients with COPD than in those with asthma and controls.
Previous studies have shown controversial results. Van Noord et al. found that Rrs at 6 Hz was significantly increased in patients with asthma compared to patients with chronic bronchitis or emphysema, but the decrease in Xrs was least pronounced in patients with emphysema (Citation15), whereas Paredi et al. reported that whole-breath analysis of Rrs and Xrs failed to distinguish between patients with asthma and COPD, even when patients with more severely affected pulmonary function were compared (Citation3).
Kanda et al. found that whole-breath R20 was significantly increased in patients with asthma while Fres was elevated in patients with COPD (Citation4). Concerning R5–R20, Kanda et al. also reported the highest values in patients with COPD compared to those with asthma and controls, which was consistent with the present study, but others did not analyze this parameter in this regard. Possible explanations for the discrepancy might be the age distribution of the studied subjects, degree of pulmonary function impairment, or method of FOT. These findings suggest the limitation of whole-breath analysis and the need for within-breath, inspiratory and expiratory, analysis of Rrs and Xrs.
Expiratory flow limitation (EFL) during tidal breathing is a major determinant of dynamic hyperinflation and exercise limitation in COPD (Citation16). This dynamic airway narrowing has been detected visually in a patient with severe COPD by a high-speed electron-beam computed tomography (Citation17). EFL is common in patients with COPD and is caused by the loss of pulmonary elastic recoil.
Dellacà et al. reported that within-breath variations of Xrs (ΔX5) measured with FOT allowed the detection of EFL (Citation13,Citation16,Citation18). They stated that, normally, the reactance reflected the elastic and inertial properties of the respiratory system but with flow limitation, oscillatory signals could not pass through the choke points and reach the alveoli, producing a marked reduction in the apparent compliance and a fall in reactance. In the present study, we found that within-breath changes in Xrs (ΔX5 and ΔFres) discriminated between patients with COPD and asthma.
Previous investigators obtained similar results with the impulse oscillation system, a slight different method of FOT from the method in the present study. Paredi et al. found that inspiratory-expiratory X5 analysis differentiated patients with asthma from those with COPD (Citation3). Kanda et al. also demonstrated that within-breath changes in ΔX5 were significantly greater, but not ΔR5, in patients with COPD than in those with asthma or controls (Citation4). Thus, these results indicate that within-breath Xrs analyses are a useful technique to differentiate between COPD and asthma and possibly to detect EFL.
Using multivariate regression analyses, we found that only ΔX5 contributed significantly to the differentiation between COPD and asthma, independent of age, gender, body weight, and pulmonary function (VC and FEV1). The patients with COPD in this study were older, with male dominance, and severely impaired pulmonary function compared to those with asthma; however, we could exclude the effects of these features in the differentiation between COPD and asthma.
Colored 3-dimensional images of representative patients showed greater negative frequency dependence and higher values of Rrs in COPD, while moderately high Rrs against entire oscillation frequencies in asthma. The differences in visualized images were confirmed by the significant differences in R5–R20 values of patients with COPD compared to those with asthma in the present study. Studies using the difference between Rrs at lower and higher frequencies as an index of the frequency dependence of resistance are increasing.
Dellacà et al. found that mean difference in resistance at 5 and 19 Hz fell significantly after inhalation of bronchodilators in COPD, suggesting that the pattern of airway obstruction became more monogeneous after bronchodilation (Citation13). The difference in R5–R20 between patients with COPD and healthy controls or changes after medications have previously been reported (Citation5–7). The present study suggests that R5–R20 can be used in whole-breath analysis, whereas the lower sensitivity of Rrs (R5 and R20) compared to Xrs in the discrimination between patients with COPD and with asthma was consistent with previous studies (Citation3, 4).
The present study also evaluated the differences in Rrs and Xrs between patients with COPD or asthma and control subjects. Rrs failed to differentiate between patients with COPD or asthma and controls, except for R5, between patients with COPD and controls. Whole-breath, inspiratory, and expiratory Xrs could discriminate between patients with COPD or asthma and controls, whereas within-breath changes in Xrs failed to discriminate between patients with asthma and controls. These results indicate that whole-breath Xrs, not Rrs, analyses are useful in the differential diagnosis of COPD or asthma from controls. Also, lack of significant differences between ΔX5 and ΔFres in patients with asthma and controls suggested that few patients had dynamic airway narrowing during tidal breathing at rest.
The method used in the present study was different from the classical forced oscillation technique using multi-frequency oscillation signals such as random noise and impulses, which enabled the detection of not only Rrs but also Xrs in a short time. In this regard, the method used in the present study resembles the impulse oscillation system (Citation2); however, the differences between these methods include the type of pulse impulse (Hanning versus pyramidal), pulse generation interval (0.25 versus 0.2 seconds), use of random noise in addition to pulse impulse as oscillation signals (present study), and the ability of colored 3-dimensional data presentation and the analysis of mean changes during a respiratory cycle (present study). A strong correlation between these 2 methods but slightly lower values of Xrs indices in the present study compared to the impulse oscillation system has been reported (Citation19).
In conclusion, whole-breath analyses of resistance (the difference in resistance at 5 and 20 Hz), and whole-breath and within-breath changes of reactance (reactance at 5 Hz and resonant frequency) discriminated between patients with COPD and asthma. Inspiratory-expiratory changes in reactance at 5 Hz significantly contributed to the differentiation between COPD and asthma, independent of age, gender, body weight, and pulmonary function. The new method of FOT with colored 3-dimensional data visualization is useful in the diagnosis of COPD and asthma.
DECLARATION OF INTEREST
The authors report no conflicts of interest. The authors alone are responsible for the content and writing of the paper.
REFERENCES
- Oostveen E, Macleod D, Lorino H, , on behalf of the ERS Task Force on Respiratory Impedance Measurements. The forced oscillation technique in clinical practice: methodology, recommendations and future developments. Eur Respir J 2003; 22:1026–1041.
- Hellinckx J, Cauberghs MDe Boeck K, Evaluation of impulse oscillation system: comparison with forced oscillation technique and body plethysmography. Eur Respi J 2001; 18: 564–570.
- Paredi P, Goldman M, Alamen A, Comparison of inspiratory and expiratory resistance and reactance in patients with asthma and chronic obstructive pulmonary disease. Thorax 2010; 65:263–267.
- Kanda S, Fujimoto K, Komatsu Y, Evaluation of respiratory impedance in asthma and COPD by an impulse oscillation system. Intern Med 2010; 49:23–30.
- Kubota M, Shirai G, Nakamori T, Low frequency oscillometry parameters in COPD patients are less variable during inspiration than during expiration. Respir Physiol Neurobiol 2009; 166:73–79.
- Nieto A, Pamies R, Oliver F, Montelukast improves pulmonary function measured by impulse oscillometry in children with asthma (Mio study). Respir Med 2006; 100: 1180–1185.
- Yamaguchi M, Niimi A, Ueda T, Effect of inhaled corticosteroids on small airways in asthma: investigation using impulse oscillometry. Pulm Pharmacol Ther 2009; 22:326–332.
- Ohishi J, Kurosawa H, Shimizu Y, Three dimensional color images of oscillatory properties of respiratory system. Am J Respir Crit Care Med 2009; 179:A6074.
- Kurosawa H, Ohishi J, Shimizu Y, Visualization of frequency and respiratory cycle dependency in the lung evaluated using impulse oscillation. www.ers-education.org/media/2009/ eposters/1118.html. Date last updated: September 2009. Date last accessed: March 30, 2011.
- Kurosawa H, Ohishi J, Shimizu Y, A new method to assess lung volume dependency of respiratory system resistance using forced oscillation. Am J Respir Crit Care Med 2010; 181: A1240.
- Global strategy for diagnosis, management, and prevention of COPD. www.goldcopd.org. Date last updated: December 2010. Date last accessed: March 30 2011.
- Global strategy for asthma management and prevention 2009 (update). www.ginasthma.org. Date last updated: December 2009. Date last accessed: March 30 2011.
- Dellacà RL, Pompilio PP, Walker PP, Effect of bronchodilatation on expiratory flow limitation and resting lung mechanics in COPD. Eur Respir J 2009; 33:1329–1337.
- American Thoracic Society. Standardization of spirometry, 1994 update. American J Respir Crit Care Med 1995; 152:1107–1136.
- van Noord JA, Clément J, van de Woestijine KP, Total respiratory resistance and reactance in patients with asthma, chronic bronchitis, and emphysema. Am Rev Respir Dis 1991; 143:922–927.
- Dellacà RL, Santus P, Aliverti A, Detection of expiratory flow limitation in COPD using the forced oscillation technique. Eur Respir J 2004; 23:232–240.
- Kurosawa H, Kohzuki M. Images in clinical medicine. Dynamic airway narrowing. New Engl J Med 2004; 350: 1036.
- Dellacà RL, Duffy N, Pompilio PP, Expiratory flow limitation detected by forced oscillation and negative expiratory pressure. Eur Respir J 2007; 29:363–374.
- Nakagawa M, Sugiyama A, Deguchi N, Correlation between Master Screen IOS and MostGraph-01. Arerugi 2010; 59: 1468.