
Abstract
Constant work rate (CWR) exercise testing is highly responsive to therapeutic interventions and reveals physiological and functional benefits. No consensus exists, however, regarding optimal methods for selecting the pre-intervention work rate. We postulate that a CWR whose tolerated duration (tlim) is 6 minutes (WR6) may provide a useful interventional study baseline. WR6 can be extracted from the power-duration relationship, but requires 4 CWR tests. We sought to develop prediction algorithms for easier WR6 identification using backward stepwise linear regression, one in 69 COPD patients (FEV1 45 ± 15% pred) and another in 30 healthy subjects (HLTH), in whom cycle ergometer ramp incremental (RI) and CWR tests with tlim of ∼6 minutes had been performed. Demographics, pulmonary function, and RI responses were used as predictors. We validated these algorithms against power-duration measurements in 27 COPD and 30 HLTH (critical power 43 ± 18W and 231 ± 43W; curvature constant 5.1 ± 2.7 kJ and 18.5 ± 3.1 kJ, respectively). This analysis revealed that, on average, only corrected peak work rate ( = WRpeak–1 min × WRslope) in RI was required to predict WR6 (COPD SEE = 5.0W; HLTH SEE = 5.6W; R2 > 0.96; p < 0.001). In the validation set, predicted and actual WR6 were strongly correlated (COPD R2 = 0.937; HLTH 0.978; p < 0.001). However, in COPD, unlike in HLTH, there was a wide range of tlim values at predicted WR6: COPD 8.3 ± 4.1 min (range 3.6 to 22.2 min), and HLTH 5.5 ± 0.7 min (range 3.9 to 7.0 min). This analysis indicates that corrected WRpeak in an incremental test can yield an acceptable basis for calculating endurance testing work rate in HLTH, but not in COPD patients.
Introduction
Constant work rate (CWR) testing is highly responsive to therapeutic interventions and reveals both physiological and functional benefits. Consequently, exercise endurance is used (although perhaps underused) as a primary outcome measure in clinical research in chronic obstructive pulmonary disease (COPD) patients (Citation1, 2). No consensus exists, however, regarding optimal methods for selecting the pre-intervention work rate for endurance testing.
Endurance exercise tests are commonly performed at a fixed percentage (70–80%) of peak work rate attained during a preceding incremental exercise test (WRpeak) (Citation1, Citation3–5). This approach has a logical concern relating to the hyperbolic nature of the relationship between tolerated exercise duration (tlim) in the very-heavy intensity domain and power output (P); this is determined by two seemingly independent parameters: the critical power (CP) and the curvature constant (W′) (Citation6–9). Since both CP and W′ vary widely, e.g. CP ranges ∼60–85% of WRpeak and W′ ranges ∼5–30 kJ among individuals (Citation10–12), selection of a fixed percentage of WRpeak for all subjects predictably leads to wide variations in tlim (Citation13).
The shape of the P-tlim curve highlights an additional complexity: if pre-intervention CWR test durations vary among subjects (as commonly occurs at a given%WRpeak), then the expected magnitude of improvement will also vary, leading to non-normal distribution of tlim change (Citation3, Citation14). This dramatically complicates statistical comparisons and the interpretation of intervention -efficacy (Citation2, 3, Citation9, Citation15, Citation29).
Arguments can be made for adoption of a fixed pre-intervention CWR endurance in interventional studies (Citation9). As mentioned, fixing endurance test initial duration simplifies interpretation of tlim change. Additionally, for work rates tolerated for more than ∼30 minutes, tlim is likely determined by factors other than cardiopulmonary limits, such as substrate availability and motivation (Citation8, Citation16). Work rates causing tlim in less than ∼2 minutes are typically limited by pain and/or peripheral muscle fatigue (Citation17), especially in COPD patients whose ventilatory and gas exchange kinetics are generally slow (Citation10, Citation18).
A work rate yielding tlim in ∼4–8 minutes, on the other hand, provides information on the key physiologic processes contributing to exercise intolerance during the activities of daily living, e.g., dynamics and capacities for aerobic (Citation19–22) and anaerobic energy provision, and ventilatory and circulatory system characteristics (Citation23–26). Indeed, cardiopulmonary exercise testing guidelines suggest CWR tests should be “at least 6 minutes” (Citation1, Citation9, Citation27). Consequently, identification of a CWR that achieves intolerance in 6 minutes (WR6) may provide a sound basis for endurance testing. Additionally, a WR6 test would be of comparable duration to other commonly used clinical tests such as the 6-minute walk (Citation27, 28) and the endurance shuttle walk (Citation30).
While WR6 can be derived directly from the power-duration (P-tlim) relationship, traditional approaches to determine P-tlim typically require 4 CWR exercise tests (Citation7, 8, Citation17), severely hampering clinical application. We therefore sought to determine whether WR6 can be predicted from incremental exercise responses and clinical characteristics, thereby bypassing complex P-tlim determination. We aimed to develop a prediction algorithm for WR6 in two groups with widely differing exercise capabilities and spirometric characteristics: COPD patients and healthy subjects (HLTH). We based this analysis on a database of paired incremental and CWR tests, selecting subjects with a CWR tlim of ∼6 minutes. We then sought to validate this algorithm using a database of HLTH and COPD subjects in whom P-tlim had been established from multiple CWR tests from which WR6 could be interpolated. Finally, we calculated the tlim distribution at the predicted WR6 in both groups to assess the algorithm's utility for work rate selection in endurance testing.
Methods
Ethical approval
The Institutional Review Board of the Los Angeles Biomedical Research Institute approved the COPD studies and the Research Ethics Committee of the University of Leeds approved studies of HLTH subjects. Studies were performed in compliance with the Declaration of Helsinki. Written informed consent was obtained from all volunteers prior to participation.
Study subjects
Data from 156 people were utilized: 96 COPD patients and 60 HLTH males. Participant characteristics are presented in . HLTH subjects were screened with a health history, physical activity readiness questionnaire, and resting 12-lead electrocardiogram. HLTH subjects were involved in regular recreational activities or amateur competitive sport. No COPD patient was participating in a formal exercise program.
Table 1. Participant characteristics and exercise responses
Pulmonary function testing
Each COPD subject underwent resting spirometry (Vmax 229, VIASYS SensorMedics, Yorba Linda, California); 200–400 μg of albuterol was inhaled at least 10 min before testing. Maximum voluntary ventilation (MVV) was calculated as FEV1 × 40 (where FEV1 is forced expiratory volume in 1 s during maximal exhalation). Lung volumes were measured by plethysmography (AutoBox 6200D, SensorMedics). Testing fulfilled ATS/ERS guidelines (Citation31–33).
Exercise protocols
Exercise tests used electromagnetically braked cycle ergometers (HLTH: Excalibur Sport, Lode BV, NL; COPD: Ergoline800, SensorMedics). Participants undertook ramp-incremental testing, consisting of ∼1–3-minute seated rest, ∼3–4-minute low work rate exercise (unloaded for COPD, 20W for HLTH), a linear work rate increase to intolerance, and 2–5 minutes of recovery. Incrementation rate (WRslope) was selected with the aim of achieving the limit of tolerance in ∼8–12 minutes and was 15–25 W/min for HLTH, and 5W/min (FEV1 < 1.0 L) or 10 W/min (FEV1 > 1.0 L) for COPD. Verbal encouragement was provided.
Participants also completed one or more CWR tests; subjects sat at rest (∼1 minute) and then completed ∼4 minutes of low intensity cycling (unloaded for COPD, 20W for HLTH), after which work rate was abruptly increased and the subject verbally encouraged to -continue to the limit of tolerance.
These tests were drawn from a database of 370 paired tests in which COPD and HLTH subjects had performed incremental tests followed by CWR tests. Testing was performed in the course of a variety of clinical trials or experimental series involving interventions (including exercise training and, in COPD patients, anabolic steroids). Both pre- and post-intervention data were included, but any individual was only included once, and the exercise tests were drawn from the same time point in any one study. We identified for analysis in this investigation 69 COPD and 30 HLTH participants in which tlim was ∼6 minutes (range: 5–7 minutes).
Additionally, 30 HLTH and 27 COPD participants completed a semi-randomized series of at least 4 CWR tests to tolerance, each at a different work rate, to characterize the P-tlim relationship and determine CP and W′. The tlim of CWR tests aimed to span ∼3–15 minutes. For HLTH, tests were on separate days with at least 48 hours between tests. For COPD a maximum of two tests were completed on each day with at least 2 hours of recovery separating tests; prior exercise does not affect CP, and the >2 hour recovery allows near-complete W′ restitution (Citation34, 35). Within each visit, the lower of the two work rates was completed first.
Incremental test analyses
Pulmonary gas exchange and ventilation were measured breath-by-breath (MSX, nSpire Health Ltd or Vmax, Carefusion). Lactate threshold (LT) was estimated using the v-slope method, with corroborating gas exchange and ventilatory criteria (Citation36, 37). Peak oxygen uptake (VO2peak) and peak expired ventilation (VEpeak) were the average over the last 30s of incremental testing. Differences in ramp slopes among subjects (that are extreme in this study because of the wide difference in aerobic capacity between COPD and HLTH groups) will predictably yield differences in WRpeak (higher ramp slopes yielding higher WRpeak). We, therefore, applied an empiric correction factor: corrected WRpeak = WRpeak–1 min × WRslope (Citation9, Citation38) in an attempt to adjust for this. This correction factor incorporates the assumption that the mean response time of VO2 kinetics is roughly 1 min, but will be inaccurate to the degree that VO2 kinetics differ among subjects. Nevertheless, this difference is likely smaller than the differences among the ramp slopes used.
WR6 prediction by backward stepwise regression
The prediction group was composed of 69 COPD and 30 HLTH subjects with CWR tlim of ∼6 minutes, and was used to generate prediction equations for WR6 (WR6-pred). Pearson correlation was performed on all variables to obtain univariate correlation coefficients with WR6. Variables with the highest correlation coefficients and without co-linearity were used in multiple linear regression analysis with backward elimination, to determine the strongest predictor variables for WR6. Regression equations for WR6-pred were then produced independently for COPD and HLTH.
A non-overlapping validation group was composed of 27 COPD and 30 HLTH subjects in whom the power-duration relationship had been determined and was used to validate WR6-pred values. For the validation group, CP and W′ were estimated from the intercept and slope, respectively, of the linear relationship between P and 1/tlim using least squares regression. For each subject in the validation group the ‘true’ WR6 (WR6-true) was calculated from the individual CP and W’ and compared to WR6-pred (from the multiple linear regression). Additionally, the tlim at WR6-pred was calculated from CP and W′ for each validation group subject.
Statistics
Data normalcy was assessed by Shapiro-Wilk test. Two-way ANOVA compared condition (COPD vs HLTH) and group (prediction vs validation). Student's t-tests analyzed differences between paired comparisons (e.g. WR6-pred vs WR6-true). Bland–Altman plots (Citation39) were used to assess agreement between WR6 prediction and measurement. Frequency-distribution analyses with 7 cells spanning the data range assessed accuracy, precision and skewness of distributions of WR6-pred and tlim at WR6-pred. A 3 parameter Gaussian fit produced the frequency distribution curve. Statistical analyses were performed in SigmaPlot 12.3 (Systat Software Inc., Chicago, IL). Values are reported ±SD, unless noted; significance was accepted at p < 0.05.
Results
presents COPD and HLTH subject characteristics. COPD patients were older and shorter than HLTH subjects, but body mass was similar. Accordingly, body mass index (BMI) was greater in COPD. Pulmonary function testing revealed obstruction in COPD patients with an FEV1 of 1.29 ± 0.45 L (45 ± 15% predicted) and FEV1/forced vital capacity (FVC) of 43 ± 13%. WRpeak and VO2peak during the ramp-incremental test in COPD were only ∼25–30% of HLTH (74 ± 30 vs 329 ± 40 W; 1.16 ± 0.35 vs 3.98 ± 0.54 L/min; p < 0.001), but LT occurred at a greater percentage of VO2peak in COPD (67 ± 15 vs 49 ± 5%; p < 0.001). In COPD VEpeak in the ramp test was only 43±13 L/min, which averaged 86 ± 21% of MVV.
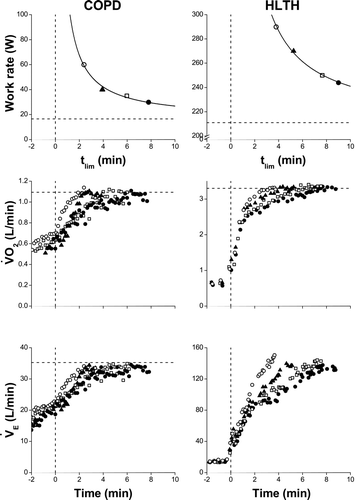
shows examples of the power-duration relationship in a representative COPD and HLTH participant, together with their CWR VO2 and VE responses; shows group means. As expected, CP was lower in COPD than HLTH (43 ± 18 vs 231 ± 43 W; p < 0.001), but occurred at similar percentage of corrected WRpeak in both conditions (70 ± 14 vs 75 ± 4%; p = 0.135). W′ in COPD averaged only 28% of HLTH (5.1 ± 2.7 vs 18.5 ± 3.1 kJ; p < 0.001).
Figure 1. Physiological responses to exercise tests at 4 different constant work rates (CWR) in COPD and healthy subjects (HLTH). Upper panels: Power-duration relationships in COPD and HLTH (horizontal dashed line is the critical power asymptote). Middle panels: Oxygen uptake (VO2) responses to 4 different CWR tests in COPD and HLTH (horizontal dashed line is VO2max from the ramp-incremental test). Bottom panels: Responses of ventilation (VE) to 4 different CWR tests in COPD and HLTH (horizontal dashed line is estimated maximum voluntary ventilation). Vertical dashed line in all panels represents start of the CWR bouts.
WR6 prediction in COPD and HLTH
The results of backward stepwise regression to predict WR6 are shown in . Variables considered in backward regression for COPD were age, BMI, sex, FEV1 (% predicted), residual volume/total lung capacity, FEV1/FVC, corrected WRpeak, heart rate reserve (HRR) and VEpeak. Variables excluded due to co-linearity were height, body mass, FEV1, VO2peak, breathing reserve and LT. This analysis revealed that, in COPD, only corrected WRpeak was a significant predictor of WR6. The resultant COPD WR6 prediction equation was (R2 = 0.958, SEE = 4.98 W, p < 0.001):
Table 2. Comparison between the results of the prediction algorithm for a constant work rate that results in exercise intolerance in 6 minutes (WR6-pred) and the true WR6 interpolated from the known power-duration relationship (WR6-true) in the validation cohort of COPD patients and healthy subjects
shows results of the similar regression in HLTH. Variables entered were age, BMI, corrected WRpeak, HRR and VEpeak (pulmonary function variables were not available). Variables excluded due to co-linearity were height, body mass, VO2peak, and LT. As in COPD, corrected WRpeak was the only linear regression variable required to predict WR6 (R2 = 0.972, SEE = 5.60 W, p < 0.001):
Validation of WR6 predictive equations
WR6-pred prediction equations in each condition were validated against WR6-true derived from interpolation of P-tlim relationships in 27 COPD and 30 HLTH (). WR6-pred was very strongly correlated with the WR6-true in both COPD (R2 = 0.937, p < 0.001) and HLTH (R2 = 0.978, p < 0.001) (, 3A). COPD regression slope was significantly less than 1 (slope = 0.868, p = 0.007). Intercepts were 4.3 ± 2.8 W and 13.4 ± 11.6 W (SE) in COPD and HLTH, respectively. Mean differences between WR6-pred and WR6-true were only –3 ± 6 W and 4 ± 6 W for COPD and HLTH, respectively (; , 3B). Nevertheless, Bland–Altman analysis in COPD showed strong negative bias for WR6-pred, such that at higher work rates the prediction algorithm tended to underestimate WR6-true (), whereas there was no bias in HLTH (). In both groups, work rate predictions were normally distributed around WR6-true (, , 3C). Although mean differences between WR6-pred and WR6-true were similar in the two groups, the lower WRpeak in COPD meant that this difference represented a greater percentage error (4.0 ± 11.2 vs 1.3 ± 2.2% in COPD and HLTH respectively; ; p < 0.05).
Figure 2. Comparison between the predicted and measured values for the constant work rate that results in intolerance in 6 minutes (WR6) in the validation cohort of COPD patients. A) Regression between predicted WR6 (WR6-pred) and the true WR6 (WR6-true) determined from interpolation of the P-tlim relationship. Solid line is the linear regression and dashed line is the line of identity. B) Difference plot between WR6-pred and WR6-true. Note the small mean bias (–3.2 W; solid line), wide 95% confidence intervals (–14.7 to +8.4 W; short dash), and bias in the distribution (long dash). C) Frequency distribution for the difference between WR6-pred and WR6-true. The data are fit to a Gaussian distribution (solid line) and zero difference is indicated (vertical dash). D) Frequency distribution for the tlim at the WR6-pred. The data are fit to a Gaussian distribution (solid line) and the target 6 minutes is indicated (vertical dash).
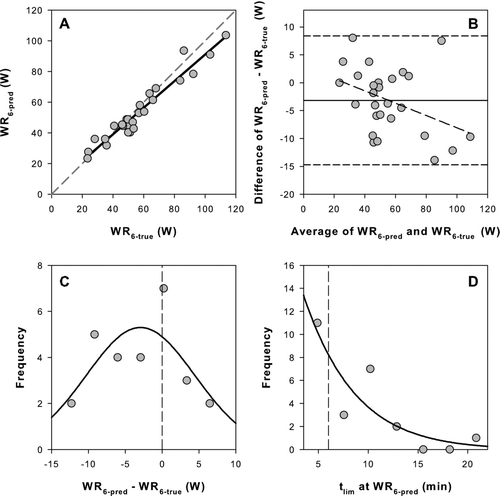
Figure 3. Comparison between the predicted and measured values for the constant work rate that results in intolerance in 6 minutes (WR6) in the validation cohort of healthy subjects (HLTH). A) Regression between predicted WR6 (WR6-pred) and the true WR6 (WR6-true) determined from interpolation of the P-tlim relationship. Solid line is the linear regression and dashed line is the line of identity. B) Difference plot between WR6-pred and WR6-true. Note the small mean bias (3.5 W; solid line), wide 95% confidence intervals (–8.8 to +15.8 W; short dash), and bias in the distribution (long dash). C) Frequency distribution for the difference between WR6-pred and WR6-true. The data are fit to a Gaussian distribution (solid line) and zero difference is indicated (vertical dash). D) Frequency distribution for the tlim at the WR6-pred. The data are fit to a Gaussian distribution (solid line) and the target 6 minutes is indicated (vertical dash).
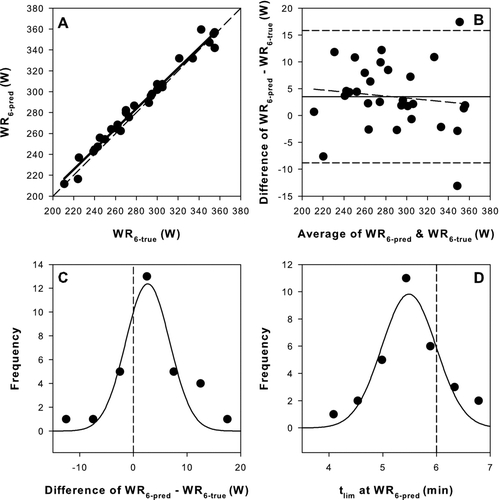
The ability of WR6-pred to yield a 6 min tlim was assessed using the individual P-tlim relationships in the validation group (). Three of 27 patients COPD had extreme calculated tlim values at WR6-pred. Two of these outlier tlim values were negative (–127 and –7 minutes, implying that the calculated WR6 was lower than the CP), and the other outlier was large and positive (68 minutes, representing that the calculated WR6 was only marginally above the actual CP). These three outliers were excluded for distribution analyses. Mean tlim at WR6-pred was significantly greater than 6 min in COPD (8.3 ± 4.1 min; p = 0.012), but less than 6 minutes in HLTH (5.5 ± 0.7 min; p < 0.001) (). Importantly, however, predicted tlim at WR6-pred was not normally distributed in COPD and ranged widely between 3.6 and 22.2 min (; ), whereas for HLTH tlim distribution was tightly and normally distributed about the mean (range 3.9 to 7.0 minutes; ; ).
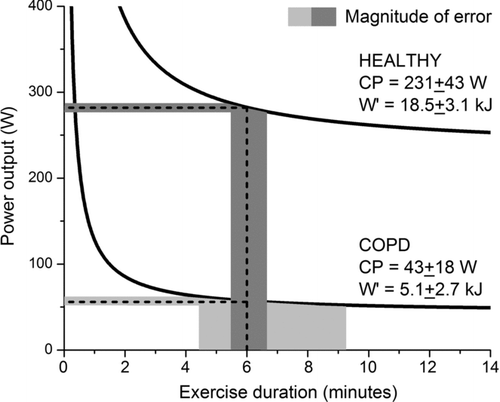
To help conceptualize the reason for the wide variation of tlim at the calculated WR6 in COPD, but not in health, we modeled both P-tlim curves using the mean CP and W′ values from the validation groups (). We superimposed on these curves, the range of tlim values that would be seen for a 5 W variation (the limit of resolution of some cycle ergometers) around the calculated WR6. Because of the steepness of the rectangular hyperbola in COPD patients, a consequence of the low W′, tlim variation is wide (between 4.4 and 9.3 minutes). In contrast, the larger W′ in the healthy subjects yields only a modest tlim variation (between 5.5 and 6.6 minutes).
Figure 4. An illustration of the magnitude of error in predicting exercise duration (tlim) for an assumed 5W error on WR6 prediction in healthy subjects and COPD patients. Power-duration (P-tlim) curve and WR6 estimates are based on the means of the two groups (). A 5W error in WR6 prediction in HLTH projects to a small variation in tlim (5.5 to 6.6 minutes; dark grey shading), whereas the same error in COPD projects to a large variation in tlim (4.4 to 9.3 minutes; light grey shading). The difficulty in estimating a common CWR duration for both groups is suggested to be markedly influenced by the very low curvature constant (W´) in COPD (5.1 ± 2.7 kJ) compared to HLTH (18.5 ± 3.1 kJ). The selection of a 5W error is based on the typical SEE for WR6 estimation using the P-tlim curve (range ∼1–7 W in this study). It is noted that, were the precision of WR6 estimation to be lower in COPD, then the wide tlim distribution would be exacerbated in patients compared to healthy subjects.
Discussion
This study's novel demonstration was the efficacy of WR6 prediction based only on variables established in ramp-incremental exercise testing (R2 = 0.937 and 0.978 in COPD and HLTH, respectively). Backward stepwise regression techniques determined that the only variable required for WR6 prediction was corrected WRpeak from the ramp-incremental. Importantly, however, despite these extremely tight limits of WR6 prediction, only in HLTH was the individual WR6-pred normally distributed around a tlim of ∼6 minutes. In COPD, WR6-pred based solely on ramp-incremental data resulted in a skewed distribution of tlim values from ∼3 min to >60 min.
The (in)efficacy of predicting tlim from WRpeak
Despite the common practice of assigning endurance testing work rates solely as a percentage of WRpeak, the finding that corrected WRpeak alone explains ∼95% of the variance for WR6 prediction should be highly unexpected, because of the widely variable relationship between CP and WRpeak. To our knowledge, the data presented here represent the largest collection of P-tlim derivations in humans; they demonstrate that CP as a percentage of WRpeak has a wide range in both healthy subjects (53–80%) and in patients with moderate to severe COPD (33–90%) (Citation13, Citation35). This finding alone should invalidate WR6 assignment based solely on corrected WRpeak.
The reason for the unexpectedly strong relationship between corrected WRpeak and WR6 lies in the shape of the P-tlim curve (Citation22). That is, tolerable durations of CWR exercise are far less sensitive to a given change in WR assignment at WR well above CP compared to WR near CP (). Also, for precisely the same reason, the WR6 prediction did not result in a narrow range of tolerable durations close to 6 min in COPD (unlike in HLTH): in COPD, interpolated tlim at WR6-pred ranged between 3 minutes and ‘infinity’. The relative error in WR6 estimation from corrected WRpeak (–21 to +29%; ) rendered the equation ineffective in consistently establishing tolerable duration among patients (). In less than 50% (13 of 27) of the COPD patients was the tlim for WR6-pred within the recommended 4–8 minute range. These data, therefore, identify a crucial flaw in basing the work rate for endurance testing on a fixed percentage of WRpeak in COPD.
The danger of selecting CWR for interventional studies in COPD based on WRpeak was suggested in data presented by O’Donnell et al. (Citation3), where CWR tests at 75% of WRpeak yielded tlim values considerably skewed towards long endurance times. Therefore, exercise endurance improvement from an intervention was also part of a skewed distribution, thereby complicating statistical comparisons of tlim improvement. This skewedness in COPD was confirmed in the present data, and is predictable based on P-tlim parameters. First, CP values in COPD are extremely low (43 W in COPD vs 236 W in HLTH). Standard cycle ergometers can deliver work rates within ∼5 W, which may be inadequate to accurately determine WR6 when CP is low. Secondly, W′ is extremely low in COPD (5.1 kJ COPD vs 18.5 kJ HLTH). This reduces the ‘buffer’ for errors in WR6 assignment, by steepening the rectangular hyperbola in COPD, and thus narrowing the work rate range that will result in 5–7 minute tolerable durations ( and ). Therefore, despite the high ability of corrected WRpeak predict WR6 in COPD (R2 = 0.958; ), this approach results in substantially inaccurate tlim normalization. This finding undermines endurance test work rate assignment in interventional studies based on percentages of WRpeak.
One can conceive of several methods to overcome this difficulty. The first is, naturally, to determine the P-tlim relationship in each subject. However, this requires multiple laboratory visits. A modification of this approach halves the number of laboratory visits by conducting two tests per visit (Citation35, Citation40). Post-intervention testing may be performed in a single visit by assuming that W′ is unchanged by the intervention (Citation9). However, this assumption's accuracy is questionable and depends on the intervention. A third approach employs a single-visit's tests to determine P-tlim parameters, but requires 3 min of sustained ‘all-out’ exercise eliciting VO2max within ∼30 seconds. This approach has been studied in healthy subjects (Citation19, Citation41), but may not be feasible in COPD patients or other clinical populations. A final strategy is to perform a CWR test based on a targeted fraction of the WRpeak and then, if the test duration falls outside a desired limit (e.g., 4–8 minutes), the measured tlim is used to select an adjusted work rate at which to repeat the test.
Comparison of WR6 prediction equations in health and disease
Regression equations in COPD and HLTH suggested that WR6 could be predicted from ∼85% and ∼94% corrected WRpeak respectively (both equations have very small intercepts). Considering that average ramp–incremental test duration is ∼10 minutes, and the WRslope correction applied (1 minute) is roughly equivalent to 10% of WRpeak, then the WR6 prediction was functionally ∼75% and ∼85% of WRpeak in COPD and HLTH, respectively. This is notable because several COPD clinical trials utilized 75% of WRpeak to assign CWR tests (Citation3). However, the present data demonstrates that in COPD individual variability in tlim is unacceptably wide using this approach.
It is interesting that the predictive equations were similar, despite the radically different physiological exercise limitations in the two groups. Neder et al. (Citation12) provided compelling evidence that attainment of very high VE (in relation to MVV) dictates tolerance limitation in COPD, suggesting that VE kinetics are integrally related to exercise intolerance in COPD. Similarly, Murgatroyd et al. (Citation42) showed that the rate of VO2max attainment [combining fundamental and slow kinetic VO2 components (3)] is the key tlim determinant in healthy subjects. The difference we observed in percentage of corrected WRpeak required for WR6 prediction between conditions presumably reflects differences in VE and VO2 kinetics between COPD and HLTH subjects. In health, VE kinetics are slower than VO2 kinetics, e.g. (Citation18). Additionally, COPD VE kinetics are slower compared to healthy subjects (Citation10, Citation18). Therefore, during ramp-incremental exercise VE lags farther behind the work rate increment than does VO2 in the healthy participants. This results in a larger difference in the relationships of VEpeak to WRpeak in COPD, than between VO2max and WRpeak in HLTH. These kinetic differences imply that WR6 should occur at a lower percentage of WRpeak in COPD than in HLTH, consistent with present findings.
Limitations
The suggestion that establishing P-tlim parameters provides a stronger foundation for endurance testing focused on determination of intervention efficacy depends on the P-tlim curve precision compared to other methods (e.g. the algorithms derived herein). However, precision of tlim estimates based on CP and W′ is not known in COPD. Direct comparison of the SEE of each individual's WR6 estimation derived using the P-tlim curve with the SEE of the group regression based on WRpeak in the present study suggests that the P-tlim curve should provide a superior measure. However, repeated CWR tests in comparison to the P-tlim curve will be required to establish the precision of WR6 estimation by this method in COPD. In addition, the algorithms that we have derived for WR6 prediction apply to the subject population studied: COPD men and women with predominantly moderate or severe obstruction and young healthy men with a fairly wide range of aerobic fitness. The algorithms may not apply to subject groups with differing characteristics.
Conclusions
This study demonstrates that although the CWR resulting in exercise intolerance in 6 minutes can be predicted from a suitably corrected peak work rate attained during a ramp-incremental test, in COPD patients the tlim associated with this work rate was highly variable. The wide variability in P-tlim parameter estimates among patients wholly undermines the ability for WR6 estimation to normalize exercise endurance in COPD using this approach and is reflective of very low CP and W′ values in these patients.
Declaration of Interest Statement
The Pulmonary Education and Research Foundation and BBSRC, UK (BB/I00162X/1) provided partial support for this study. HV, SM, HR, CC, RC, and JP have no financial or personal disclosures related to this research. The authors alone are responsible for the content and writing of the paper.
Acknowledgments
RC holds the Grancell/Burns Chair in the Rehabilitative Sciences.
References
- ATS/ACCP Statement on cardiopulmonary exercise testing. Am J Respir Crit Care Med. 2003; 167:211-277.
- Cooper CB, Celli BR, Jardim JR, Treadmill endurance during 2-year treatment with tiotropium in patients with COPD: A randomized trial. Chest 2013; 144:490–497.
- O’Donnell DE, Travers J, Webb KA, Reliability of ventilatory parameters during cycle ergometry in multicentre trials in COPD. Eur Respir J 2009; 34:866–874.
- Oga T, Nishimura K, Tsukino M, The effects of oxitropium bromide on exercise performance in patients with stable chronic obstructive pulmonary disease. A comparison of three different exercise tests. Am J Respir Crit Care Med 2000; 161:1897–1901.
- Vivodtzev I, Gagnon P, Pepin V, Physiological correlates of endurance time variability during constant-workrate cycling exercise in patients with COPD. PLoS One 2011; 6:e17007.
- Monod H, Scherrer J. The work capacity of a synergic muscular group. Ergonomics 1965; 8:329–338.
- Moritani T, Nagata A, deVries HA, Critical power as a measure of physical work capacity and anaerobic threshold. Ergonomics 1981; 24:339–350.
- Poole DC, Ward SA, Gardner GW, Metabolic and respiratory profile of the upper limit for prolonged exercise in man. Ergonomics 1988; 31:1265–1279.
- Whipp BJ, Ward SA. Quantifying intervention-related improvements in exercise tolerance. Eur Respir J 2009; 33:1254–1260.
- Casaburi R, Porszasz J, Burns MR, Physiologic benefits of exercise training in rehabilitation of patients with severe chronic obstructive pulmonary disease. Am J Respir Crit Care Med 1997; 155:1541–1551.
- Neder JA, Jones PW, Nery LE, The effect of age on the power/duration relationship and the intensity-domain limits in sedentary men. Eur J Appl Physiol 2000; 82:326–332.
- Neder JA, Jones PW, Nery LE, Determinants of the exercise endurance capacity in patients with chronic obstructive pulmonary disease. The power-duration relationship. Am J Respir Crit Care Med 2000; 162:497–504.
- Porszasz J, Rambod M, Casaburi R. Exercise endurance in severe COPD patients: The importance of the power-duration relationship. Eur Respir J 2010; 36:988S.
- Cooper CB, Abrazado M, Legg D, Development and implementation of treadmill exercise testing protocols in COPD. Int J Chron Obstruct Pulmon Dis 2010; 5:375–385.
- Casaburi R, Porszasz J. Constant work rate exercise testing: a tricky measure of exercise tolerance. COPD 2009; 6:317–319.
- Jones AM, Burnley M. Oxygen uptake kinetics: an underappreciated determinant of exercise performance. Int J Sports Physiol Perform 2009; 4:524–532.
- Hill DW, Poole DC, Smith JC. The relationship between power and the time to achieve O2max. Med Sci Sports Exerc 2002; 34:709–714.
- Nery LE, Wasserman K, Andrews JD, Ventilatory and gas exchange kinetics during exercise in chronic airways obstruction. J Appl Physiol 1982; 53:1594–1602.
- Dekerle J, Mucci P, Carter H. Influence of moderate hypoxia on tolerance to high-intensity exercise. Eur J Appl Physiol 2012; 112:327–335.
- Jenkins DG, Quigley BM. Endurance training enhances critical power. Med Sci Sports Exerc 1992; 24:1283–1289.
- Ozyener F, Rossiter HB, Ward SA, Influence of exercise intensity on the on- and off-transient kinetics of pulmonary oxygen uptake in humans. J Physiol 2001; 533:891–902.
- Vanhatalo A, Fulford J, DiMenna FJ, Influence of hyperoxia on muscle metabolic responses and the power-duration relationship during severe-intensity exercise in humans: a 31P magnetic resonance spectroscopy study. Exp Physiol 2010; 95:528–540..
- Bishop D, Jenkins DG. The influence of resistance training on the critical power function & time to fatigue at critical power. Aust J Sci Med Sport 1996; 28:101–105.
- Jenkins DG, Quigley BM. The influence of high-intensity exercise training on the Wlim-Tlim relationship. Med Sci Sports Exerc 1993; 25:275–282.
- Miura A, Kino F, Kajitani S, The effect of oral creatine supplementation on the curvature constant parameter of the power-duration curve for cycle ergometry in humans. Jpn J Physiol 1999; 49:169–174.
- Miura A, Sato H, Whipp BJ, The effect of glycogen depletion on the curvature constant parameter of the power-duration curve for cycle ergometry. Ergonomics 2000; 43:133–141.
- Palange P, Ward SA, Carlsen KH, Recommendations on the use of exercise testing in clinical practice. Eur Respir J 2007; 29:185–209.
- Troosters T, Vilaro J, Rabinovich R, Physiological responses to the 6-min walk test in patients with chronic obstructive pulmonary disease. Eur Respir J 2002; 20:564–569.
- Vogiatzis I, Nanas S, Roussos C. Interval training as an alternative modality to continuous exercise in patients with COPD. Eur Respir J 2002; 20:12–19.
- Revill SM, Morgan MD, Singh SJ, The endurance shuttle walk: a new field test for the assessment of endurance capacity in chronic obstructive pulmonary disease. Thorax 1999; 54:213–222.
- Macintyre N, Crapo RO, Viegi G, Standardisation of the single-breath determination of carbon monoxide uptake in the lung. Eur Respir J 2005; 26:720–735.
- Miller MR, Hankinson J, Brusasco V, Standardisation of spirometry. Eur Respir J 2005; 26:319–338.
- Wanger J, Clausen JL, Coates A, Standardisation of the measurement of lung volumes. Eur Respir J 2005; 26:511–522.
- Ferguson C, Rossiter HB, Whipp BJ, Effect of recovery duration from prior exhaustive exercise on the parameters of the power-duration relationship. J Appl Physiol 2010; 108:866–874.
- Porszasz J, Rambod M, van der Vaart H, Sinusoidal high-intensity exercise does not elicit ventilatory limitation in chronic obstructive pulmonary disease. Exp Physiol 2013; 98:1102–1114.
- Beaver WL, Wasserman K, Whipp BJ. A new method for detecting anaerobic threshold by gas exchange. J Appl Physiol 1986; 60:2020–2027.
- Sue DY, Wasserman K, Moricca RB, Metabolic acidosis during exercise in patients with chronic obstructive pulmonary disease. Use of the V-slope method for anaerobic threshold determination. Chest 1988; 94:931–938.
- Roston WL, Whipp BJ, Davis JA, Oxygen uptake kinetics and lactate concentration during exercise in humans. Am Rev Respir Dis 1987; 135:1080–1084.
- Bland JM, Altman DG. Statistical methods for assessing agreement between two methods of clinical measurement. Lancet 1986; 1:307–310.
- Malaguti C, Nery LE, Dal Corso S, Alternative strategies for exercise critical power estimation in patients with COPD. Eur J Appl Physiol 2006; 96:59–65.
- Vanhatalo A, Doust JH, Burnley M. Determination of critical power using a 3-min all-out cycling test. Med Sci Sports Exerc 2007; 39:548–555.
- Murgatroyd SR, Ferguson C, Ward SA, Pulmonary O2 uptake kinetics as a determinant of high-intensity exercise tolerance in humans. J Appl Physiol 2011; 110:1598–1606.