
Abstract
The study aimed to prospectively evaluate correlations between dynamic contrast-enhanced (DCE) MR perfusion imaging, pulmonary function tests (PFT) and volume quantitative CT in smokers with or without chronic obstructive pulmonary disease (COPD) and to determine the value of DCE-MR perfusion imaging and CT volumetric imaging on the assessment of smokers. According to the ATS/ERS guidelines, 51 male smokers were categorized into five groups: At risk for COPD (n = 8), mild COPD (n = 9), moderate COPD (n = 12), severe COPD (n = 10), and very severe COPD (n = 12). Maximum slope of increase (MSI), positive enhancement integral (PEI), etc. were obtained from MR perfusion data. The signal intensity ratio (RSI) of the PDs and normal lung was calculated (RSI = SIPD/SInormal). Total lung volume (TLV), total emphysema volume (TEV) and emphysema index (EI) were obtained from volumetric CT data. For “at risk for COPD,” the positive rate of PDs on MR perfusion images was higher than that of abnormal changes on non-enhanced CT images (p < 0.05). Moderate-to-strong positive correlations were found between all the PFT parameters and SIPD, or RSI (r range 0.445∼0.683, p ≤ 0.001). TEV and EI were negatively correlated better with FEV1/FVC than other PFT parameters (r range −0.48 –−0.63, p < 0.001). There were significant differences in RSI and SIPD between “at risk for COPD” and “very severe COPD,” and between “mild COPD” and “very severe COPD”. Thus, MR perfusion imaging may be a good approach to identify early evidence of COPD and may have potential to assist in classification of COPD.
Introduction
Chronic obstructive pulmonary disease (COPD), a common preventable and treatable disease, is characterized by persistent airflow limitation that is usually progressive and associated with an enhanced chronic inflammatory response in the airway and the lung to noxious particles or gases (Citation1). Across the world, cigarette smoking is the most commonly encountered risk factor for COPD (Citation1). According to the 50-year trends in smoking-related mortality in the United States, the mortality of COPD is in a continuing and unexplained increase (Citation2).
The pathological changes characteristic of COPD are found in the airways (bronchiectasis, bronchial wall thickening) and lung parenchyma (centrilobular, panacinar emphysema) (Citation3). The disease also affects the pulmonary arteries as represented by intimal thickening, smooth muscle hypertrophy and inflammation, which finally leads to vascular remodeling (Citation4). Intimal enlargement of pulmonary artery is an early change in COPD (Citation5).
It is reported that the enlargement of pulmonary artery is correlated with exacerbations of COPD (Citation6). In addition, the systemic effects of COPD are probably related to elastin loss, which would also affect vascular remodeling (Citation7). Therefore, comprehensive assessment of pulmonary morphological and functional information is essential for the diagnosis and characterization of COPD. The most commonly used clinical parameters for COPD assessment are pulmonary function tests (PFTs) due to the simplicity, repeatability, noninvasiveness and low cost (Citation8). However, PFTs are insensitive to early stages of COPD and detection of emphysema as a clinical routine.
In contrast to PFTs, computed tomography (CT) is a long-standing player for non-invasive static examination and quantization of lung parenchyma and airway (Citation8–12). Quantitative CT parameters of parenchyma destruction include the mean lung density (MLD), emphysema index (EI), low end percentiles, and so on (Citation9, Citation11). Although these quantitative parameters do not always correlate well with the severity of airflow limitation, the volumetric CT quantification of emphysema is a more reliable and repeatable method for COPD, which has been reported in numerous studies (Citation13–16).
Recently, for functional lung imaging in COPD, dual-energy CT could depict the regional alterations of lung perfusion in smokers with predominant emphysema (Citation17). Furthermore, MDCT regional perfusion could provide the parameters of pulmonary heterogeneity in emphysema susceptible smokers (Citation18). MR has the advantage of no ionizing radiation, which has been available for assessment of pulmonary perfusion using non-contrast-enhanced and contrast-enhanced perfusion techniques (Citation19–22).
Non-contrast-enhanced MR perfusion techniques include Fourier decomposition (FD) and arterial spin labeling (ASL). In comparison with non-contrast-enhanced MR perfusion techniques, dynamic contrast enhanced MR (DCE-MR) perfusion techniques are robust, broadly available, easily and quickly performed. Moreover, DCE-MRI has high spatial resolution and signal-to-noise ratio (Citation23), which has been shown to correlate well with radionuclide perfusion scintigraphy (Citation24–26).
The 3D MR-perfusion and 3D-HRCT showed a high lobar agreement between perfusion reduction and parenchymal destruction in patients with severe emphysema (Citation27). DCE-MR perfusion imaging allows for lobar/segmental and quantitative analysis in COPD (Citation28, 29), which can also provide more perfusion parameters, such as maximum slope of increase (MSI), maximum slope of decrease (MSD) and positive enhancement integral (PEI). MSI or MSD reflect arterial blood flow rate, and PEI reflects pulmonary blood volume (PBV).
The purpose of the study was to evaluate the correlations between PFT, CT volumetric parameters and DCE-MR perfusion parameters and to determine the value of DCE-MR perfusion imaging and CT volumetric imaging on the assessment of smokers.
Materials
Study subjects
A series of 55 consecutive male current and ex-smokers (age range 45–80 years) were enrolled in this prospective study. The inclusion criteria were based on the clinical findings and PFT results. Clinical findings included cough, sputum production, dyspnea and/or gasping, which lasted over 3 months per year in at least 2 consecutive years, and a smoking history more than 10 pack-years (PY). PFT diagnostic criteria for airway obstruction were based on the American Thoracic Society/European Respiratory Society (ATS/ERS) criteria: a ratio of forced expiratory volume in the first second (FEV1)/forced vital capacity (FVC) was below the fifth percentile of the predicted value (FEV1/FVC < 5th percentile) (Citation30, 31).
According to the ATS/ERS guidelines, the “at risk for COPD” (high-risk smokers) was defined as patients with a history of smoking and exposure to pollutants, have clinical symptoms, such as cough, sputum or dyspnea, but cannot be confirmed as COPD using spirometry (Citation32). Exclusion criteria were patients with thoracic cage deformity, history of pulmonary surgery, extended pulmonary infiltration, large amounts of pleural effusion, the presence of intrapulmonary tumors larger than 1.5 cm in diameter or other underlying diseases that may contribute to abnormal pulmonary function. All smokers were examined by PFT, CT and MRI within 48 hours. The study protocol was approved by the local ethics committee, and written informed consent was obtained for all smokers before inclusion in this study.
DCE-MR perfusion imaging
DCE-MR perfusion imaging was performed in all smokers using a clinical 1.5-T whole-body MR system (HDMR, GE Healthcare, Milwaukee, WI, USA) with a maximum gradient strength of 40 mT/m and a slew rate of 150T/(m.ms). For monitoring purposes, a respiratory excursion transducer was looped around the chest. Breath-hold training was carried out before each examination. The MRI was acquired at maximum inspiration breath-hold and the scan range extended from the ≠apices to the bases of the lung.
A time-resolution 3D gradient-echo pulse sequence (a GE product LAVA short for liver acquisition with volume acceleration) with parallel acquisition was used for DCE-MRI. The following imaging parameters were used: TR/TE: 3.2 ms/1.5 ms; flip angle: 12°; FOV: 35 cm ◊ 35 cm; matrix: 256 ◊ 160; bandwidth: 62.5 KHz; the number of slices: 28 and zero padded to 56 slices; thickness: 6 mm; NEX, 0.75; asset factor: 2; phases: 6; scan time, 4 seconds per phase. First, mask images with LAVA in a coronal orientation were scanned before injection of the contrast agent. Then, six phases of 3D coronal volume were acquired consecutively, starting 4 seconds after the injection. All injections were performed with an automatic power injector (Medrad, PA); 30 ml Gd-DTPA was injected, followed by 20 ml saline flush into the antecubital vein at a rate of 3 ml/s.
Image analysis of MR perfusion imaging
All examination raw data were transferred to a workstation (ADW 4.3; GE Healthcare, Milwaukee, WI, USA), and the analysis of the MR images was performed by one radiologist with 10 years of experience in pulmonary MRI. Mask images were subtracted from each phase for a pure perfusion image. Among the 6 phase images, the one that showed the peak enhancement of pulmonary parenchyma on the signal intensity-time curve was selected to evaluate perfusion.
First, the homogeneity of perfusion images was assessed. In the case of perfusion defects (PDs), the shape and distribution of these regions were evaluated according to the following standards. The shape was categorized into three types: wedge-shaped, circumscribed but not wedge-shaped, and patchy. The distribution was also classified into three types: upper, middle and lower field. The diffuse distribution was defined such that perfusion defects were found at least in two different fields. Second, three regions of interest (ROIs) about 100 mm2 were encircled from PDs and normal lung. These ROIs were adjusted to cover the lung parenchyma and exclude the large vessels as much as possible. Then, signal intensity of perfusion defects (SIPD) and signal intensity of normal lung perfusion (SInormal) were obtained by calculating the average signal intensity of these ROIs. In addition, the signal intensity ratio (RSI) of the PDs and normal lung was calculated (RSI = SIPD/SInormal).
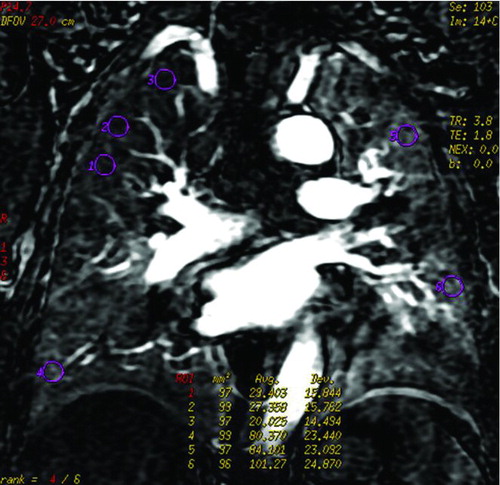
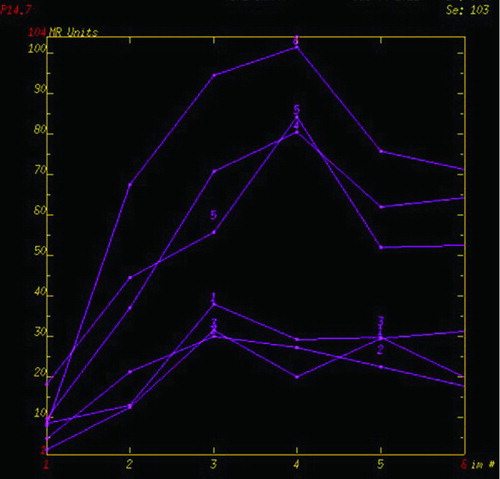
A representative measurement of the MRI parameters was shown in . The signal intensity time curve (STC) was derived, the DCE-MRI parameters of the perfusion defects and normal lung perfusion including MSI, PEI, MSD, and signal enhancement ratio (SER) were automatically generated by the commercial software based on the curve analysis model. According to this model, PEI represented the lung blood perfusion in the ROIs, which was obtained by calculating the area under STC. MSI (or MSD) could be computed by the formula: MSI or MSD = (SI2–SI1)/t, where SI2 and SI1 represented signal intensity at two different time points in increase (or decrease) STC with relative maximum ratio, respectively, and t represented time interval between the two time points. Signal enhancement ratio, is commonly defined as the ratio of late to early contrast enhancement, e.g., SER = (SI late post-SI pre)/(SI early post-SI pre).
Figure 1. An example of ROIs and signal intensity-time course curves () Coronal perfusion image of the pulmonary parenchyma acquired with DCE-MRI was heterogeneous. ROI 1, 2 and 3 represented perfusion defects, and ROI 4, 5 and 6 represented normal lung perfusion. () Signal intensity-time curves of these ROIs showed maximum signal intensity of the perfusion defects were lower than that of normal lung.
CT volumetric imaging
All CT scanning of the chest was performed at end-maximum inspiration in a supine position using a 256-slice Brilliance iCT scanner (Philips Healthcare, Cleveland, OH, USA). The CT scan was also acquired at maximum inspiration breath-hold, the same lung inflation volume and scan range that were used in MR imaging. The following imaging parameters were used:120 kV; 250 mAs; slice thickness, 1 mm; collimation 128 ◊ 0.625 mm; rotation time, 0.5 seconds; pitch, 0.915:1; and velocity of 146.4 mm/s. No intravenous contrast medium was administered.
Image analysis of CT
All raw images were transferred to a workstation (Extended Brilliance Workspace TM, Philips Healthcare, Cleveland, OH, USA) and the quantification of total lung and emphysema volume was performed with the tissue segmentation part by two thoracic MR radiologists with 15 and 12 years’ experience. The final quantitative results were the average of the two radiologists’ measurements. An emphysematous parenchyma was defined as the threshold of lung area with attenuation lower than −950 Hounsfield units (HU). For quantitative assessment of emphysema, the 3D volumes of the emphysema were displayed using a window width of 50 HU and a window level of −975 HU.
Then the total emphysema volume (TEV) was acquired by manual removal of the trachea, mainstem bronchi, and gastrointestinal structures. The total lung volume (TLV) was calculated automatically by the machine. EI was the ratio of TEV to TLV. EI < 5%, 5% ≤ EI <15%, EI ≥ 15% was defined as no obvious emphysema, mild emphysema and apparent emphysema, respectively. Also, non-enhanced CT lung images were observed at window level –450HU and window width 1500HU.
Pulmonary function tests
PFT was performed using a spirometer (MasterScreen Body; E. Jaeger; Hoechberg, Germany) according to the American Thoracic Society guidelines (Citation33). The following values were evaluated: the forced expiratory volume in 1 second (FEV1); FEV1 % predicted (%FEV1); the forced vital capacity (FVC); ratio of FEV1 to FVC (FEV1/FVC); maximum expiratory flow 25% of FVC (MEF25). The smokers were classified into five groups using ATS–ERS guidelines: “At Risk for COPD”, “Mild COPD,” “Moderate COPD,” “Severe COPD,” and “Very severe COPD” (Citation32).
Statistical analysis
Statistical analysis was performed with SPSS 18.0 software (SPSS Inc, Chicago, IL, USA). The results were expressed as mean ± SD. ANOVA and Bonferroni methods were used in terms of normal distribution measurement data; otherwise, statistics were analyzed using the Kruskal–Wallis method and Mann–Whitney test. Spearman correlation analysis was used to evaluate the correlation between each MRI perfusion parameter and quantitative CT parameters and PFT values. For enumeration data, Fisher's exact test was used.
Results
Study population
Of 55 male smokers recruited, 4 were excluded from the statistical analysis due to intrapulmonary tumors larger than 1.5 cm in diameter (2 patients) and claustrophobia failed to perform MR scanning (2 patients). Therefore, only 51 male smokers (age range 45–80 years, mean age 65 years) were analyzed in the prospective study. Their median smoking history was 38.75 PY (range 10–200 PY). Their mean body mass index was 22.57 ± 3.46 kg/m2.
Characteristics features of MR perfusion imaging and CT volumetric imaging in all smokers
According to the ATS–ERS guidelines, 8 smokers were high-risk smokers. Various imaging findings on non-enhanced CT were found among all the high-risk smokers: emphysema (n = 2), airway abnormal (n = 1) and no obvious abnormal changes (n = 5). However, all the high-risk smokers showed different extents of decreased perfusion and had focal PDs on MR perfusion images (). Thus, the positive rate of PDs on MR perfusion images for the high-risk smokers (8/8) was higher than that of abnormal changes on non-enhanced CT images (3/8) (p = 0.026). In addition, for all subjects, the positive rate of PDs on MR perfusion images (51/51) was higher than that of abnormal changes on CT images (42/51) (p = 0.003); (see ).
Figure 2. A 53-year-old male with “risk for COPD” (smoking index 20 pack-years, FEV1/FVC%, 85.77%; %FEV1, 113.5%). () Quantitative computed tomography (CT) in coronal plane shows normal lung as gray scale and small emphysema (threshold lower than −950HU) as blue. (–) coronal perfusion image acquired with DCE-MRI shows circumscribed but not wedge-shaped perfusion defects in the left upper field.
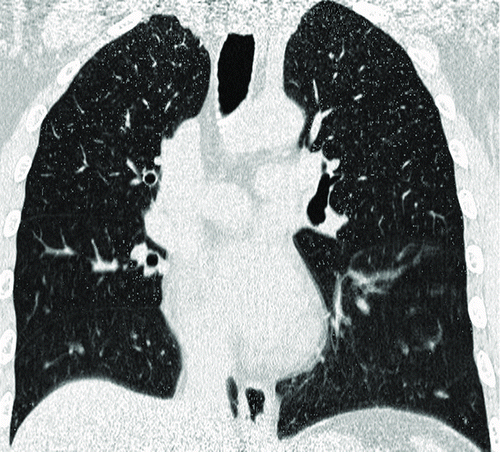
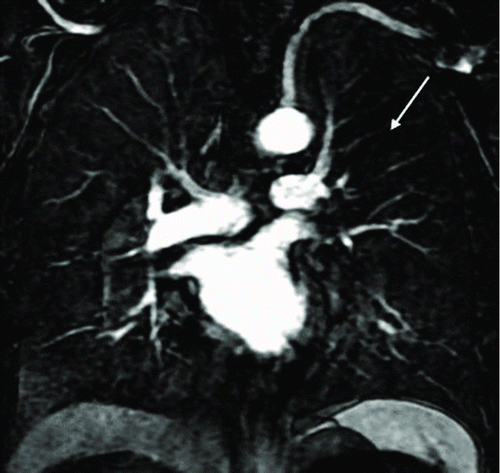
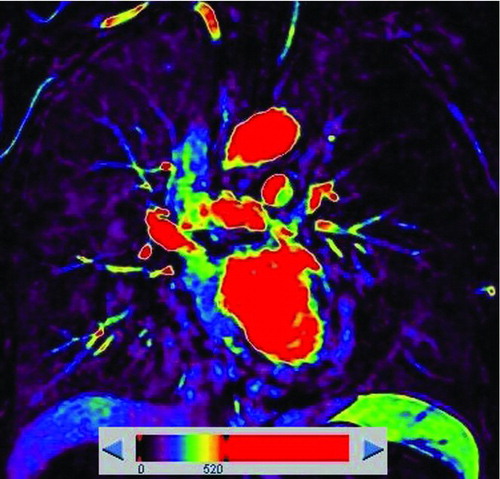
Table 1. Positive rates of perfusion defects in MR perfusion images and abnormal changes in CT images for all subjects and for all stages of COPD
The remaining 43 subjects were smoking-related COPD patients. According to the EI, patients showed no obvious emphysema (n = 10), mild emphysema (n = 13) and apparent emphysema (n = 20) on CT images. Perfusion images of these COPD patients were heterogeneous, and appeared as patchy or circumscribed PDs without wedge-shaped PDs. For the mild emphysema patients, 2 patients showed located emphysematous destruction on non-enhanced CT lung images, and more PDs on perfusion images, except for the PDs on the corresponding emphysema regions (). Therefore, on a per-patient base, the positive rate of PDs on MR perfusion images (23/23) was higher than that of emphysema on CT (13/23) in smoking-related COPD patients without apparent emphysema (P = 0.001). For the apparent emphysema patients, the distribution of emphysema on CT images was in accordance with that of PDs on MR perfusion images (). Detailed characteristics of smoking-related COPD at different emphysema extent were shown in .
Figure 3. A 76-year-old male with “mild COPD” (smoking index 50 pack-years, FEV1/FVC%, 69.57%; % FEV1, 83.1%). () Coronal non-enhanced CT shows located emphysematous regions in both upper lung fields and right lower lung field. (–) Coronal perfusion image acquired with DCE-MRI shows multiple patchy perfusion defects in left upper and lower lung fields, except for the perfusion defects on the corresponding emphysema regions.
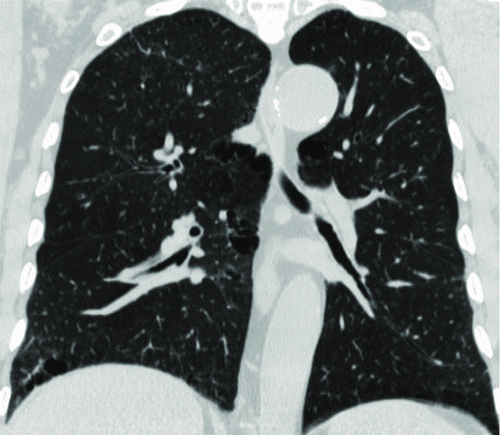
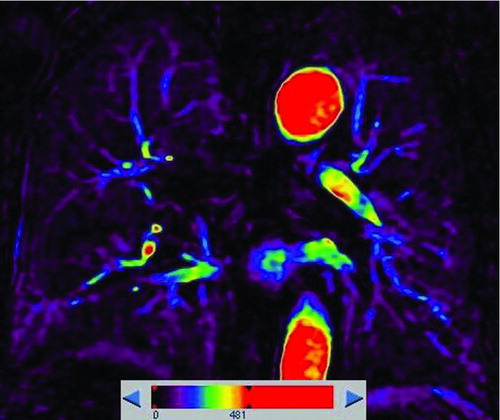
Figure 4. A 72-year-old man with “moderate COPD” (smoking index 20 pack-years, FEV1/FVC%, 56.2%; % FEV1, 53.26%). () Coronal non-enhanced CT shows normal lung as gray scale and diffuse emphysema (threshold lower than −950HU) as blue, both upper-middle fields predominant distribution. (, ) Coronal perfusion image acquired with DCE-MRI shows diffuse patchy perfusion defects in both lungs. And the distribution of emphysema was accordance with the PDs.
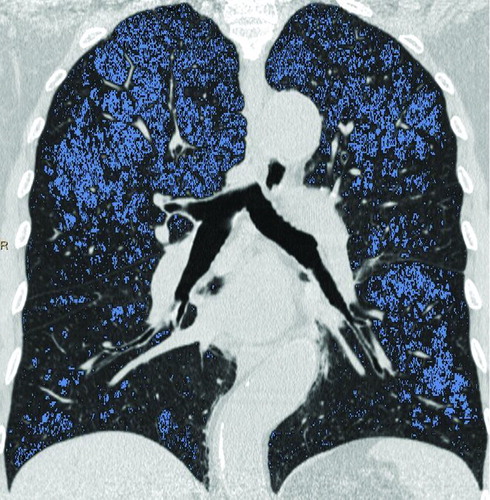
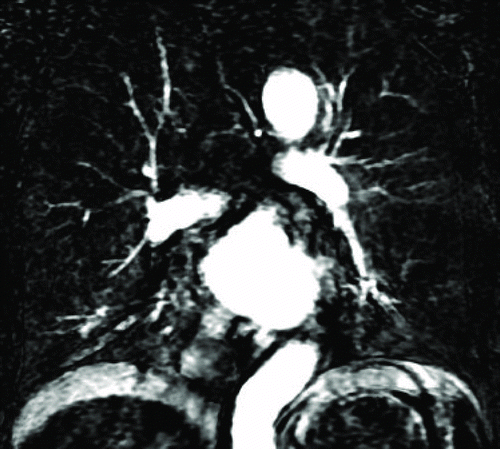
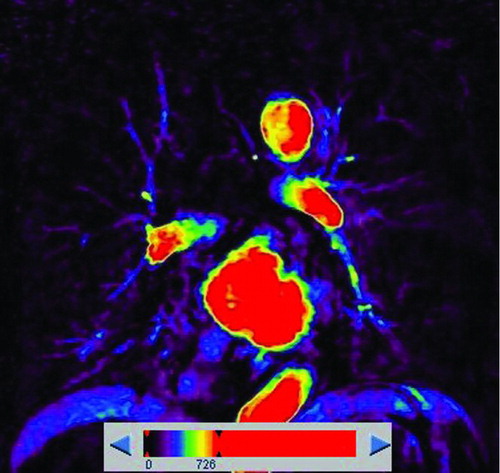
Table 2. Clinical data, MR perfusion and PFT parameters of Smoking-related COPD (n = 43) with different extent of emphysema
In terms of the distribution of PDs, there were 22 smokers with upper-field (43%, 22/51), 2 with middle-field (4%, 2/51), 2 with lower-field (4%, 2/51) and 25 with diffuse distribution (49%, 25/51). Therefore, the distribution of PDs mainly appeared as diffuse and upper-field. Significant differences were found in EI (6.6 ± 5.9 VS. 14.1 ± 7.8, p = 0.001) and TEV (0.3 ± 0.4 VS. 0.8 ± 0.5, p = 0.002) between smokers with PDs in upper-field and smokers with diffuse PDs.
Correlation analysis between PFT, MR perfusion and CT volume quantitative parameters in all smokers
Moderate-to-strong positive correlations were found between all the PFT parameters (FEV1, % FEV1, FVC, FEV1/FVC, MEF25, %MEF25) and SIPD, or RSI (r range 0.445∼ 0.683, p ≤ 0.001) in all smokers (). Among them, the correlations between%FEV1 and RSI (r = 0.653, p < 0.001), between%FEV1 and SIPD(r = 0.646, p < 0.001) were positively moderate. Besides, the FEV1 values were also moderately correlated with RSI and SIPD, respectively (r = 0.683, 0.677, p < 0.001). Other MR perfusion parameters, such as MSI, PEI and MSD, were statistically correlated with PFT values (p < 0.05), but the correlation was weak (r range 0.301–0.506). Moreover, no correlations were found between SER and any PFT parameters (p > 0.05).
Table 3. Correlation between PFT and MR perfusion parameters and HRCT volumetric parameters in all smokers
All the PFT values were negatively correlated with TEV and EI (r range −0.48–−0.63, p < 0.001). Among them, the correlations between FEV1/FVC and TEV (r = −0.613, p < 0.001), between FEV1/FVC and EI (r = −0.63, P < 0.001) were relatively well ().
Comparisons of MR perfusion and CT volumetric parameters in all smokers with different stages
According to the ATS–ERS guidelines, the 51 smokers in our prospective study were categorized into 5 stages: at risk for COPD (n = 8), mild COPD (n = 9), moderate COPD (n = 12), severe COPD (n = 10), and very severe COPD (n = 12). The RSI or EI of “at risk for COPD” or “mild COPD” showed significant differences from that of “severe COPD” or “very severe COPD” (p < 0.05). Moreover, the RSI or EI of “very severe COPD” was different from that of “moderate COPD” (p < 0.05). There were significant differences in SIPD between “at-risk for COPD” and “very severe COPD,” and between “mild COPD” and “very severe COPD” ().
Table 4. Comparison of PFTs, HRCT volumetric parameters and MRI perfusion parameters among smokers at different stages
Discussion
CT perfusion imaging has been used increasingly to assess the perfusion defects for the suspected pulmonary embolism and emphysema patients (Citation17, 18, and Citation34). However, there are mainly two limitations in CT perfusion techniques: the large X-ray dose and the need for a large load of CT contrast agent. Taking the relative safety into consideration, several MR imaging techniques have high diagnostic accuracy for detecting perfusion abnormalities in various lung disorders (Citation26, Citation35). At present, FD is a new and developing technique, which has been applied in the validation, reproducibility, and the correlations with SPECT/CT in young cystic fibrosis patients, healthy volunteers and porcine, respectively (Citation20–22). ASL with different sequences has been reported in the assessment of pulmonary perfusion (Citation36, 37).
Our previous studies have showed ASL can obtain the similar functional information in comparison with DEC-MRI (Citation35). However, both FD and ASL are mainly used in healthy volunteers. Their values on the assessment of COPD have not been explored thoroughly. Based on our previous studies using DCE-MRI (Citation28, Citation35), we found DCE-MR perfusion imaging not only allowed for the assessment of regional pulmonary parenchyma perfusion but also correlated closely with PFT for all smokers.
Cigarette smoking can cause endothelial dysfunction in pulmonary vessels, which is associated with the impairment of the vessel's structure and function (Citation38, 39). Under the chronic stress of cigarette smoking, alveoli may be destroyed, resulting in emphysema (Citation6, Citation40, Citation41). MR perfusion imaging was more sensitive than CT to find early abnormal changes of the lung for “At risk for COPD” smokers, which suggested that MR perfusion imaging may be a good approach to identify early evidence of COPD.
In COPD patients, reduced ventilation due to airway obstruction and parenchyma destruction would result in hypoxic vasoconstriction and further lead to local pulmonary blood flow reduction. The reduction of the pulmonary vascular bed and mechanical vascular compression by the hyper-inflated lungs also contributes to the reduced perfusion. All the COPD patients showed circumscribed but not wedge-shaped or diffuse patchy PDs. These perfusion manifestation was in accordance with previous study by Bauer et al. (Citation34), who revealed that a circumscribed but not wedge-shaped PD was associated with fluid collections in the interstitial, alveolar or pleural space followed by tumors and located bullae; a patchy PD pattern was most commonly associated with emphysematous or fibrotic changes followed by fluid collections in the interstitial or alveolar space.
The reduction of the pulmonary vascular bed is related to the severity of parenchyma destruction (Citation42, 43). In the present study, 20 COPD patients with apparent emphysema on CT images showed PDs with the same distribution, which resulted from the pulmonary parenchyma destruction and the reduction of the pulmonary vascular bed. Previous studies have also shown the same findings: regional emphysema heterogeneity on CT matched with the decreased perfusion on MR (Citation27, Citation29). Ten COPD patients with PDs showed no obvious emphysema on CT volumetric quantization. The phenomena may be explained by another factor of airflow limitation, which is small airway remodeling.
This suggested that the principal cause of perfusion defects in advanced emphysema may be the loss of elastic recoil, while small airway remodeling predominates for these in absence of obvious emphysema. Airway obstruction severity of COPD patients with emphysema was greater than that of patients without emphysema. The upper-field distribution of PDs was less than diffuse distribution. This finding may be associated with the centrilobular emphysema in its mild form, more frequently in the upper zones (Citation4).
Moreover, positively moderate correlations were detected between%FEV1 and RSI and between%FEV1 and SIPD. Therefore, we speculated that MR perfusion parameters (e.g., RSI) have the potential to assess the severity of airway obstruction. In addition, showed that there were significant differences in both RSI and EI between “at risk for COPD” and “severe COPD,” between “mild COPD” and “severe COPD,” and between “moderate COPD” and “very severe COPD”. Thus, the RSI and EI can evaluate the severity of COPD to a certain extent.
To measure and quantitate the pulmonary perfusion, many perfusion parameters are applied, such as pulmonary blood flow (PBF), mean transit time (MTT), and PBV. A quantitative evaluation of 3D MR pulmonary perfusion showed diffusely decreased PBF, MTT and PBV in COPD patients (Citation25). These perfusion parameters are based on the application of the central volume principle and indicator dilution theory. There are several limitations related to its fundamental basis in the quantification of pulmonary perfusion (Citation25, Citation35).
According to previous studies (Citation28, Citation35), another simple method of pulmonary perfusion quantification is to evaluate the signal intensity difference ratio (RSI) between the perfusion abnormalities and the normal lung. Thus, the latter simple method was used for pulmonary perfusion quantification in this study. Moreover, DCE-MR was applied to acquire perfusion images. Based on the dynamic contrast-enhanced analysis software, the following parameters MSI, PEI, MSD and SER were also acquired to evaluate the hemodynamic changes. There was positive correlation between MR perfusion parameters (except for SER) and PFT values in this study. These findings were consistent with the correlation between PBF, PBV with PFT values: PBF (r = 0.49, p = 0.044), PBV (r = 0.69, p = 0.006) were positively correlated with FEV1/FVC (29).
New developments in CT technology have made it possible to acquire volumetric data sets that can be used to quantitate the extent of emphysema (Citation44). In present study, the threshold of emphysematous parenchyma was defined as the lung area with attenuation value lower than −950 HU at inspiration, because previous studies (Citation45, 46) have demonstrated that the threshold of −950 HU at full inspiration on HRCT scans is well correlated with pathology. According to , TEV and EI were negatively and moderately correlated with all PFT values. These findings were similar to previous studies (Citation47, 48), but a recent study by Pauls et al. (Citation14) showed that TLV acquired by MDCT was correlated with total lung capacity (TLC), and TLV could effectively assess the severity of COPD patients according to the GOLD classification.
There are some limitations in this study suggesting further investigation. First, due to the smoking history requirements, only men were included in the study. In the future, female patients should also be included. Second, CT volume qualitative analysis requires a semi-automatic method using manual extraction of the tracheobronchial tree and esophagus, but they could not be extracted thoroughly in some cases, leading to overestimation of emphysema. Third, in terms of DCE-MR perfusion, the dosage of contrast agent was identical for all the patients without taking the individual body mass index (BMI) into consideration; and the scanning time after injection of contrast agent was identical regardless of their cardiac output. Fourth, the position of emphysema and PDs was based on the lung field, not on the lung lobe level. Finally, the sample size of each stage of COPD patients was relatively small.
In conclusion, MR perfusion imaging may be a good approach to identify early evidence of COPD due to the higher positive rate of PDs than that of emphysema in the high-risk smokers and COPD patients without apparent emphysema. MR perfusion parameters correlated moderately with PFT parameters; RSI and SIPD can also evaluate the severity of COPD to a certain extent, suggesting MR perfusion may have the potential to assist in classification of COPD.
Declaration of Interest Statement
The authors have no actual or potential conflict of interest to declare. The authors alone are responsible for the content and writing of the paper.
The authors would like to thank the National Natural Science Foundation of China (81370035, 81230030 and 81000602) and major projects of Biomedicine Department of Shanghai Science and Technology Commission (13411950100) for the financial support.
Acknowledgments
Authors Xia and Guan contributed equally to this article.
References
- Global Initiative for Chronic Obstructive Lung Disease (GOLD). Global Strategy for the Diagnosis, Management and Prevention of COPD. 2013. Available from: http://www.goldcopd.org/ (accessed February 2013).
- Thun MJ, Carter BD, Feskanich D, 50-year trends in smoking-related mortality in the United States. N Engl J Med 2013; 368:351–364.
- Hogg JC. Pathophysiology of airflow limitation in chronic obstructive pulmonary disease. Lancet 2004; 364:709–721.
- Szilasi M, Dolinay T, Nemes Z, Strausz J. Pathology of chronic obstructive pulmonary disease. Pathol Oncol Res 2006; 12:52–60.
- Chaouat A, Naeije R, Weitzenblum E. Pulmonary hypertension in COPD. Eur Respir J 2008; 32:1371–1385.
- Wells JM, Washko GR, Han MK, Pulmonary arterial enlargement and acute exacerbations of COPD. N Engl J Med 2012; 367:913–921.
- Maclay JD, McAllister DA, Rabinovich R, Systemic elastin degradation in chronic obstructive pulmonary disease. Thorax 2012; 67:606–612.
- Ley-Zaporozhan J, van Beek EJ. Imaging phenotypes of chronic obstructive pulmonary disease. J Magn Reson Imaging 2010; 32: 1340–1352.
- Matsuoka S, Yamashiro T, Washko GR, Quantitative CT assessment of chronic obstructive pulmonary disease. Radiographics 2010; 30:55–66.
- Ley-Zaporozhan J, Ley S, Eberhardt R, Visualization of morphological parenchymal changes in emphysema: comparison of different MRI sequences to 3D-HRCT. Eur J Radiol 2010; 73:43–49.
- Akira M, Toyokawa K, Inoue Y, Quantitative CT in chronic obstructive pulmonary disease: inspiratory and expiratory assessment. AJR Am J Roentgenol. 2009; 192:267–272.
- Ley-Zaporozhan J, Ley S, Kauczor HU. Morphological and functional imaging in COPD with CT and MRI: present and future. Eur Radiol. 2008; 18:510–521.
- Kim SS, Seo JB, Lee HY, Chronic obstructive pulmonary disease: lobe-based visual assessment of volumetric CT by Using standard images–comparison with quantitative CT and pulmonary function test in the COPDGene study. Radiology 2013; 266:626–635.
- Pauls S, Gulkin D, Feuerlein S, Assessment of COPD severity by computed tomography: correlation with lung functional testing. Clin Imag 2010; 34:172–178.
- Heussel CP, Herth FJ, Kappes J, Fully automatic quantitative assessment of emphysema in computed tomography: comparison with pulmonary function testing and normal values. Eur Radiol 2009; 19:2391–2402.
- Revel MP, Faivre JB, Remy-Jardin M, Automated lobar quantification of emphysema in patients with severe COPD. Eur Radiol 2008; 18:2723–2730.
- Pansini V, Remy-Jardin M, Faivre JB, Assessment of lobar perfusion in smokers according to the presence and severity of emphysema: preliminary experience with dual-energy CT angiography. Eur Radiol 2009; 19:2834–2843.
- Alford SK, van Beek EJ, McLennan G, Heterogeneity of pulmonary perfusion as a mechanistic image-based phenotype in emphysema susceptible smokers. Proc Natl Acad Sci USA 2010; 107:7485–7490.
- Hopkins SR, Prisk GK. Lung perfusion measured using magnetic resonance imaging: New tools for physiological insights into the pulmonary circulation. J Magn Reson Imaging.2010; 32:1287–1301.
- Bauman G1, Puderbach M, Heimann T, Validation of Fourier decomposition MRI with dynamic contrast-enhanced MRI using visual and automated scoring of pulmonary perfusion in young cystic fibrosis patients. Eur J Radiol 2013; 82(12):2371–2377.
- Lederlin M1, Bauman G, Eichinger M, Functional MRI using Fourier decomposition of lung signal: Reproducibility of ventilation- and perfusion-weighted imaging in healthy volunteers. Eur J Radiol 2013; 82(6):1015–1022.
- Bauman G1, Lützen U, Ullrich M, Pulmonary functional imaging: qualitative comparison of fourier decomposition MR imaging with SPECT/CT in porcine lung. Radiology 2011; 260(2):551–559.
- Ley S, Ley-Zaporozhan J. Pulmonary perfusion imaging using MRI: clinical application. Insights Imag 2012; 3:61–71.
- Yilmaz E, Akkoclu A, Degirmenci B, Accuracy and feasibility of dynamic contrast-enhanced 3D MR imaging in the assessment of lung perfusion: comparison with Tc-99 MAA perfusion scintigraphy. Clin Radiol 2005; 60: 905–913.
- Ohno Y, Hatabu H, Murase K, Quantitative assessment of regional pulmonary perfusion in the entire lung using three-dimensional ultrafast dynamic contrast-enhanced magnetic resonance imaging: Preliminary experience in 40 subjects. J Magn Reson Imag 2004; 20:353–365.
- Fink C, Puderbach M, Bock M, Regional lung perfusion: assessment with partially parallel three-dimensional MR imaging. Radiology 2004; 231:175–184.
- Ley-Zaporozhan J, Ley S, Eberhardt R, Assessment of the relationship between lung parenchymal destruction and impaired pulmonary perfusion on a lobar level in patients with emphysema. Eur J Radiol. 2007 Jul; 63: 76–83.
- Fan L, Xia Y, Guan Y, Capability of differentiating smokers with normal pulmonary function from COPD patients: a comparison of CT pulmonary volume analysis and MR perfusion imaging. Eur Radiol. 2013 May; 23:1234-1241.
- Jang YM, Oh YM, Seo JB, Quantitatively assessed dynamic contrast-enhanced magnetic resonance imaging in patients with chronic obstructive pulmonary disease: correlation of perfusion parameters with pulmonary function test and quantitative computed tomography. Invest Radiol. 2008; 43:403–410.
- Pellegrino R1, Viegi G, Brusasco V, Interpretative strategies for lung function tests. Eur Respir J 2005; 26:948–968.
- Hansen JE1, Sun XG, Wasserman K. Spirometric criteria for airway obstruction: Use percentage of FEV1/FVC ratio below the fifth percentile, not < 70%. Chest 2007; 131:349–55.
- Celli BR, MacNee W. Standards for the diagnosis and treatment of patients with COPD: A summary of the ATS/ERS position paper. Eur Respir J 2004; 23:932–946.
- Miller MR, Hankinson J, Brusasco V, Standardisation of spirometry. Eur Respir J 2005; 26:319–338.
- Bauer RW, Kerl JM, Weber E, Lung perfusion analysis with dual energy CT in patients with suspected pulmonary embolism–influence of window settings on the diagnosis of underlying pathologies of perfusion defects. Eur J Radiol 2011; 80:e476–e482.
- Fan L, Liu SY, Sun F, Xiao XS. Assessment of pulmonary parenchyma perfusion with FAIR in comparison with DCE-MRI–initial results. Eur J Radiol 2009; 70:41–48.
- Henderson AC1, Prisk GK, Levin DL, Characterizing pulmonary blood flow distribution measured using arterial spin labeling. NMR Biomed 2009; 22:1025–1035.
- Schraml CL, Schwenzer NF, Martirosian P, Non-invasive pulmonary perfusion assessment in young patients with cystic fibrosis using an arterial spin labeling MR technique at 1.5 T. MAGMA. 2012; 25:155–162.
- Santos S, Peinado VI, Ramirez J, Enhanced expression of vascular endothelial growth factor in pulmonary arteries of smokers and patients with moderate chronic obstructive pulmonary disease. Am J Respir Crit Care Med 2003; 167:1250–1256.
- Peinado VI, Barbera JA, Abate P, Inflammatory reaction in pulmonary muscular arteries of patients with mild chronic obstructive pulmonary disease. Am J Respir Crit Care Med 1999; 159:1605–1611.
- Abboud RT, Vimalanathan S. Pathogenesis of COPD. Part I. The role of protease-antiprotease imbalance in emphysema. Int J Tuberc Lung Dis 2008; 12:361–336.
- Hogg JC, Senior RM. Chronic obstructive pulmonary disease - part 2: pathology and biochemistry of emphysema. Thorax 2002; 57:830–834.
- Thabut G, Dauriat G, Stern JB, Pulmonary hemodynamics in advanced COPD candidates for lung volume reduction surgery or lung transplantation. Chest 2005; 127:1531–1536.
- Morino S, Toba T, Araki M, Noninvasive assessment of pulmonary emphysema using dynamic contrast-enhanced magnetic resonance imaging. Exp Lung Res 2006; 32:55–67.
- Zaporozhan J, Ley S, Eberhardt R, Paired inspiratory/expiratory volumetric thin-slice CT scan for emphysema analysis: comparison of different quantitative evaluations and pulmonary function test. Chest 2005; 128:3212–3220.
- Gevenois PA, De Vuyst P, de Maertelaer V, Comparison of computed density and microscopic morphometry in pulmonary emphysema. Am J Respir Crit Care Med 1996; 154:187–192.
- Gevenois PA, de Maertelaer V, De Vuyst P, Comparison of computed density and macroscopic morphometry in pulmonary emphysema. Am J Respir Crit Care Med 1995; 152:653–657.
- Aziz ZA, Wells AU, Desai SR, Functional impairment in emphysema: contribution of airway abnormalities and distribution of parenchymal disease. Am J Roentgenol 2005; 185:1509–1515.
- Cerveri I, Dore R, Corsico A, Assessment of emphysema in COPD: a functional and radiologic study. Chest 2004; 125:1714–1718.