
Abstract
Pulmonary vascular disease is a common complication of chronic obstructive pulmonary disease (COPD), and an important risk factor for COPD exacerbations and death. We explored the relationship between pulmonary artery volumes measured using thoracic computed tomography (CT) and lung structure-function measured using spirometry, CT and magnetic resonance imaging (MRI) in 124 ex-smokers with (n = 68) and without (n = 56) airflow obstruction, and a control group of 35 never-smokers. We observed significantly greater main (p = .01), right (p = .001) and total (p = .003) pulmonary artery volumes in ex-smokers with airflow obstruction as compared to ex-smokers without airflow obstruction. There were also significantly greater pulmonary artery volumes in both ex-smoker subgroups, compared to the never-smoker subgroup (p = .008). For all participants, there were significant correlations for pulmonary artery volumes with the ratio of the forced expiratory volume in 1 s to forced vital capacity (FEV1/FVC), the diffusing capacity of the lung for carbon monoxide (DLCO%pred), airway count, MRI ventilation defect percent and MRI apparent diffusion coefficients. In ex-smokers, ventilation defect percent was significantly correlated with right (r = 0.27, p = .02) and total (r = 0.25, p = .03) pulmonary artery volumes. Multivariate zero-inflated Poisson regression analysis showed that FEV1%pred (p = .004), DLCO%pred (p = .03), the six minute walk distance (p = .04) and total pulmonary artery volume (p = .03) were significant predictors of acute exacerbations of COPD, while the number of previous exacerbations was not. In conclusion, pulmonary artery enlargement measured using thoracic CT was observed even in ex-smokers without airflow obstruction and was predictive of COPD exacerbations in ex-smokers with airflow obstruction.
Introduction
Chronic obstructive pulmonary disease (COPD) is the fourth leading cause of death in the United States and estimates predict that in 2020, COPD will be the third-leading cause of death worldwide (Citation1). In COPD patients, chronic lung inflammation and tissue destruction are the result of long-term inhalation of toxins, mainly tobacco smoke (Citation2), leading to the accelerated loss of lung function (Citation3), reduced quality-of-life, and premature death (Citation4). As the disease progresses, patients with moderate-to-severe disease are more likely to experience acute exacerbations (Citation5) that often result in hospital admission, placing a large burden on patients, their care-givers and the healthcare system (Citation6).
Although a hallmark diagnostic of COPD is airflow obstruction measured using spirometry, COPD is also associated with vascular abnormalities including coronary vascular and cerebrovascular disease (Citation7–Citation10) and pulmonary artery abnormalities (Citation3). Importantly, vascular disease is the single largest cause of hospitalization in COPD patients with mild-moderate disease and after lung cancer, the leading cause of death (Citation11, Citation12). There is a dose-response relationship for pulmonary structure-function abnormalities with carotid atherosclerosis (Citation13–Citation18), coronary artery calcification (Citation7–10) and vascular dysfunction (Citation3, Citation19–Citation21). Although this previous work showed the importance of vascular disease in COPD patients that cannot be explained by smoking history alone (Citation13, Citation14, Citation16–18, Citation22), the mechanisms of vascular disease acceleration in COPD patients are not well-established or understood.
We recently showed that ex-smokers with normal airflow reported significantly greater ventilation abnormalities, measured using hyperpolarized noble gas magnetic resonance imaging (MRI), and more severe carotid atherosclerosis as compared to never-smokers (Citation23). This previous work exploited the sensitivity of three-dimensional (3D) pulmonary MRI and carotid ultrasound and provided quantitative evidence of mild airways disease and carotid plaque that was significantly greater in ex-smokers as compared to never-smokers. Based on these previous findings, here we sought to identify and measure pulmonary artery abnormalities in otherwise normal ex-smokers without airflow obstruction.
This is important because there is a dearth of direct evidence relating subclinical pulmonary disease (airways disease and emphysema) with pulmonary artery abnormalities in otherwise healthy ex-smokers. The relationship of pulmonary artery abnormalities (Citation3) and pulmonary hypertension (Citation24–Citation26) with lung abnormalities in COPD is well-established. In one recent example, the relationship of pulmonary artery abnormalities with acute exacerbations of COPD (Citation3) was shown, but the relevance of this for clinical practice was not ascertained. This was an important result because until now there are very few quantitative biomarkers available that help predict COPD exacerbations (Citation3, Citation27).
Here our objective was to measure three-dimensional pulmonary artery measurements from thoracic CT as well as airways disease and emphysema measurements from thoracic CT and MRI in ex-smokers and a control group of healthy never-smokers. In a subset of patients with COPD and based on previous findings that related one-dimensional pulmonary artery measurements and exacerbations in the large-scale ECLIPSE and COPDgene cohorts (Citation3), we also aimed to determine the sensitivity of three-dimensional (3D) pulmonary artery measurements with COPD exacerbations. We hypothesized that quantitative 3D measurements of the pulmonary artery, airways and parenchyma would reveal the direct relationships of early or subclinical pulmonary disease with pulmonary artery abnormalities in ex-smokers.
Methods
Study participants
All research volunteers provided written informed consent to a protocol, approved by a local research ethics board and Health Canada. The inclusion criteria for COPD ex-smokers included smoking history ≥10 pack-years, 50–85 years of age with a physician diagnosis of COPD and post-bronchodilator forced expiratory volume in 1 second (FEV1)/forced vital capacity (FVC) ratio <0.70, in accordance with the Global initiative for chronic Obstructive Lung Disease (GOLD) criteria (Citation28). Ex-smokers without airflow obstruction were enrolled with the same age-range and smoking history but with FEV1/FVC ≥ 0.70. Exclusion criteria included a current diagnosis of asthma or other respiratory conditions. We did not prospectively exclude subjects with other COPD co-morbidities. The inclusion criteria for the healthy never-smokers was 60 to 90 years of age with a smoking history of < 0.5 pack-years and no history of unstable cardiovascular disease or chronic respiratory disease.
Because of the significant impact of exacerbations on COPD patient mortality (Citation29), we recorded severe exacerbations requiring hospitalization for all patients with COPD. The number of acute exacerbations requiring hospitalization was determined using patient hospital records (PowerChart Cerner Corporation, Missouri, USA) as previously described (Citation30). The total number of hospitalizations was defined as the total number of hospitalizations that occurred between 2.5 years prior to and 2.5 years following the study visit (from time −2.5 to 2.5 years). The number of prior hospitalizations was defined as the total number of hospitalizations between 2.5 years and 5 years prior to the study visit (from time −5 to −2.5 years).
Spirometry, Plethysmography, Quality of Life and Exercise Capacity Measurements
Spirometry and lung volumes were acquired using body plethysmography (MedGraphics Corporation, St Paul, Minnesota, USA) following American Thoracic Society and European Respiratory Society (ERS) guidelines (Citation31); the attached gas analyzer (MedGraphics) was used to measure the diffusing capacity for carbon monoxide (DLCO). Quality of life was assessed using the St. George's Respiratory Questionnaire (SGRQ) (Citation32, Citation33); exercise capacity was measured using a standard 6-Minute Walk Distance Test (6MWD) (Citation34).
Image acquisition
MRI was performed using a 3.0 Tesla MR750 (General Electric Health Care, Milwaukee, WI) system (Citation35) for acquisition of conventional 1H, 3He static ventilation and 3He diffusion-weighted MRI. Conventional 1H MRI was acquired during 1.0-L breath-hold of N2 from a 1.0 L Tedlar bag from functional residual capacity (FRC). Prior to 3He static ventilation and 3He diffusion-weighted MRI, a spin-exchange polarizer system (Polarean, Durham, NC, USA) was used to polarize 3He gas to 30–40%. 3He static ventilation and diffusion-weighted imaging were performed following inhalation of a 3He/N2 gas mixture (3He dose = 5 ml/kg body weight) from a 1.0 L Tedlar® bag from FRC as previously described (Citation35).
Multi-detector CT was performed using the 64-slice Lightspeed VCT system (GEHC, Milwaukee, WI USA) with participants in breath-hold after inhalation of 1.0L of N2 from FRC (Citation36) in order to match the MRI lung volume. The ECLIPSE imaging protocol (Citation37) was adapted and used: 64 × 0.625 mm collimation, 120 kVp, 100 effective mA, 500 ms tube rotation time, pitch of 1.00 and image reconstruction using a standard convolution kernel to 1.25 mm. We calculated radiation dose according to our manufacturer settings using the ImPACT CT patient dosimetry calculator based on the Health Protection Agency (UK) NRPB-SR250 and the total effective dose for an average adult was 1.8 mSv (Citation38).
Image analysis
All MRI and CT pulmonary analyses were performed by an expert in quantitative imaging analysis (M.K) with five years of experience developing and performing semi-automated 3He MRI segmentation using custom-built software generated using MATLAB R2007b (The Math-works Inc., Massachusetts, USA). The inter- and intra-reproducibility of the 3He MRI segmentation software was previously evaluated in subjects with COPD (Citation39) and therefore MR images were evaluated once by a single expert observer. 3He MRI ventilation defect percent (VDP) was quantified by registering the 3He static ventilation images to the 1H MR images in order to delineate the defect boundary as previously described (Citation40). 3He apparent diffusion coefficient (ADC) maps were also generated from 3He diffusion-weighted images, as previously described (Citation41).
Pulmonary CT measurements were generated using Pulmonary Workstation 2.0 (VIDA Diagnostics, Inc., Coralville, IA) including airway wall area (WA) and lumen area (LA) for 5th generation airways (Citation42), the relative area of the CT density histogram with attenuation values < −950 HU (RA950) (Citation43), and low attenuation clusters (LAC) with CT densitometry values < −950 HU (Citation44).
For volumetric analysis of the pulmonary arteries, DICOM (Digital Imaging and Communications in Medicine) CT images were evaluated using custom-built software (3D Quantify V4.1.1, Robarts Research Institute, London, Canada), originally developed for three-dimensional visualization and quantification of carotid ultrasound volumes (Citation45). The main, left, and right pulmonary artery volume were generated, as previously described (Citation46). As shown in , the bifurcation of the main pulmonary artery was identified as the branch-point between the left and right pulmonary arteries. As previously described (Citation46), the axes of segmentation were established from the bifurcation (BF) parallel to each of the main, left and right pulmonary arteries.
Figure 1. Pulmonary artery volume measurements from thoracic CT. Left panel shows axial view of CT volume. The axes of segmentation are defined from the bifurcation parallel to each of the main, left and right pulmonary arteries at the level of the bifurcation. Middle panel shows a representative slice of the segmented artery. Right panel shows the segmented main (in red), left (in blue) and right (in green) pulmonary arteries. Scale bar = 1 cm.
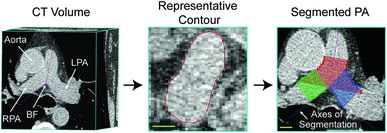
The artery wall boundary was manually segmented in planes perpendicular to the axes of segmentation for 25 × 1 mm slices for the main and 20 × 1mm slices for the left and right pulmonary arteries. Based on the segmented areas and the inter-slice distance, a volume for the segmented region of the vessel was generated. Total pulmonary artery volume was also generated as previously described (Citation46). To account for overlapping regions between the main, left and right pulmonary artery volume measurements, the union of voxels enclosed by each boundary was multiplied by the voxel dimensions. We previously reported low inter- and intra-observer variability for pulmonary artery volumetric measurements and therefore measurements were performed by a single observer (T.J.L) (Citation46). To account for sex differences in pulmonary artery volumes, measurements were normalized by body surface area and age. Finally, because it was previously shown that the pulmonary artery to aorta diameter ratio was associated with a history of COPD exacerbations (Citation3). Therefore, we measured the main pulmonary artery and aorta diameters as previously described (Citation3), as the mean of four consecutive centre CT slices where the bifurcation was visible.
Statistical analysis
We used IBM SPSS Statistics for Windows v21 (IBM Corp, Armonk, NY, USA 2012) and GraphPad Prism for Windows, v6.02 (GraphPad Software, La Jolla, CA, USA) for statistical analyses. A one-way analysis of variance (ANOVA) with post-hoc Tukey HSD (Honest Significant Differences) was conducted to evaluate differences between groups. Normality of main, left, right and total pulmonary artery volumes was evaluated using the Shapiro-Wilk normality test. Pearson correlations were determined for pulmonary artery volumes and pulmonary function measurements where a Holm-Bonferroni correction was conducted to correct for multiple comparisons. We also performed univariate correlations for the total number of severe exacerbations with all clinical, physiological and imaging measurements.
A multivariate zero-inflated Poisson model was used to evaluate the relationship between the total number of severe exacerbations with physiological and imaging measurements using the PROC COUNTREG procedure in SAS 9.2 software (SAS Institute, Cary, NC). All measurements with significant univariate correlations were included in the multivariate model. A zero-inflated Poisson model (Citation47) was used because the total number of hospitalizations included a large proportion of zeroes. From the significant multivariate model, we reported the fold-change in total exacerbations which was defined as the regression coefficient divided by the standard error. Results were considered significant when the probability of a type I error was less than 5% (p < .05).
Results
Subject characteristics
shows the demographic characteristics for the study population, which was a convenience sample of 35 never-smokers (71 ± 7 years) and 124 ex-smokers including 68 ex-smokers with airflow obstruction (71 ± 9 years) and 56 ex-smokers without airflow obstruction (69 ± 10 years). One-way analysis of variance (ANOVA) showed significant differences between the three subgroups for most parameters but not for age (p = .3) or 6MWD (p = .06). For the two ex-smoker subgroups, there were significant differences for FEV1%pred (p < .001), FEV1/FVC (p < .001), FRC%pred (p < .001), TLC%pred (p < .001), DLCO%pred (p < .001), VDP (p < .001), ADC (p < .001), RA950 (p < .001), airway count (p < .001), and the main (p = .014), right (p = .001) and total (p = .003) pulmonary artery volume.
Table 1. Subject characteristics
Imaging measurements
shows qualitative results including hyperpolarized 3He MRI static ventilation images, ADC maps, CT airway trees as well as pulmonary artery segmentations for five representative subjects. Subject 1 is a 74-year-old female never-smoker with normal airflow, no ventilation abnormalities or emphysema, and visibly smaller main (18 cm3), left (7 cm3), right (7 cm3) and total pulmonary artery volume (26 cm3). Subject 2 is a 67-year-old male ex-smoker with normal airflow measurements (FEV1/FVC = 94%, FEV1%pred = 103%) and few ventilation abnormalities concomitant with mild emphysema (VDP = 5%, ADC = 0.30 cm2/s) and with modest main (24 cm3), left (9 cm3), right (9 cm3) and total pulmonary artery volume (31 cm3). Similarly, Subject 3 is a 62-year-old female ex-smoker with normal airflow measurements (FEV1/FVC = 76%, FEV1%pred = 64%), few ventilation abnormalities (VDP = 13%, ADC = 0.23 cm2/s) and modest main (23 cm3), left (9 cm3), right (8 cm3) and total pulmonary artery volume (30 cm3).
Figure 2. Representative MRI and CT pulmonary and pulmonary artery disease biomarkers. Subject 1: 74-year-old female never-smoker FEV1/FVC = 72%, FEV1%pred = 90%, VDP = 1%, ADC = 0.27 cm2/s, WA% = 69%, main pulmonary artery volume = 18 cm3, left pulmonary artery volume = 7 cm3, right pulmonary artery volume = 7 cm3, total pulmonary artery volume = 26 cm3. Subject 2: 67-year-old male ex-smoker FEV1/FVC = 94%, FEV1%pred = 103%, VDP = 5%, ADC = 0.30 cm2/s, WA% = 56%, main pulmonary artery volume = 24 cm3, left pulmonary artery volume = 9 cm3, right pulmonary artery volume = 9 cm3, total pulmonary artery volume = 31 cm3. Subject 3: 62-year-old female ex-smoker FEV1/FVC = 76%, FEV1%pred = 64%, VDP = 13%, ADC = 0.23 cm2/s, WA% = 68%, main pulmonary artery volume = 23 cm3, left pulmonary artery volume = 9 cm3, right pulmonary artery volume = 8 cm3, total pulmonary artery volume = 30 cm3. Subject 4: 76-year-old male ex-smoker GOLD grade II COPD, FEV1/FVC = 39%, FEV1%pred = 56%, VDP = 24%, ADC = 0.50 cm2/s, WA% = 66%, main pulmonary artery volume = 29 cm3, left pulmonary artery volume = 11 cm3, right pulmonary artery volume = 11 cm3, total pulmonary artery volume = 38 cm3. Subject 5: 86-year-old male ex-smoker GOLD grade III COPD, FEV1/FVC = 35%, FEV1%pred = 38%, VDP = 30%, ADC = 0.48 cm2/s, WA% = 67%, main pulmonary artery volume = 30 cm3, left pulmonary artery volume = 11 cm3, right pulmonary artery volume = 12 cm3, total pulmonary artery volume = 40 cm3.
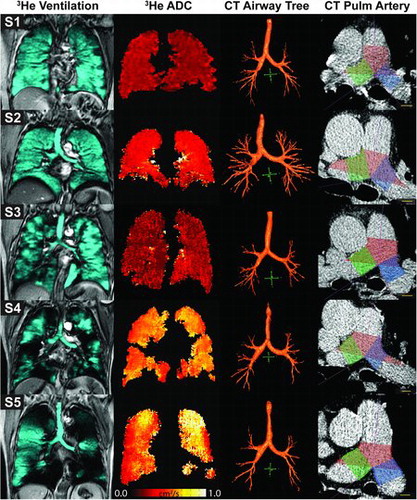
In contrast, Subject 4 is a 76-year-old male ex-smoker with grade II COPD (FEV1/FVC = 39%, FEV1%pred = 56%), significant emphysema and ventilation defects (VDP = 24%, ADC = 0.50 cm2/s) and visibly enlarged main (29 cm3), left (11 cm3), right (11 cm3) and total pulmonary volume (38 cm3). Finally, Subject 5 is an 86-year-old male ex-smoker with GOLD grade III COPD (FEV1/FVC = 35%, FEV1%pred = 38%), significant emphysema and ventilation defects (VDP = 30%, ADC=0.48 cm2/s) and significantly enlarged main (30 cm3), left (11 cm3), right (12 cm3) and total pulmonary artery volume (40 cm3). shows that subjects S4 and 5 have visibly obvious ventilation defects, while for subjects S1, S2 and S3 there is homogeneous ventilation throughout the lung. In a similar fashion, ADC maps indicated greater emphysematous destruction in S4 and 5 as compared to S1-3. Moreover, S1-3 have more complete airway trees, while S4 and 5 presented with truncated airway trees that was coincident with greater pulmonary artery volumes as compared to S1, 2 and 3.
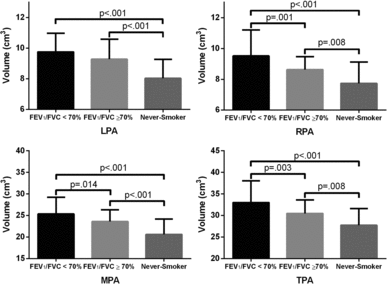
and show quantitative measurements and the significant differences in pulmonary artery volumes between ex- and never-smokers. There were significantly greater main, left, right and total pulmonary artery volumes in ex-smokers with and without airflow obstruction as compared to never-smokers (p < .01). In addition, ex-smokers with airflow obstruction presented with greater main, right and total pulmonary artery volumes compared to ex-smokers without airflow obstruction (p = .01).
Figure 3. Pulmonary artery volumes for ex- and never-smokers. Post-hoc analysis showed significant differences between ex-smokers and never-smokers for all PA volumes. Significant differences in pulmonary artery volume were also observed between ex-smokers with and without airflow obstruction except for the left pulmonary artery.
Relationships
shows Pearson correlations for pulmonary artery volumes with measurements of emphysema, airways disease and airflow obstruction for all participants (n = 159) healthy never-smokers (n = 35) and all ex-smokers (n = 124). For all subjects, there were significant correlations for FEV1/FVC, FEV1%pred, DLCO%pred, airway count, VDP and ADC with main, left, right and total pulmonary artery volume. For all ex-smokers, VDP was significantly correlated with right (r = 0.27, p = .02) and total (r = 0.25, p = .03) pulmonary artery volume. For never-smokers, significant correlations were observed for VDP with left (r = 0.45, p = .04) right (r = 0.46, p = .04) and total (r = 0.46, p = .04) pulmonary artery volume.
Table 2. Pearson correlations for pulmonary artery volumes
Exacerbations
For 68 COPD ex-smokers, there were four previous exacerbations during the 2.5-year period between 5 and 2.5 years prior to the imaging visit and 46 total exacerbations in the 5-year period between 2.5 years prior to 2.5 years post-visit. shows the results of a multivariate model that explains the number of exacerbations in the 5-year period (between 2.5 years pre and 2.5 years post-visit) in these 68 patients. Since there were no univariate correlations for age, body surface area, RA950, WA%, 3He MRI ADC, pulmonary artery/aorta diameter ratio, main pulmonary artery volume, and right pulmonary artery volume with total exacerbations, they were not included in the multivariate model.
Table 3. Relationships with total exacerbations in COPD patients (n = 68)
As shown in , FEV1%pred was significantly (p = .004) associated with the total number of exacerbations with a 3-fold increase in the number of total exacerbations predicted by a decrease of 1%predicted in FEV1. In addition, DLCO was also significantly associated (p = .03) with exacerbations; a 2-fold increase in total exacerbations was predicted by an increase in DLCO of 1%predicted. Exercise capacity measured using the 6MWD was significantly (p = .04) associated with exacerbations; a 2-fold increase in total exacerbations was related to a one meter decrease in the distance walked. Finally, total pulmonary artery volume was significantly (p = .03) associated with the total number of exacerbations; for every 1-cm3 increase in total pulmonary artery volume, a 2-fold increase in total exacerbations was predicted.
Discussion
Our objective was to evaluate 3D measurements of the pulmonary artery derived from thoracic CT (Citation46) in a relatively small group of 159 never-smokers and ex-smokers with and without COPD. We observed: 1) pulmonary artery volumes were significantly greater in ex-smokers compared to never-smokers and significantly greater in ex-smokers with airflow obstruction as compared to ex-smokers with normal lung function, 2) pulmonary artery volumes were associated with lung structure-function measurements in all subjects, and, 3) in COPD patients, a multivariate model that included FEV1, DLCO, 6MWD and total pulmonary artery volume, predicted COPD exacerbations.
First, we measured and evaluated pulmonary artery volumes in never- and ex-smokers with and without airflow obstruction. We observed significantly greater pulmonary artery volumes for ex-smokers with airflow obstruction as compared to ex-smokers without airflow obstruction. This is important because previous research (Citation26) showed that pulmonary artery size is associated with pulmonary hypertension, a finding in some COPD patients and concomitant with increased morbidity and mortality (Citation26, Citation48). Furthermore, we observed significantly greater pulmonary artery volumes for ex-smokers without airflow obstruction as compared to never-smokers. This finding suggests that the pulmonary arteries are abnormally enlarged even in ex-smokers without obstruction and demonstrates that early or mild pulmonary artery abnormalities may be present even at early stages of the disease, which may play an important role in predicting disease progression.
Although these results are potentially clinically relevant, we must acknowledge that differences in pulmonary artery volumes were dependent on the definition of airflow obstruction. We stratified ex-smokers based on FEV1/FVC < .70 because this was the definition used along with the clinical diagnosis of patients that would be followed up for COPD exacerbations. We note that we also analyzed pulmonary artery volume for ex-smokers classified based on the lower limit of normal (LLN, 5th percentile; ERS Global Lung Function Initiative database) (Citation49). When stratified based on LLN values, 11 subjects moved into the normal ex-smoker subgroup and the mean and SD pulmonary artery values remained the same. Therefore, independent of the definition of COPD, differences in pulmonary artery volume between subgroups were observed. In the current study it was not possible to track COPD exacerbations in patients without this diagnosis. These results also point to the fact that different stratification methods tend to under or over-report COPD (Citation50) and that 3D volumetric measurements, while very supportive of small sample sizes, also require cautious interpretation.
We evaluated the relationship of the main, left, right and total pulmonary artery volume with FEV1%pred, FEV1/FVC, DLCO%pred, as well as CT and MRI airway and emphysema measurements. In all participants, there were modest correlations between pulmonary artery volumes and measurements of lung structure-function. This was not unexpected, as previous work showed that COPD patients with a greater ratio of the pulmonary artery to aorta diameter reported significantly declined lung function (Citation3).
We also explored the relationship between pulmonary artery volumes and COPD exacerbations. In the resultant significant model that explained total COPD exacerbations in 68 ex-smokers with airflow obstruction, previous exacerbations were not a significant predictor, which was surprising in light of previous work (Citation27). One explanation for this is that only a single subject experienced four previous exacerbations between 5 years and 2.5 years prior to study. Consistent with previous work that showed the association between 6MWD and COPD hospitalization (Citation51), we observed that the 6MWD was a significant predictor of exacerbations and that a 1m decrease in 6MWD resulted in a 2-fold increase in total exacerbations. Here we also observed that FEV1%pred was associated with a 3-fold increase in total exacerbations, while previous studies showed that FEV1 correlated weakly with clinical symptoms including cardiovascular disease and exacerbation frequency (Citation52, Citation53). Interestingly we also observed that DLCO values were significantly (p = .03) associated with more frequent exacerbations. This was an unexpected result and it may be attributed to the small sample size of this study. In the future, with the development of automated measurement techniques, the sample size can certainly be increased which may help us better understand this finding. This, and the findings in the current study in a small group of 68 COPD subjects, suggests that the three-dimensional total pulmonary artery volume measurement may be a more sensitive predictor of COPD exacerbations than the PA:A ratio.
It is important to acknowledge a number of key study limitations. First, we must recognize that our study did not include current smokers which would have provided important information about pulmonary vascular changes in smokers. However, it is indeed more difficult to recruit older COPD patients who are still current smokers in our local healthcare environment, making this impractical for a larger study. Future studies should be designed to include these individuals as it would provide a wider understanding of pulmonary artery abnormalities in the COPD population. Furthermore, we must acknowledge the relatively small sample size as compared to previous studies using PA diameter measurements (Citation3). Moreover, the current study was limited to and only included those exacerbations that required hospitalizations. Based on a previous study, about 50% of exacerbations go unreported (Citation5) and such events should be considered in future studies. It is important to note we were able only to monitor exacerbations in ex-smokers with airflow obstruction.
Given the increased pulmonary artery volumes observed in ex-smokers without airflow obstruction here, future studies should also monitor hospitalization due to respiratory illness in ex-smokers with normal spirometry too. Several studies have shown the relationship between pulmonary artery size and pulmonary hypertension (Citation24–Citation26, Citation54–Citation57). It has also been shown that patients with pulmonary hypertension have an increased risk of COPD exacerbation (Citation51). Unfortunately, right-heart catheterization data was not acquired for this group of patients and therefore pulmonary artery pressures could not be directly measured and included in our analyses. Furthermore, right heart failure is a common clinical syndrome in individuals with COPD who develop pulmonary hypertension. Evaluating right ventricular size and dysfunction together with pulmonary artery size in future studies would help us better understand the relationship between COPD and right heart failure.
Previous studies have evaluated the relationships between pulmonary small vessel abnormalities using CT with the extent of emphysema (Citation58), as well as pulmonary hypertension (Citation59), pulmonary perfusion (Citation60), and atherosclerosis (Citation61). Using a low dose thoracic CT protocol that was not optimized for cardiac examinations, it was difficult to distinguish smaller vasculature from the surrounding soft tissue whereas the pulmonary artery trunk was well visible in these non-contrast images. Certainly, our measurement approach has the potential to be applied to smaller vessels, identified using contrast, and therefore future studies should acquire contrast enhanced images to evaluate the relationship between the smaller pulmonary vessels using CT or MRI.
In summary, we demonstrated that pulmonary artery volumes can be quantified from thoracic CT in healthy ex-smokers and ex-smokers with COPD. We observed significant differences in pulmonary artery volumes in ex-smokers with and without airflow obstruction and healthy never-smokers. Along with the 6WMD, FEV1 and DLCO, total pulmonary artery volume predicted COPD exacerbations, in a relatively small number of COPD patients in whom there were very few previous exacerbations.
Acknowledgments
We would like to acknowledge D. Buchanan, MSc, and S. Blamires, CCRS, RPT, for recruiting subjects, clinical coordination and database management, A Wheatley, BSc, for production and dispensing 3He gas and T. Szekeres, RTMR, for MRI of research volunteers.
Funding
T.J.L. greatly acknowledges a scholarship from the Canadian Institutes of Health Research (CIHR) Vascular Training Fellowship. M.K. gratefully acknowledges postdoctoral support from the CIHR Bisby award, the CIHR Integrated and Mentored Pulmonary and Cardiovascular Training program (IMPACT), the Michael Smith Foundation for Health Research (MSFHR) and the CIHR Banting Postdoctoral Fellowship program. G.P. gratefully acknowledges support from a CIHR New Investigator Award. Ongoing research funding from CIHR Team Grant CIF 97687 (Thoracic Imaging Network of Canada, or TinCAN) is also gratefully acknowledged.
Declaration of Interest Statement
The authors report no conflicts of interest. The authors alone are responsible for the content and writing of the paper.
References
- Raherison C, Girodet P. Epidemiology of COPD. Euro Respir Rev 2009; 18(114):213–221.
- Kirby M, Owrangi A, Svenningsen S, Wheatley A, Coxson HO, Paterson NA, et al. On the role of abnormal DLCO in ex-smokers without airflow limitation: symptoms, exercise capacity and hyperpolarised helium-3 MRI. Thorax 2013; 68(8):752–759.
- Wells JM, Washko GR, Han MK, Abbas N, Nath H, Mamary AJ, et al. Pulmonary arterial enlargement and acute exacerbations of COPD. New Engl J Med 2012; 367(10):913–921.
- Rabe KF, Hurd S, Anzueto A, Barnes PJ, Buist SA, Calverley P, et al. Global strategy for the diagnosis, management, and prevention of chronic obstructive pulmonary disease: GOLD executive summary. Amer J Respir Crit Care Med 2007; 176(6):532–555.
- Burge S, Wedzicha J. COPD exacerbations: definitions and classifications. Euro Respir J 2003; 21(41 suppl):46s–53s.
- Gershon AS, Guan J, Victor JC, Goldstein R, To T. Quantifying health services use for chronic obstructive pulmonary disease. Amer J Respir Crit Care Med 2013; 187(6):596–601.
- Dransfield MT, Huang F, Nath H, Singh SP, Bailey WC, Washko GR. CT emphysema predicts thoracic aortic calcification in smokers with and without COPD. COPD: J Chroni Obstruct Pulmon Dis 2010; 7(6):404–410.
- Chae EJ, Seo JB, Oh Y-M, Lee JS, Jung Y, Do Lee S. Severity of systemic calcified atherosclerosis is associated with airflow limitation and emphysema. J Comp Assist Tomogr 2013; 37(5):743–749.
- McAllister DA, MacNee W, Duprez D, Hoffman EA, Vogel-Claussen J, Criqui MH, et al. Pulmonary function is associated with distal aortic calcium, not proximal aortic distensibility. MESA lung study. COPD 2011; 8(2):71–78.
- Rasmussen T, Køber L, Pedersen JH, Dirksen A, Thomsen LH, Stender S, et al. Relationship between chronic obstructive pulmonary disease and subclinical coronary artery disease in long-term smokers. Euro Heart J–Cardiovasc Imag 2013; 14(12):1159–1166.
- Anthonisen NR, Skeans MA, Wise RA, Manfreda J, Kanner RE, Connett JE. The effects of a smoking cessation intervention on 14.5-year mortality–A randomized clinical trial. Ann Intern Med 2005; 142(4):233–239.
- Sidney S, Sorel M, Quesenberry CP, DeLuise C, Lanes S, Eisner MD. COPD and incident cardiovascular disease hospitalizations and mortality: Kaiser Permanente Medical Care Program. CHEST J 2005; 128(4):2068–2075.
- Iwamoto H, Yokoyama A, Kitahara Y, Ishikawa N, Haruta Y, Yamane K, et al. Airflow limitation in smokers is associated with subclinical atherosclerosis. Amer J Respir Crit Care Med 2009; 179(1):35–40.
- Barr RG, Ahmed FS, Carr JJ, Hoffman EA, Jiang R, Kawut SM, et al. Subclinical atherosclerosis, airflow obstruction and emphysema: the MESA Lung Study. Euro Respir J 2012; 39(4):846–854.
- Engström G, Hedblad B, Valind S, Janzon L. Asymptomatic leg and carotid atherosclerosis in smokers is related to degree of ventilatory capacity: longitudinal and cross-sectional results from ‘Men born in 1914’, Sweden. Atherosclerosis 2001; 155(1):237–243.
- Lahousse L, van den Bouwhuijsen QJ, Loth DW, Joos GF, Hofman A, Witteman JC, et al. Chronic obstructive pulmonary disease and lipid core carotid artery plaques in the elderly: the Rotterdam Study. Amer J Respir Crit Care Med 2013; 187(1):58–64.
- van Gestel YR, Flu W-J, van Kuijk J-P, Hoeks SE, Bax JJ, Sin DD, et al. Association of COPD with carotid wall intima-media thickness in vascular surgery patients. Respir Med 2010; 104(5):712–716.
- Frantz S, Nihlén U, Dencker M, Engström G, Löfdahl CG, Wollmer P. Atherosclerotic plaques in the internal carotid artery and associations with lung function assessed by different methods. Clin Physiol Funct Imag 2012; 32(2):120–125.
- Barr RG, Mesia-Vela S, Austin JH, Basner RC, Keller BM, Reeves AP, et al. Impaired flow-mediated dilation is associated with low pulmonary function and emphysema in ex-smokers: The Emphysema and Cancer Action Project (EMCAP) Study. Amer J Respir Crit Care Med 2007; 176(12):1200–1207.
- Cinarka H, Kayhan S, Gumus A, Durakoglugil ME, Erdogan T, Ezberci I, et al. Arterial stiffness measured by carotid femoral pulse wave velocity is associated with disease severity in chronic obstructive pulmonary disease. Respir Care 2013; 59(2):274–280.
- Sabit R, Bolton CE, Edwards PH, Pettit RJ, Evans WD, McEniery CM, et al. Arterial stiffness and osteoporosis in chronic obstructive pulmonary disease. Amer J Respir Crit Care Med 2007; 175(12):1259–1265.
- Kim S, Yoon D, Lee E, Hur G, Jung K, Lee S, et al. Carotid atherosclerosis in patients with untreated chronic obstructive pulmonary disease. Inter J Tubercul Lung Dis 2011; 15(9):1265–1270.
- Pike D, Kirby M, Lindenmaier TJ, Sheikh K, Neron CE, Hackam DG, et al. Pulmonary abnormalities and carotid atherosclerosis in ex-smokers without airflow limitation. COPD 2014; 12(1):62–70.
- Ackman Haimovici JB, Trotman-Dickenson B, Halpern EF, William Dec G, Ginns LC, Shepard J-AO, et al. Relationship between pulmonary artery diameter at computed tomography and pulmonary artery pressures at right-sided heart catheterization. Academ Radiol 1997; 4(5):327–334.
- Kuriyama K, Gamsu G, Stern RG, Cann CE, Herfkens RJ, Brundage BH. CT-determined pulmonary artery diameters in predicting pulmonary hypertension. Investig Radiol 1984; 19(1):16–22.
- Lange TJ, Dornia C, Stiefel J, Stroszczynski C, Arzt M, Pfeifer M, et al. Increased pulmonary artery diameter on chest computed tomography can predict borderline pulmonary hypertension. Pulmon Circul 2013; 3(2):363–368.
- Hurst JR, Vestbo J, Anzueto A, Locantore N, Müllerova H, Tal-Singer R, et al. Susceptibility to exacerbation in chronic obstructive pulmonary disease. New Engl J Med 2010; 363(12):1128–1138.
- Global Initiative for Chronic Lung Disease. Global strategy for the diagnosis, management, and prevention of chronic obstructive pulmonary disease (Updated 2013) 2013. Available from: http://www.goldcopd.org/ ( accessed September 6 2013).
- Gudmundsson G, Ulrik CS, Gislason T, Lindberg E, Brøndum E, Bakke P, et al. Long-term survival in patients hospitalized for chronic obstructive pulmonary disease: a prospective observational study in the Nordic countries. Inter J Chron Obstruct Pulmon Dis 2012; 7:571–576.
- Kirby M, Pike D, Coxson HO, McCormack DG, Parraga G. Hyperpolarized 3He ventilation defects used to predict pulmonary exacerbations in mild to moderate chronic obstructive pulmonary disease. Radiology 2014; 273(3):887–896.
- Miller MR, Hankinson J, Brusasco V, Burgos F, Casaburi R, Coates A, et al. Standardisation of spirometry. Eur Respir J 2005; 26(2):319–338.
- Jones PW, Quirk FH, Baveystock CM, Littlejohns P. A self-complete measure of health status for chronic airflow limitation: the St. George's Respiratory Questionnaire. Amer Rev Respir Dis 1992; 145(6):1321–1327.
- Jones PW, Quirk F, Baveystock C. The St George's respiratory questionnaire. Respir Med 1991; 85:25–31.
- Enright PL. The six-minute walk test. Respir Care 2003; 48(8):783–785.
- Parraga G, Ouriadov A, Evans A, McKay S, Lam WW, Fenster A, et al. Hyperpolarized 3He ventilation defects and apparent diffusion coefficients in chronic obstructive pulmonary disease: preliminary results at 3.0 Tesla. Investig Radiol 2007; 42(6):384–391.
- Kirby M, Svenningsen S, Owrangi A, Wheatley A, Farag A, Ouriadov A, et al. Hyperpolarized 3He and 129Xe MR imaging in healthy volunteers and patients with chronic obstructive pulmonary disease. Radiology 2012; 265(2):600–610.
- Vestbo J, Anderson W, Coxson HO, Crim C, Dawber F, Edwards L, et al. Evaluation of COPD longitudinally to identify predictive surrogate end-points (ECLIPSE). Euro Respir J 2008; 31(4):869–873.
- Shrimpton P, Jones D. Normalised organ doses for X-ray computed tomography calculated using Monte Carlo techniques and a mathematical anthropomorphic phantom. Radiat Protect Dosim 1993; 49(1–3):241–243.
- Kirby M, Heydarian M, Svenningsen S, Wheatley A, McCormack DG, Etemad-Rezai R, et al. Hyperpolarized 3He magnetic resonance functional imaging semiautomated segmentation. Academ Radiol 2012; 19(2):141–152.
- Woodhouse N, Wild JM, Paley MN, Fichele S, Said Z, Swift AJ, et al. Combined helium-3/proton magnetic resonance imaging measurement of ventilated lung volumes in smokers compared to never-smokers. J Magnet Reson Imag 2005; 21(4):365–369.
- Kirby M, Heydarian M, Wheatley A, McCormack DG, Parraga G. Evaluating bronchodilator effects in chronic obstructive pulmonary disease using diffusion-weighted hyperpolarized helium-3 magnetic resonance imaging. J Appl Physiol 2012;112(4):651–657.
- Nakano Y, Muro S, Sakai H, Hirai T, Chin K, Tsukino M, et al. Computed tomographic measurements of airway dimensions and emphysema in smokers: correlation with lung function. Amer J Respir Crit Care Med 2000; 162(3):1102–1108.
- Gevenois PA, De Maertelaer V, De Vuyst P, Zanen J, Yernault J-C. Comparison of computed density and macroscopic morphometry in pulmonary emphysema. Amer J Respir Crit Care Med 1995; 152(2):653–657.
- Mishima M, Hirai T, Itoh H, Nakano Y, Sakai H, Muro S, et al. Complexity of terminal airspace geometry assessed by lung computed tomography in normal subjects and patients with chronic obstructive pulmonary disease. Proc Natl Acad Sci 1999; 96(16):8829–8834.
- Ainsworth CD, Blake CC, Tamayo A, Beletsky V, Fenster A, Spence JD. 3D Ultrasound measurement of change in carotid plaque volume: A tool for rapid evaluation of new therapies. Stroke J Cereb Circul 2005; 36(9):1904–1909.
- Lindenmaier TJ, Sheikh K, Bluemke E, Gyacskov I, Mura M, Licskai C, et al., editors. Three-dimensional segmentation of pulmonary artery volume from thoracic computed tomography imaging. In: Gimi, B, Molthen, RC (Eds.), Proceedings of Conference on Medical Imaging - Biomedical Applications in Molecular Structural and Functional Imaging, Orlando, FL. SPIE; February 24–26, 2015.
- Lambert D. Zero-inflated Poisson regression, with an application to defects in manufacturing. Technometrics 1992; 34(1):1–14.
- Chaouat A, Naeije R, Weitzenblum E. Pulmonary hypertension in COPD. Euro Respir J 2008; 32(5):1371–1385.
- Quanjer PH, Stanojevic S, Cole TJ, Baur X, Hall GL, Culver BH, et al. Multi-ethnic reference values for spirometry for the 3–95-yr age range: the global lung function 2012 equations. Euro Respir J 2012; 40(6):1324–1343. doi: 10.1183/09031936.00080312. PubMed PMID: 22743675; PubMed Central PMCID: PMC3786581.
- Mohamed Hoesein FA, Zanen P, Lammers JW. Lower limit of normal or FEV1/FVC < 0.70 in diagnosing COPD: an evidence-based review. Respir Med 2011; 105(6):907–915. doi: 10.1016/j.rmed.2011.01.008. PubMed PMID: 21295958.
- Kessler R, Faller M, Fourgaut G, Mennecier B, Weitzenblum E. Predictive factors of hospitalization for acute exacerbation in a series of 64 patients with chronic obstructive pulmonary disease. Amer J Respir Crit Care Med 1999; 159(1):158–164.
- Franciosi LG, Page CP, Celli BR, Cazzola M, Walker MJ, Danhof M, et al. Markers of disease severity in chronic obstructive pulmonary disease. Pulmon Pharmacol Therap 2006; 19(3):189–199.
- Gelb AF, Hogg JC, Müller NL, Schein MJ, Kuei J, Tashkin DP, et al. Contribution of emphysema and small airways in COPD. CHEST J 1996; 109(2):353–359.
- Chan AL, Juarez MM, Shelton DK, MacDonald T, Li C-S, Lin T-C, et al. Novel computed tomographic chest metrics to detect pulmonary hypertension. BMC Med Imag 2011; 11(1):7.
- Burger IA, Husmann L, Herzog BA, Buechel RR, Pazhenkottil AP, Ghadri JR, et al. Main pulmonary artery diameter from attenuation correction CT scans in cardiac SPECT accurately predicts pulmonary hypertension. J Nucl Cardiol 2011; 18(4):634–641.
- Edwards P, Bull R, Coulden R. CT measurement of main pulmonary artery diameter. Br J Radiol 1998;71(850):1018–20.
- Tan RT, Kuzo R, Goodman LR, Siegel R, Haasler GB, Presberg KW. Utility of CT scan evaluation for predicting pulmonary hypertension in patients with parenchymal lung disease. CHEST J 1998;113(5):1250–1256.
- Matsuoka S, Washko GR, Dransfield MT, Yamashiro T, San Jose Estepar R, Diaz A, et al. Quantitative CT measurement of cross-sectional area of small pulmonary vessel in COPD: correlations with emphysema and airflow limitation. Acad Radiol 2010; 17(1):93–99. doi: 10.1016/j.acra.2009.07.022. PubMed PMID: 19796970; PubMed Central PMCID: PMC2790546.
- Matsuoka S, Washko GR, Yamashiro T, Estepar RS, Diaz A, Silverman EK, et al. Pulmonary hypertension and computed tomography measurement of small pulmonary vessels in severe emphysema. Amer J Respir Crit Care Med 2010; 181(3):218–225. doi: 10.1164/rccm.200908-1189OC. PubMed PMID: 19875683; PubMed Central PMCID: PMC2817812.
- Matsuoka S, Yamashiro T, Matsushita S, Fujikawa A, Yagihashi K, Kurihara Y, et al. Relationship between quantitative CT of pulmonary small vessels and pulmonary perfusion. Amer J Roentgenol 2014; 202(4):719–724. doi: 10.2214/AJR.13.11027. PubMed PMID: 24660697.
- Matsuoka S, Yamashiro T, Diaz A, Estepar RS, Ross JC, Silverman EK, et al. The relationship between small pulmonary vascular alteration and aortic atherosclerosis in chronic obstructive pulmonary disease: quantitative CT analysis. Academ Radiol 2011; 18(1):40–46. doi: 10.1016/j.acra.2010.08.013. PubMed PMID: 20947389; PubMed Central PMCID: PMC3006041.