
Abstract
Animal models that can be used to predict the allergenic potential of drug candidates have not been adequately optimized, validated, or characterized. While initial validation data from an inter-laboratory study of the mouse lymph node proliferation assay (LNPA) appeared promising, no additional investigations in this model have been reported. The objectives of this study were to use positive and negative control drugs to further optimize and validate the LNPA utilizing a non-radioactive endpoint and determine the sensitivity, specificity, and predictivity of the model. Drugs associated with hypersensitivity reactions in the literature were chosen to test in the model in addition to drugs with few or no reports of hypersensitivity. Mice received a subcutaneous injection of drug or vehicle into the scruff of the neck once daily for a period of 3 days. On Day 6, draining lymph nodes were harvested, single cell suspensions prepared, and total cell numbers determined for each animal by flow cytometry. A stimulation index was calculated by dividing the mean total cell number for the drug-treated group by the mean total cell number for the vehicle-treated animals. Based on statistical analysis of the data, animals with a total cell number ≥2.5× the mean of the vehicle group were classified as ‘responders’. Based on data generated to date with 12 positive control and six negative control drugs, the model had a sensitivity of 75%, a specificity of 74%, and a relatively good predictive value (measured by the Receiver Operating Characteristic AUC of 0.80). The data here suggest that this model may be a useful tool for identifying drug candidates with the potential to produce allergic responses in the clinic. Future studies will investigate the mechanism(s) for the lymph node responses in order to develop additional endpoints that may increase the sensitivity and specificity of the model.
Introduction
The occurrence of delayed-type hypersensitivity responses to systemically administered drugs can have a significant impact on drug development as well as on patients and the healthcare industry as a whole. Drug hypersensitivity reactions can lead to significant morbidity or death in affected individuals or deprive patients of access to drugs that would provide therapeutic benefit. The clinical manifestations of drug hypersensitivity can fall anywhere along a broad spectrum ranging in severity from mild and fully reversible upon drug withdrawal to severe (including death) and may involve either single- or multi-organ systems (Thong & Tan, Citation2011). It is rare for standard toxicity studies in laboratory animals to uncover potential hypersensitivity liabilities. Furthermore, hypersensitivity reactions are typically rare in the clinic, and there are limited means for determining which patients are likely to be affected. Due to the lack of a complete mechanistic understanding and the absence of biomarkers and definitive risk factors, drugs that are associated with hypersensitivity reactions in the clinic (independent of the rareness of the event) can be subject to non-approval or withdrawal from the market. Greater understanding of mechanisms and the availability of tools for determining hypersensitivity potential early in a drug development program would be beneficial prior to putting patients at risk or investing in costly development programs.
While several mechanisms have been proposed for idiosyncratic drug reactions including the hapten hypothesis, the danger hypothesis, and the pharmacological interaction with immune receptors (PI) concept, it is apparent that one mechanism alone cannot adequately explain all reactions to every drug or even to a single drug. For example, data exist which suggest that sulfa-methoxazole (SMX) can induce T-cell-specific responses via both hapten and PI mechanisms (Cheng et al., Citation2008; Depta et al., Citation2004; Faulkner et al., Citation2012; Lavergne et al., Citation2009). There is also evidence that patient-specific risk factors play a role in contributing to the development of drug hypersensitivity reactions, such as genetic factors (e.g. HLA polymorphisms, metabolic enzymes), concurrent infection (e.g. herpes virus), and overall immune status (Gomes & Demoly, Citation2005; Ozcan et al., Citation2010). There has been a significant amount of interest in HLA variants, particularly since genome-wide association studies have revealed associations between specific HLA alleles and drug hypersensitivity responses, e.g. abacavir/HLA-B*5701, allo-purinol/HLA-B*5801, and carbamazepine HLA-B*1502 (Aihara, Citation2011; Wei et al., Citation2012). Recent studies have demonstrated that, in the case of abacavir, binding of abacavir to the peptide binding cleft of the HLA can alter the peptide repertoire presented to T-cells, which can result in an allogenic-like reaction (Illing et al., Citation2012; Norcross et al., Citation2012; Ostrov et al., Citation2012). Interestingly, binding of abacavir appears to be restricted to HLA-B*5701, since the peptide repertoire of the closely related HLA-B*5801 was not found to be modified by abacavir. Whether such a mechanism exists for other drugs (restricted or not to a particular HLA allele) remains to be elucidated.
However, it is also recognized that the presence of a specific drug-associated HLA allele alone is not the only factor which determines whether a hypersensitivity reaction will occur in a patient, since not all patients that carry the HLA-B*5701 allele present with a hypersensitivity reaction during or following treatment with abacavir. Moreover, some HLA alleles are only associated with particular manifestations of a response and only in certain ethnic populations. More recently, T-cell receptor clonotypes have been reported to play a significant role in carbamazepine-associated severe cutaneous responses (Ko et al., Citation2011), but this has not yet been defined for other drugs. It is apparent that the mechanisms for hypersensitivity reactions are multi-factorial, and, while predisposing factors may be identifiable, it is difficult to identify all of the contributing factors that result in hypersensitivity reactions in every situation.
Not surprisingly, because of the different mechanisms and risk factors that may play a role in promoting drug hypersensitivity reactions, there has been little success in developing and validating an animal model for predicting these types of responses. The popliteal lymph node assay (PLNA), first published in 1981, is the most thoroughly investigated model for predicting drugs that are associated with autoimmune and hypersensitivity responses in the clinical setting (Aida et al., Citation1998; Gleichmann, Citation1981; Pieters, Citation2001; Ravel & Descotes, Citation2005; Shinkai et al., Citation1999). The model itself has been modified to include several approaches (indirect and adoptive transfer PLNA) (Pieters, Citation2001; Ravel & Descotes, Citation2005). While the model is able to detect true positive results, several compounds also produce false negative or positive results for reasons that are not well understood. Also, there has been a greater emphasis on validating the PLNA by testing drugs associated with autoimmune reactions rather than drugs associated with hypersensitivity reactions. In addition, the method of compound administration (subcutaneous foot pad injection) is not widely accepted by animal care and use committees.
The reporter antigen PLNA (RA-PLNA), developed by Albers et al. (Citation1997), incorporates the use of reporter antigens TNP-OVA and TNP-Ficoll to provide some mechanistic data about the compound being tested. By measuring TNP-specific antibody production following administration of the drug in question in the presence of the reporter antigen, one can determine whether the test compound is acting as an adjuvant to enhance the immune response or inducing T-cell sensitization. This assay has been tested with a moderate number of compounds, and further development is still ongoing to understand its full utility for predicting compounds that may be associated with drug hypersensitivity reactions. For instance, a study evaluating the reporter antigen model with an oral dosing regimen was recently published (Kwast et al., Citation2011).
In 2005, Weaver et al. (Citation2005) published on the lymph node proliferation assay (LNPA), which is a combination of the PLNA and the local lymph node assay (LLNA). In this model, a compound is administered via subcutaneous injection in the nape of the neck (as opposed to the footpad), the draining lymph nodes are recovered and proliferation is measured using tritiated thymidine incorporation. Several companies joined in the inter-laboratory validation of this model, which demonstrated reproducible responses for the compounds tested. However, the set of commercial compounds selected for analysis was fairly limited (10 compounds total; eight positives, two negatives) and, unfortunately, no further investigations have been completed to date.
Recognizing that one of the major gaps in drug hypersensitivity research is the lack of a well-characterized, practical and validated animal model for predicting the potential of systemically administered low molecular weight drugs to produce these reactions, we began working on a mouse model using the LNPA as a starting point. The objectives of our studies were to measure immune activation using a non-radioactive immunological end-point and to determine the sensitivity and specificity of the model by evaluating responses to positive and negative drugs (as defined by the reported clinical occurrence of drug hypersensitivity reactions). Flow cytometry was used to determine total viable cell counts in the draining lymph nodes of animals treated with positive and negative control drugs.
Materials and methods
Animals
Female C57BL/6 mice (4–6-months-old, weighing between 18–20 g; Charles River Laboratories, Wilmington, MA) were used for these studies. Mice were housed (five animals/cage) in polycarbonate/polysulfone boxes with microisolator tops and acclimated for at least 7 days prior to use. Animals had ad libitum access to a standard laboratory diet and filtered water. All procedures involving animals were conducted under animal use protocols approved by Pfizer’s Institutional Animal Care and Use Committee in compliance with the Guide for Care and Use of Laboratory Animals and all applicable federal regulations.
Drug preparation
A list of the drugs tested in the model is presented in . Literature reports of hypersensitivity reactions in the clinic, the availability of mechanistic data (e.g. re-challenge, lymphocyte transformation test, in vivo animal data) suggesting immune-mediated responses, as well as information contained in the drug labels were considered in the classification of a drug as positive or negative. All drugs classified as positive have skin rash or hypersensitivity reactions listed on their labels either as a warning or box warning, with the exception of valproic acid, which carries a precaution for multi-organ hypersensitivity reactions and a mention of skin rash under the Adverse Reaction section of the label. None of the drugs classified as negative carry a warning of skin rash, hypersensitivity or multi-organ hypersensitivity on their labels, although adverse reactions related to hypersensitivity or skin rash are mentioned on the labels for four of the six negative drugs.
Table 1. Summary of drugs tested in the mouse allergy model.
Drugs were obtained internally from Pfizer and/or a commercial source as indicated. Depending on the drug, different vehicles were used as appropriate to achieve maximum solubility and included water, 10% ethanol, 10% DMSO or a mixture of 10/10/80% or 10/20/70% ethanol/cremophor EL/phosphate-buffered saline (PBS, pH 7.4; Gibco, Grand Island, NY). In some cases, several vehicles may have been used for a particular drug over the course of the validation of the model. Drug solutions were prepared each day prior to injection at a concentration that allowed the drug to be administered in a volume of 200 µl. Heat and/or sonication were applied as necessary to influence drug solubility. Drugs were used at doses not associated with overt toxicity, e.g. weight loss, severe clinical symptoms or irritation at the injection site. For two positive control drugs, i.e. ofloxacin and abacavir, three dose levels (50, 100 and 200 mg/kg) were tested in the model to determine whether a dose-response could be observed.
In vivo exposure and lymph node single cell suspension preparation
Mice (five animals/treatment group) received a single subcutaneous injection (200 µL) of the drug solution or appropriate vehicle () in the scruff of the neck once daily for 3 consecutive days (Days 1–3). Following a 2-day rest period, mice were euthanized (Day 6) using CO2 asphyxiation and the brachial lymph nodes were collected and placed in PBS supplemented with penicillin-streptomycin, HEPES buffer, MEM NEAA (minimal essential medium with non-essential amino acids), and L-glutamine (all Gibco) (PBS+). The lymph nodes from each animal were processed into single cell suspensions by gently disrupting the tissues and passing them through a 70 -µM nylon cell strainer. The cell suspensions were washed twice and then re-suspended in 1 ml PBS+.
Flow cytometric analysis of lymph nodes
Live/dead fixable green dead cell stain (3 µl/sample of a 1:20 dilution of stock dye; Invitrogen, Grand Island, NY) was added to ≈500 µl of each lymph node sample and incubated (at room temperature) in the dark for 20 min. Samples were then washed with PBS+, re-suspended in 300 µl Becton Dickinson Stain buffer (BD, Franklin Lakes, NJ), and analyzed on an Accuri C6 flow cytometer (Becton Dickinson). The Accuri was set to acquire 100,000 events/sample and acquisition volume for each sample was recorded. After excluding dead cells, the following formula was used to determine total cell number per sample: (live cell number acquired/acquisition volume) × total sample volume. For each drug-treated mouse, a stimulation index (SI) was calculated as the total cell number for each mouse treated with drug divided by the mean total cell number of vehicle-treated mice. Mean SIs were calculated for each treatment group by taking the mean total cell number for each drug-treated group divided by the mean total cell number of vehicle-treated mice. Based on statistical analysis, an SI ≥ 2.5 was considered to be a positive response. The percentage of mice with a positive response within each drug-treated group (percent response) was calculated as the number of individual animals within a given treatment group with an SI ≥ 2.5 divided by the total number of animals in that same treatment group.
Statistical analysis
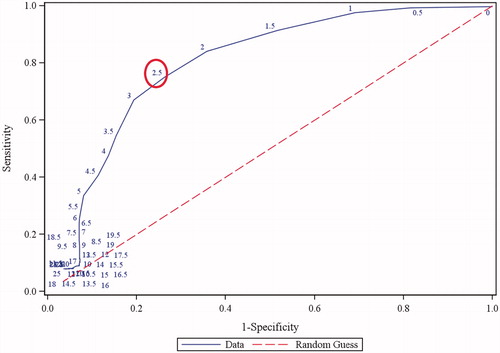
Data generated from the positive and negative control drugs were used to determine the predictivity, sensitivity, and specificity of the model. Specifically, a re-sampling technique was adopted to assess positivity of a drug for a given random sample of drugs (McLeod & Bellhouse, Citation1983). Briefly, the data were randomly sampled without replacement in a way such that there was exactly one animal for each drug (consequently, there were 18 animals/sample). For each animal in a given sample, its ratio to the vehicle mean in the same experiment was calculated. The ratios were then compared to a range of thresholds, above which positivity was claimed, and from there sensitivity and specificity were evaluated. This procedure was iterated 1000 times (i.e. 1000 samples were generated), and the mean sensitivity, specificity, and the area under the receive operating characteristic (ROC) curve were calculated (Hanley & McNeil, Citation1982). The optimal threshold (2.5-fold) was determined as the point on the ROC curve closest to (0,1).
Results
Drug responses
A total of 12 positive and six negative marketed drugs were selected to validate the mouse model. A summary of the responses for the drugs tested in the model is provided in . No injection site reactions or other clinical signs of toxicity were noted at the dosages used in these studies. The mean SI values for the drugs classified as positive and negative ranged from 1.7–6.6 and 1.2–2.6, respectively. Using a threshold SI of 2.5, 10 of 12 drugs (83%) were correctly identified as positive and five of six drugs (83%) were correctly identified as negative. The mean of the percent response values ranged from 20–100% for the positive control drugs and 6–50% for the negative control drugs. Considering a mean percent response value of ≥20% (i.e. one of five animals with an SI ≥ 2.5) for positivity, 100% of the drugs were correctly identified as positive and 50% were correctly identified as negative.
Table 2. Summary of drug responses in the mouse allergy model.
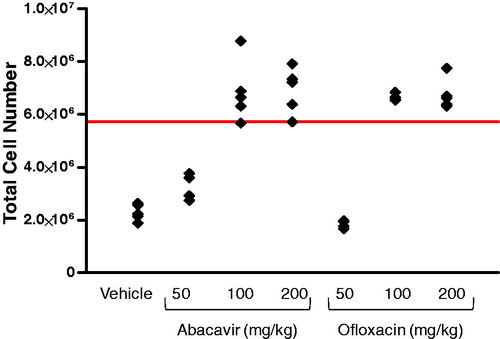
A dose-response was observed for the two positive control drugs tested (). For abacavir, SI values of 1.4, 3.0, and 3.0 were observed for the 50, 100, and 200 mg/kg dose levels that corresponded to 0%, 80%, and 100% responses, respectively. Similarly for ofloxacin, SI values of 0.3 (0% response), 2.9 (100% response), and 3.0 (100% response) were observed with mice dosed at 50, 100, and 200 mg/kg, respectively.
Figure 1. Dose-response for the positive control drugs abacavir and ofloxacin. Mice were injected subcutaneously with 50, 100, or 200 mg/kg of drug and total lymph node cell numbers then determined by flow cytometry. Each data point represents the response from an individual mouse (n = 4–5 per treatment group). The solid line indicates the mean vehicle response (2.29 × 106) × 2.5.
The majority of drugs tested gave reproducible responses (i.e. positive- or negative-based on mean SI) across different experiments, although there was inter-experiment variability in the magnitude of the response (SI value). However, both false positive (verapamil) and false negative responses (valproic acid, phenytoin) were observed for some drugs. For example, phenytoin, classified as a positive control drug, was positive (SI = 3.2) in only one of five experiments. However, a ≥20% response rate was observed in three of the five experiments with phenytoin. The negative control drug verapamil was positive (SI range of 2.7–3.4) in three of four experiments, which corresponded with a percent response range of 60–80%.
Vehicle control responses
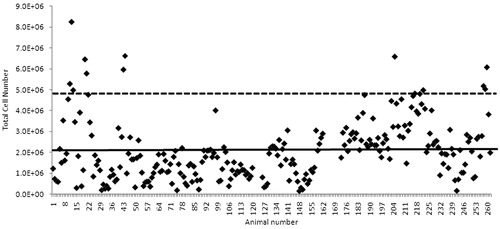
The mean vehicle-treated animal response was 2.02 × 10⁶ total lymph node cells, which was calculated from a total of 257 individual animals over 52 independent experiments (). The use of different vehicles did not appear to affect the vehicle control animal response or the magnitude of the positive control response (data not shown). A slight increase in the vehicle animal response was observed in a subset of experiments; the reason for this increase is not clear.
Figure 2. Total cell number in mice treated with various vehicles. Experiments were conducted over a 2.5-year period. Solid line indicates mean vehicle response (2.02 × 10⁶); dotted line indicates mean + 2 SD (i.e. 4.82 × 10⁶).
Sensitivity, specificity, and predictivity
The sensitivity, specificity, and predictivity of the mouse allergy model were calculated using a receiver operating characteristic (ROC) curve (). At a threshold SI of 2.5 for a positive response, a sensitivity of 75%, specificity of 74%, and predictive value of 0.80 were determined.
Figure 3. Receiver operating characteristic curve generated using logistic regression analysis. Numbers on curve represent different threshold values. A threshold of 2.5 (circled) corresponds to a sensitivity of 75% and a specificity of 74%. AUC = 0.80.
Discussion
While several lymph node assays have been developed and investigated for their potential to predict allergic drug reactions following systemic administration, they have not been well-validated in that only a limited number of drugs have been tested in the various models. The main objectives of these studies were to use a flow cytometric endpoint to assess immune activation in positive control-treated animals, determine sensitivity and specificity of the response, and validate the model (named the mouse allergy model) by testing a number of drugs associated or not with hypersensitivity reactions in the clinic.
The use of flow cytometry for the determination of total lymph node cell number was selected over other more traditional methods of cell counting for several reasons including higher throughput, the precision of the Accuri cytometer for counting viable cells, and the option of incorporating markers that can be used to phenotypically characterize the lymph node cells in future improvements of the mouse allergy model. Although the measurement of draining lymph node cellularity and/or proliferation activity is the standard endpoint for most mouse models for predicting allergenic potential (e.g. LLNA, PLNA), the mechanism(s) behind these changes are not well-understood. Two possibilities that exist are a drug-induced adjuvant-like effect or a true T-cell sensitization to the drug, or both. In the mouse allergy model, the mechanism by which the various positive control drugs are causing an increase in the total cell population is unknown, but presumably could be due to either of these aforementioned mechanisms. What the mouse allergy model data do tell us is that administration of positive control drugs is capable of increasing cell counts in the lymph node draining the site of drug exposure. Similar increases in cell counts are not observed for the negative control drugs tested in this study, with the exception of verapamil which produced a mean response rate of 50% and mean SI of 2.6. We are currently investigating the phenotype of the cells in the lymph node after the administration of positive and negative control drugs to determine if there is a selective increase in a specific lymphocyte subset and whether the increase in cellularity is due to proliferation or increased trafficking of cells to the lymph node (or a combination thereof).
One limitation of the LNPA and PLNA is the inability to detect positive responses with drugs that are believed to require metabolic activation to exert their effects (e.g. sulfamethoxazole). In the case of the mouse allergy model, and in contrast to that reported for the LNPA, a positive response was observed for sulfamethoxazole (mean SI of 6.3), suggesting a role for metabolism in this model. Differences in metabolism at the site of injection (top of the head for the LNPA and footpad for the PLNA, vs nape of the neck for mouse allergy model) may have contributed to the difference in the responses observed for sulfamethoxazole.
With the exception of amoxicillin and penicillin, the positive control drugs used in the validation of this model appear to produce hypersensitivity reactions in a relatively small percentage of the exposed population. However, in the mouse allergy model, mean response rates for the majority of the positive control drugs were >80% (four of five animals responded). Such a high response rate may be due to the use of an inbred mouse strain and/or the high local concentration of drug reaching the draining lymph node following subcutaneous exposure. Another hypothesis is that these drugs all activate or stimulate a common pathway that leads to immune cell activation, and, due to the timing of the assay and/or endpoint being evaluated, we are able to observe this common response (i.e. increased lymph node cellularity). Whether the activation/stimulation of the immune response actually will manifest into a clinical reaction is likely dependent on additional risk factors that are probably not consistent across drugs. For example, abacavir may have the potential to stimulate the immune system in any individual, but this stimulation may only result in an observable, clinical response if other risk factors (including the HLA-B*5701 allele) are present. This hypothesis is consistent with the findings in the mouse allergy model for abacavir, where we observe a mean response rate of 90% in mice in the absence of the human risk allele. However, whether abacavir can act via a mechanism in mice similar to that which has recently been described for HLA-B*5701 has not been reported.
One of the main drivers for developing a predictive animal model is the lack of predictivity of standard toxicology studies for drug hypersensitivity responses. Such models are necessary to ensure that drugs selected for development are not unexpectedly terminated in later stages due to hypersensitivity reactions. A relatively robust data set was included in these studies to understand the predictive value of the model. Responses for a total of 12 positive and six negative control drugs were statistically analyzed to determine an appropriate threshold for a positive response and to better understand how predictive the mouse model is for clinical hypersensitivity reactions. We opted to select a threshold of ≥2.5 as a positive response in the assay in order to have a good balance between sensitivity (75%) and specificity (74%). However, depending on the specific purpose of the assay, one may choose to adjust the threshold accordingly.
One of the strengths of the mouse allergy model, compared to other animal models for predicting compounds with allergenic potential, is the relatively large number of drugs assessed. In addition, eliminating the need for radioactivity and incorporating the use of a straightforward, easily measured endpoint (i.e. cellularity) make this model more affordable and user-friendly (eliminates the need for radioactivity permits and specialized equipment) across multiple labs. From a drug development perspective, the model offers medium throughput and low bulk requirement (∼30 mg compound/experiment, three dose groups). However, there are also some limitations that should be noted, including the difficulty sometimes encountered in solubilizing compounds and the clinical signs that may be observed, both of which can impact the ability to obtain the desirable dosage. A lack of understanding with respect to the mechanism(s) for the positive responses observed and the specific cell types involved in producing the responses may also be considered a limitation of the model at the present time. In addition, the route of exposure may not be clinically relevant since most drugs associated with hypersensitivity reactions are administered orally. The relationship of the response to clinical dose is also not easily interpretable, and, as such, the utility of the model in its current state is for hazard identification rather than exposure-based risk assessment.
Conclusions
The mouse allergy model at this time appears to be a promising predictive tool for identifying drug development candidates that may have allergenic potential following systemic administration. Additional investigations into the mechanism(s) driving the response, developing means to mechanistically differentiate responses to different drugs, and the characterization of the lymph node changes may help to increase the sensitivity of the assay and the utility of the model for predicting human risk.
Declaration of interest
The authors report no conflicts of interest. The authors alone are responsible for the content and writing of the paper.
Acknowledgements
The authors would like to thank Adam Hudson (Pfizer) for his technical contributions and Ellen Evans (Pfizer) for her review and helpful comments on the manuscript.
References
- Aida, T., Kimura, T., Ishikawa, N., and Shinkai, K. (1998). Evaluation of allergenic potential of low-molecular compounds by mouse popliteal lymph node assay. J. Toxicol. Sci. 23:425–432
- Aihara, M. (2011). Pharmacogenetics of cutaneous adverse drug reactions. J. Dermatol. 38:246–254
- Albers, R., Broeders, A., van der Pijl, A., et al. (1997). The use of reporter antigens in the popliteal lymph node assay to assess immunomodulation by chemicals. Toxicol. Appl. Pharmacol. 143:102–109
- Cheng, L., Sterwart, B. J., You, Q., et al. (2008). Covalent binding of the nitroso metabolite of sulfamethoxazole is important in induction of drug-specific T-cell responses in vivo. Mol. Pharmacol. 73:1769–1775
- Depta, J. P., Altznauer, F., Gamerdinger, K., et al. (2004). Drug interaction with T-cell receptors: T-cell receptor density determines degree of cross-reactivity. J. Allergy Clin. Immunol. 113:519–527
- Faulkner, L., Martinsoon, K., Santoyo-Castelazo, A., et al. (2012). The development of in vitro culture methods to characterize primary T-cell responses to drugs. Toxicol. Sci. 127:150–158
- Gleichmann, H. (1981). Studies on the mechanism of drug sensitization: T-cell-dependent popliteal lymph node reaction to diphenylhydantoin. Clin. Immunol. Immunopathol. 18:203–211
- Gomes, E. R., and Demoly, P. (2005). Epidemiology of hypersensitivity drug reactions. Curr. Opin. Allergy Clin. Immunol. 5:309–316
- Hanley, J. A., and McNeil, B. J. (1982). The meaning and use of the area under a receiver operating characteristic (ROC) curve. Radiology 143:29–36
- Illing, P. T., Vivian, J. P., Dudek, N. L., et al. (2012). Immune self-reactivity triggered by drug-modified HLA-peptide repertoire. Nature 486:554–558
- Ko, T. M., Chung, W. H., Wei, C. Y., et al. (2011). Shared and restricted T-cell receptor use is crucial for carbamazepine-induce Stevens-Johnson syndrome. J. Allergy Clin. Immunol. 128:1266–1276
- Kwast, L. M., Fiechter, D., Hassing, I., et al. (2011). Oral exposure to drugs with immune-adjuvant potential induces hypersensitivity responses to the reporter antigen TNP-OVA. Toxicol. Sci. 121:312–319
- Lavergne, S. N., Wang, H., Callan, H. E., et al. (2009). “Danger” conditions increase sulfamethoxazole-protein adduct formation in human antigen-presenting cells. J. Pharmacol. Exp. Ther. 331:372–381
- McLeod, A. I., and Bellhouse, D. R. (1983). A convenient algorithm for drawing a simple random sample. Appl. Stats. 32:182–183
- Norcross, M. A., Luo, S., Lu, L., et al. (2012). Abacavir induces loading of novel self-peptides into HLA-B*57: 01: An autoimmune model for HLA-associated drug hypersensitivity. AIDS 26:F21–29
- Ostrov, D. A., Grant, B. J., Pompeu, Y. A., et al. (2012). Drug hypersensitivity caused by alteration of the MHC-presented self-peptide repertoire. Proc. Natl. Acad. Sci. USA 109:9959–9964
- Ozcan, D., Seckin, D., Bilezicki, B., and Arlslan, H. (2010). The role of human herpesvirus-6, Epstein-Barr virus and cytomegalovirus infections in the etiopathogenesis of different types of cutaneous drug reactions. Int. J. Dermatol. 49:1250–1254
- Pieters, R. (2001). The popliteal lymph node assay: A tool for predicting drug allergies. Toxicology 158:65–69
- Ravel, G., and Descotes, J. (2005). Popliteal lymph node assay: Facts and perspectives. J. Appl. Toxicol. 25:451–458
- Shinkai, K., Nakamura, K., Tsutsui, N., et al. (1999). Mouse popliteal lymph node assay for assessment of allergic and autoimmunity-inducing potentials of low-molecular-weight drugs. J. Toxicol. Sci. 24:95–102
- Thong, B. Y., and Tan, T. C. (2011). Epidemiology and risk factors for drug allergy. Br. J. Clin. Pharmacol. 71:684–700
- Weaver, J. L., Chapdelaine, J. M., Descotes, J., et al. (2005). Evaluation of a lymph node proliferation assay for its ability to detect pharmaceuticals with potential to cause immune-mediated drug reactions. J. Immunotoxicol. 2:11–20
- Wei, C. Y., Ko, T. M., Shen, C. Y., and Chen, Y. T. (2012). A recent update of pharmacogenomics in drug-induced severe skin reactions. Drug Metab. Pharmacokinet. 27:132–141