
Abstract
The mononuclear phagocyte system (MPS) which provides protection against infection is made up of phagocytic cells that engulf and digest bacteria or other foreign substances. Suppression of the MPS may lead to decreased clearance of pathogenic microbes. Drug delivery systems and immunomodulatory therapeutics that target phagocytes have a potential to inhibit MPS function. Available methods to measure inhibition of MPS function use uptake of radioactively-labeled cells or labor-intensive semi-quantitative histologic techniques. The objective of this work was to develop a non-radioactive quantitative method to measure MPS function in vivo by administering heat-killed E. coli conjugated to a pH-sensitive fluorescent dye (Bioparticles®). Fluorescence of the Bioparticles® is increased at low pH when they are in phagocytic lysosomes. The amount of Bioparticles® phagocytosed by MPS organs in rats was determined by measuring fluorescence intensity in livers and spleens ex vivo using an IVIS® Spectrum Pre-clinical In Vivo Imaging System. Phagocytosis of the particles by peripheral blood neutrophils was measured by flow cytometry. To assess method sensitivity, compounds likely to suppress the MPS [clodronate-containing liposomes, carboxylate-modified latex particles, maleic vinyl ether (MVE) polymer] were administered to rats prior to injection of the Bioparticles®. The E. coli particles consistently co-localized with macrophage markers in the liver but not in the spleen. All of the compounds tested decreased phagocytosis in the liver, but had no consistent effects on phagocytic activity in the spleen. In addition, administration of clodronate liposomes and MVE polymer increased the percentage of peripheral blood neutrophils that phagocytosed the Bioparticles®. In conclusion, an in vivo rat model was developed that measures phagocytosis of E. coli particles in the liver and may be used to assess the impact of test compounds on MPS function. Still, the detection of inhibition of splenic macrophage function will require further assay development.
Introduction
The mononuclear phagocyte system (MPS), also known as the reticuloendothelial system (RES), consists of monocytes, macrophages, and dendritic cells that reside in tissues throughout the body. The MPS includes Kupffer cells in the liver, marginal zone and red pulp macrophages in the spleen, alveolar macrophages in the lung, sinus histiocytes in the lymph node, and microglia in the central nervous system. The major functions of these cell types are phagocytosis and killing of microorganisms in their respective local environments. Compromising the function of the MPS may lead to decreased clearance of microbes with increased susceptibility to infection, or increased spread of tumors (Allen, Citation1988).
Immunomodulatory therapeutics and drug delivery systems (e.g. liposomes, nanoparticles, and polymer conjugates) have the potential to inhibit MPS function (Moghimi & Patel, Citation1998). The mechanism by which MPS function is altered by drug delivery systems may involve uptake and accumulation in the phagocytic cells. The impact to the MPS may depend on the type of compound being evaluated and the magnitude of accumulation in the phagocytic cells. Although there are in vitro methods available to measure functions of macrophages, in vivo assessment is a critical part of determining the risk of compromised host resistance to infection following drug delivery.
Several methods have been developed to evaluate function of the MPS in vivo. One such method used 51sodium chromate labeled sheep red blood cells injected into mice, followed by gamma counting of blood samples and dissected organs with MPS function. MPS activity was assessed by measuring both the disappearance of radioactivity from blood samples taken within 15 min of injection as well as accumulation of radioactivity in the organs (Bick et al., Citation1984; Munson et al., Citation1982). A similar method measured clearance of colloidal carbon from the blood following intravenous injection (Donald & Tennent, Citation1975). This method has the advantage of not using radioactivity, but the investigators showed that this method could only be used as a measure of MPS function when the carbon was used at low doses. At higher doses, the carbon was bound by platelets and macrophage membranes, thus was not indicative of phagocytosis. Another method used injection of fluorescent latex beads into rats, followed by removal, fixation, and sectioning of livers, then analysis by fluorescence microscopy (Tsujimoto et al., Citation2008). This method, while useful for assessing phagocytosis in tissue sections, is labor intensive and may not be able to accurately measure total phagocytosis by all Kupffer cells in the liver, since only limited numbers of sections of liver are analyzed.
To avoid the use of radioactivity and labor-intensive blood sampling and analysis techniques, we sought to develop an assay using E. coli Bioparticles® labeled with a pH-sensitive dye, followed by ex vivo imaging of the liver and spleen using an IVIS® Spectrum Pre-clinical In Vivo Imaging System. Only Bioparticles® that have been phagocytosed and were present in low pH phagocytic lysosomes were fluorescent, thereby preventing detection of non-phagocytosed particles. Here, we present the results using three types of potential inhibitors of MPS function, i.e. clodronate liposomes (representing a combination of a liposome drug delivery vehicle and an immunomodulatory drug), carboxylate-modified latex (CML) beads and maleic vinyl ether (MVE), representing particle-based and polymer-based drug delivery systems, respectively.
Materials and methods
Animals
Wistar Han rats (male, 4–5-weeks-old) from Charles River (Wilmington, MA) were allowed to acclimate at least 1 week before use. All rats had ad libitum access to alfalfa-free (to minimize tissue autofluorescence) pellet diet (Purina 5V75) and water, and were housed in a temperature (72 ± 5°F)- and humidity (50 ± 10 %)-controlled room with a 12-h light–dark illumination cycle. All studies were conducted under protocols approved by Pfizer’s Institutional Animal Care and Use Committee in compliance with the Guide for Care and Use of Laboratory Animals and all applicable federal regulations.
In vivo phagocytosis assay
Test agents (e.g. clodronate-liposomes, CML beads, MVE polymer) were injected intravenously (IV) into the tail veins of 6–7-week-old rats (≈120–200 g). After 1–48 h, pHrodo™-labeled Escherichia coli Bioparticles® (Life Technologies, Carlsbad, CA) re-suspended in saline were injected IV. After 1 h, blood was collected, the rats were euthanized by carbon dioxide inhalation, and their livers and spleens were removed, weighed, and imaged individually on the IVIS® Spectrum Pre-clinical In Vivo Imaging System (Perkin Elmer, Waltham, MA), using a 535 nm excitation/600 nm emission filter set. Each entire organ was selected as the Region of Interest for fluorescence analysis, using Living Imaging Software® (Perkin Elmer). Fluorescence intensity was expressed as total radiant efficiency units. Data are reported as fold-increases in fluorescence (radiant efficiency of livers or spleens from each rat treated with test compound or vehicle and Bioparticles®/mean radiant efficiency of livers or spleens from animals that received vehicle only). For liposome experiments, liposomes containing phosphate-buffered saline (PBS-liposomes) were used as vehicle. In all other experiments, saline was the vehicle control. All radiant efficiencies were corrected for organ weights. A total of two-to-five rats were used in each group (test agent or vehicle control + Bioparticles®). A total of one-to-two rats/group were used for ‘No Bioparticle®’ (background autofluorescence) control groups.
Test agents
Liposome-encapsulated clodronate
Liposomes containing clodronate (i.e. clodronate-liposomes) at 5 mg clodronate/ml suspension or liposomes containing PBS (Clodronate Liposomes Foundation, Amsterdam, the Netherlands) were IV injected at 0.1 ml/10 g body weight (BW). After 48 h, when elimination of macrophages in the spleen and liver is maximal in the rat (van Rooijen et al., Citation1990; van Rooijen & Sanders, Citation1994), Bioparticles® were injected by the IV route. Control animals received 0.1 ml/10 g BW of 0.9% saline by the IV route.
Carboxylate modified latex (CML) beads
Various concentrations of non-fluorescent CML beads (1 µm diameter) (Life Technologies) diluted in 0.9% saline or saline only (control) were injected IV 1 h prior to injection of Bioparticles®. The 1 h time period was considered sufficient for complete uptake of the beads into the MPS, as verified in a previous experiment that showed that the fluorescence of 1-µm CML beads in the blood disappeared within 40 min (data not shown).
Maleic vinyl ether (MVE) polymer
Various concentrations of MVE polymer (gift from Kimber L. White, ImmunoTox Inc., Richmond, VA) diluted in 0.9% saline or saline only (control) were injected IV 24 h (sufficient timepoint for maximal inhibition; personal communication) prior to injection of Bioparticles®.
Immunohistochemistry of livers and spleens
Following euthanasia of the rats, livers and spleens were placed in cryomolds (Sakura Finetek, Torrance, CA), filled with OCT freezing medium (Sakura Finetek), submerged in a container of 2-methylbutane (Sigma, St. Louis, MO), placed in liquid nitrogen until frozen, and then stored on dry ice. Frozen livers and spleens were sectioned at 6 µm on a cryostat (Model # CM3050s; Leica, Heidelberger, Germany), thawed, and fixed. Sections were blocked and incubated with primary antibodies ED-1 (MCA341A) and ED-2 (MCA342R) both from AbDSerotec (Raleigh, NC), washed, incubated with a biotinylated horse anti-mouse, rat-absorbed secondary antibody (BA-2001, Vector Laboratories, Burlingame, CA), washed, and incubated with streptavidin Alexa Fluor 488 (S-11223, Life Technologies). Nuclei were stained with 4′,6-diamidino-2-phenylindole dihydrochloride (DAPI) (D8417, Sigma) and cover-slipped with Aqua-mount (Thermo Fisher Scientific, Kalamazoo, MI). Tissue sections were then viewed on an Axioplan microscope (Zeiss, Oberkochen, Germany) and images were captured using a Zeiss Axiocam MRB camera with separate filters for DAPI, FITC, and Texas Red at excitations/emissions of, respectively, 350/470, 490/525, and 596/615 nm. Co-localization was demonstrated by merging images of the same field taken with different filter sets. For liposome experiments, a qualitative measurement of phagocytosis was made in order to compare treatments. A pathologist reviewed the blinded liver section images and scored them according to distribution for ED1, ED2, and Bioparticles®. Sections were assigned a value from 1–4 (lowest to highest relative number of fluorescence+ cells/section).
Flow cytometry
Phagocytosis of the Bioparticles® in the peripheral blood was measured by flow cytometry. Blood samples were collected from rats via cardiac puncture into sodium heparin tubes. Duplicate 100 µl aliquots of whole blood were then evaluated for each rat. Following lysis of the red blood cells, the remaining leukocytes were collected, washed, and re-suspended in 250 µl Stain Buffer (BD 554656; BD, Franklin Lakes, NJ). Cells were analyzed on a Becton Dickinson Accuri C6 flow cytometer after collecting 400 000 events using an excitation laser of 488 nm with a bandpass filter of 585/40 nm. All data were analyzed using CFlow Plus software (BD).
Statistical analysis
Unpaired two-tailed Student’s t-tests were used to assess statistical significance between two groups. All statistical analyses were performed with Microsoft® Excel. p values ≤ 0.05 were considered significant.
Results
Development of the model
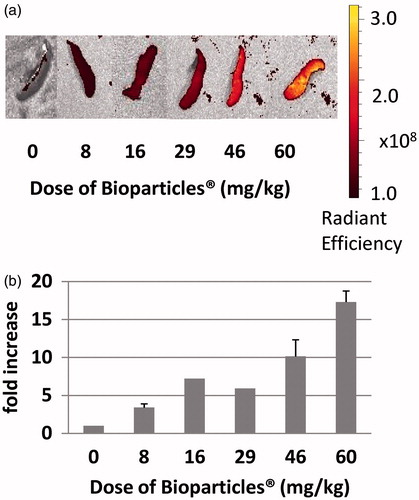
As a first step, the maximum capacity of the rat MPS for Bioparticles® was determined. To accomplish this, various doses of Bioparticles® (8–60 mg/kg rat BW) were tested. Representative images of livers () and spleens () demonstrate that, as the dose of Bioparticles® increased, fluorescence increased. The results showed that at the dose of 46 mg Bioparticles®/kg there was an ≈20-fold increase in fluorescence in the livers from Bioparticles®-injected rats compared to those of saline-injected rats (). Increasing the Bioparticles® dose to 60 mg/kg did not further increase the fold-increase in fluorescence; therefore, all further experiments were done using 46 mg Bioparticles®/kg. In the spleens, there was an ≈17-fold increase in fluorescence in the spleens injected with 60 mg Bioparticles®/kg compared to that in the organs from the saline-injected rats (). Fluorescence in the spleens was still increasing at the doses tested and did not plateau.
Figure 1. Fluorescence in livers of rats injected with increasing amounts of Bioparticles®. (a) Radiant efficiency of fluorescence in livers following injection of various doses of Bioparticles®. Representative organs are shown. (b) Fold-increase in fluorescence compared to vehicle control (saline).
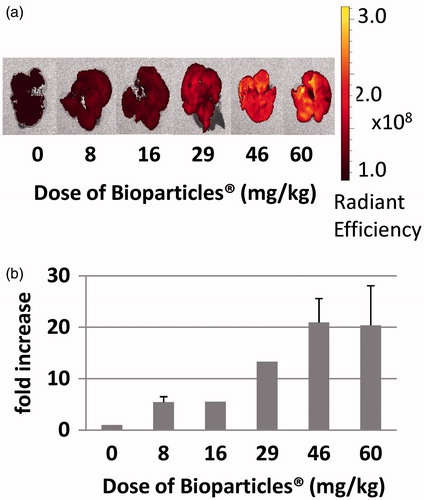
Figure 2. Fluorescence of spleens of rats injected with increasing amounts of Bioparticles®. (a) Radiant efficiency of fluorescence of spleens following injection of various doses of Bioparticles®. Representative organs are shown. (b) Fold-increase in fluorescence compared to vehicle control (saline).
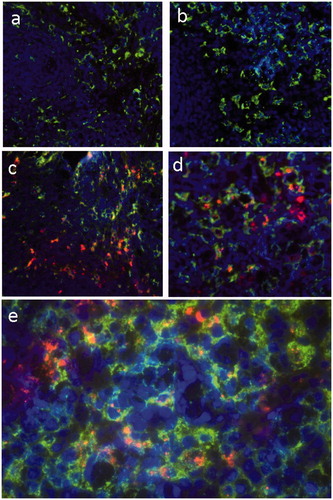
Liver sections from rats injected with saline () or Bioparticles® () were stained with fluorescent antibodies to ED-1 (pan macrophage marker) () or ED-2 (resident macrophage marker) (). The results showed that Bioparticles® fluorescence (red) co-localized with ED-1 or ED-2 fluorescence (green), indicating the Bioparticles® were located in liver macrophages (Kupffer cells). Spleen sections from rats injected with saline () or Bioparticles® () were also stained with macrophage markers. The results showed that Bioparticles® fluorescence did not consistently co-localize with ED-1 () or ED-2 macrophage () fluorescence, indicating that the Bioparticles® were not always located inside splenic macrophages.
Figure 3. Co-localization of Bioparticles® with liver macrophages. Rats were injected with (a, b) saline or (c–e) 46 mg Bioparticles®/kg. Livers sections were stained with fluorescent antibodies to (a, c, e) ED-1 or (b, d) ED-2. Representative images are shown. Magnification = (a–d) 20× and (e) 40×. Bioparticles® (red); ED-1 and ED-2 (green); nuclei (purple).
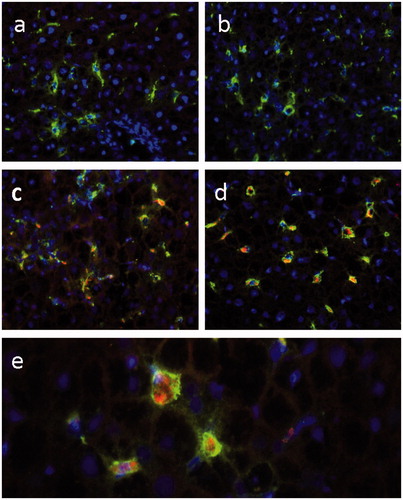
Figure 4. Co-localization of Bioparticles® with spleen macrophages. Rats were injected with (a, b) saline or (c–e) Bioparticles®. Spleen sections were stained with fluorescent antibodies to (a, c, e) ED-1 or (b, d) ED-2. Representative images are shown. Magnification = (a–d) 20× and (e) 40×. Bioparticles® (red); ED-1 and ED-2 (green); nuclei (purple).
Effect of test agents on phagocytosis in the liver
Clodronate-liposomes
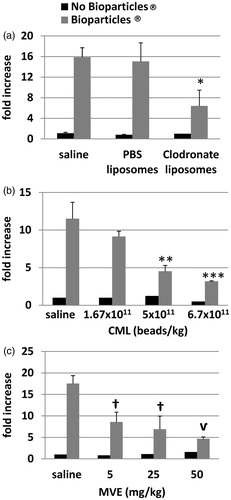
The livers of animals injected with clodronate liposomes showed a statistically significant decrease (≈2.5-fold for both) in fluorescence compared to those of rats that were injected with PBS liposomes or saline (). There was no significant difference in fluorescence measures between the saline and PBS liposome groups. Averaged qualitative measurements of stained liver sections showing ED1 and ED2 macrophages and Bioparticles® from rats injected with saline plus Bioparticles® (n = 3) had a mean rank (and standard deviation) of 3.7 (±0.6). Livers from rats injected with PBS liposomes plus Bioparticles® (n = 2) were ranked a 4.0 (±0.0). Livers from rats injected with clodronate liposomes plus Bioparticles® (n = 3) were ranked 1.3 (±0.6). These data confirm that clodronate liposome treatment decreased the number of macrophages in the liver, providing an explanation for the decrease in liver fluorescence seen in rats that received clodronate liposomes as compared to saline alone or PBS-liposomes. These results provided evidence that this method was specifically measuring uptake of Bioparticles® by macrophages in the liver.
Figure 5. Effect of liposomes, carboxylate modified latex beads, or maleic vinyl ether on phagocytosis in liver macrophages. Rats were injected with (a) liposomes (PBS or Clodronate), (b) CML beads, or (c) MVE prior to injection of the Bioparticles®. Livers were removed and imaged. No Bioparticles® control represent the background fluorescence of livers with saline or test agent only. Fold-increases in fluorescence from (a) PBS liposomes or (b, c) saline controls ± standard deviation are shown. Radiant efficiencies for individual animals were corrected for their liver weights. *p < 0.001 versus Saline + Bioparticles®, p < 0.01 versus PBS liposomes + Bioparticles®; **p < 0.05 versus Saline + Bioparticles®; ***p < 0.01 versus Saline + Bioparticles®; †p < 0.001 MVE versus Saline + Bioparticles®; vp < 0.000 05 versus Saline + Bioparticles®.
Carboxylate modified latex beads
Various numbers of CML beads (ranging from 1.67–6.70 × 10¹¹ beads/kg BW) were injected into rats prior to injection of the Bioparticles®. The results showed that, as the number of CML beads increased, the amount of fluorescence decreased (). Concentrations of 5.0 × 10¹¹ and 6.7 × 10¹¹ CML beads/kg BW induced significant decreases of Bioparticle® fluorescence of 2.5- and 3.6-fold, respectively, as compared to saline with Bioparticles®.
Maleic vinyl ether polymer
Various amounts of MVE polymer (ranging from 5–50 mg/kg BW) were injected into rats prior to injection of the Bioparticles®. The results showed that, as the amount of MVE polymer increased, the Bioparticles® fluorescence in the livers decreased in a concentration-related manner (). MVE polymer caused significant decreases of ≈2.0–3.7-fold in Bioparticles® fluorescence at all concentrations tested as compared to saline with Bioparticles®.
Peripheral blood neutrophil phagocytosis
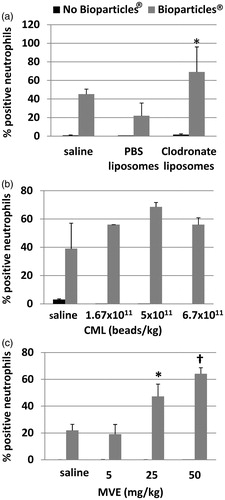
The percentage of peripheral blood neutrophils that had phagocytosed Bioparticles® was measured by flow cytometry. Following treatment with clodronate liposomes () or MVE (), there were statistically significant increases in the percentage of neutrophils that had taken up the E. coli Bioparticles®. However, there was no significant increase in the percentage of neutrophils that had taken up Bioparticles® in rats injected with CML beads ().
Figure 6. Peripheral blood neutrophil phagocytosis following MPS inhibition. Flow cytometry analysis of blood neutrophils determined the percentage of cells that contained Bioparticles® following MPS inhibition by (a) liposomes, (b) CML beads, or (c) MVE. *p < 0.01 versus Saline + Bioparticles®; †p < 0.000 05 versus Saline + Bioparticles®.
Effect of test agents on phagocytosis by spleen macrophages
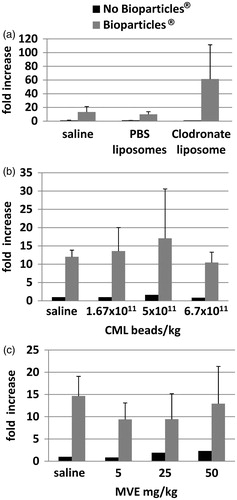
Uptake of E. coli Bioparticles® was also measured in spleens in all experiments. The fold-increase in fluorescence in the spleens was variable, was not proportional to amounts of test articles administered, and there were no statistically significant changes in animals that were injected with liposomes (), CML beads (), or MVE (), as compared to rats that were injected with saline (vehicle) plus Bioparticles®.
Figure 7. Effect of liposomes, carboxylate modified latex beads, or maleic vinyl ether on phagocytosis in spleen macrophages. Rats were injected with (a) liposomes (PBS or Clodronate), (b) CML beads, or (c) MVE prior to injection of the Bioparticles®. Spleens were removed and imaged. ‘No Bioparticle®’ controls represent background fluorescence of spleens with saline or test agent only. Fold-increases in fluorescence from (a) PBS liposomes or (b, c) saline controls ± standard deviation are shown.
Discussion
These studies were conducted to develop a non-radioactive method to measure inhibition of MPS function by various compounds in vivo. The study first demonstrated that, by increasing the amount of E. coli Bioparticles® that were injected, fluorescence in the livers and spleens increased. The study was able to show that for liver, injection of 46 mg Bioparticles®/kg BW resulted in the maximum amount of fluorescence. Determination of this end-point, which reflects the capacity of the MPS, allows detection of inhibition of MPS function by our method. If the drug delivery system damages or takes up physical space in the macrophages, a decrease in Bioparticles® fluorescence should occur. The study was not able to demonstrate saturation of the spleen even after injection of 60 mg E. coli Bioparticles®/kg. This may explain why the study was not able to detect significant decreases in spleen fluorescence after administration of the test articles and may demonstrate that Bioparticles® are preferentially cleared to the liver.
The physiological properties (i.e. size, shape, surface charge, hydrophobicity, etc.) of the liposomes, CML beads, MVE polymer, and the E.coli particles determine their biodistribution. Immediately following intravenous (IV) injection, blood proteins bind to the particles, forming a corona (Kettiger et al., Citation2013). This process may influence recognition and uptake by tissue macrophages in specific organs as well. Following IV injection, particles of 150–300 nm are mainly localized to the liver and spleen (Kettiger et al., Citation2013); however, specific uptake by the resident macrophages is dependent on complex interactions between cells and foreign materials.
The study here confirmed that fluorescence signals in the liver represented phagocytosis by Kupffer cells by demonstrating co-localization of the E. coli Bioparticles® with macrophage markers. The pHrodo™ dye becomes highly fluorescent in the acidic phagolysosomal compartment of phagocytes, and can be measured by imaging on the IVIS® Spectrum system. In the spleen, however, Bioparticles® fluorescence did not always co-localize with macrophage fluorescence, demonstrating that Bioparticles® were not always located inside splenic macrophages. The study next demonstrated that three representative drug delivery modalities, i.e. clodronate liposomes, carboxylate-modified microspheres, and MVE polymer, were each able to inhibit phagocytosis of the E. coli particles by Kupffer cells. To show that this model could detect inhibition by liposomes, rats were injected with clodronate liposomes that deplete macrophages by inducing apoptosis (van Rooijen et al., Citation1996). Macrophage depletion induced by clodronate-liposomes occurs by the ‘suicide’ technique (van Rooijen & Sanders, Citation1996). In this technique, the liposome-encapsulated clodronate was ingested by macrophages and the liposomes fused with lysosomes. The bilayers of liposomes were disrupted, causing the clodronate to be released within the cell, causing the cell to be killed. Using immunofluorescence microscopy, this study demonstrated that clodronate liposome treatment decreased the number of macrophages in the liver, which correlated with decreased uptake of the fluorescent E. coli Bioparticles®.
This study also showed that injection of CML beads or MVE inhibited Kupffer cell uptake of the Bioparticles®. To mimic injection of a nanoparticle drug that would take up space in macrophages of the MPS, CML-modified latex particles, which are negatively charged, with a surface that has a polyelectrolyte character, and are reported to have the right characteristics for phagocytic applications according to the manufacturer (Life Technologies), were injected. Administered nanoparticles are preferentially cleared by Kupffer cells (Sadauskas et al., Citation2007) and, even though CML beads are larger than the nanoparticles, they appear to be preferentially cleared by Kupffer cells as well. MVE treatment was previously shown to decrease phagocytosis of 51Cr-labeled sheep red blood cells by the liver and spleen (Auttachoat et al., Citation2004).
We hypothesized that, if MPS function was inhibited, injection of E. coli Bioparticles® would result in increased uptake by peripheral blood neutrophils. The data showed a statistically significant increase in the percentage of neutrophils that contained Bioparticles® in rats injected with clodronate liposomes or MVE as compared to saline controls. Similar increases were observed in rats injected with CML beads, although the increases were not statistically significant – likely due to the high variability in the saline controls. These results suggest that, in animals with decreased MPS function, our hypothesis is true and that more Bioparticles® remain in circulation and are available for uptake by blood neutrophils. Our results demonstrated that this assay could measure phagocytosis by Kupffer cells and inhibition of phagocytosis following administration of a toxicant, a particle, or a polymer.
However, the detection of inhibition of the function of splenic macrophages will require further assay development. There are several potential reasons why our positive control agents were not able to inhibit MPS function in the spleen. There are two compartments in the spleen, i.e. red pulp and white pulp. White pulp, responsible for initiating immune responses to blood-borne antigen, is made up of three sub-compartments, e.g. the periarteriolar lymphoid sheath, the follicles, and the marginal zone, and contains lymphocytes, macrophages, dendritic cells, plasma cells, arterioles, and capillaries in a reticular framework similar to what is found in the red pulp. The red pulp contains macrophages responsible for removing foreign material, old and damaged erythrocytes, and blood-borne particulates (Cesta, Citation2006; Steiniger, Citation2001). As much as 90% of the total splenic blood flow bypasses the reticular network of the red pulp and flows through the spleen in seconds. The remaining 10% of splenic blood flow is exposed to phagocytic cells of the red pulp in a slower pathway that allows prolonged exposure of blood and particles to these cells. Due to lower flow rates, particles can become trapped in the reticular meshwork of the red pulp (Cesta, Citation2006; Moghimi, Citation1995).
This may explain our data showing that the Bioparticles® in the spleen were not always localized in macrophages, and that many macrophages did not appear to contain Bioparticles®. Bioparticles® may have been engulfed by cells other than macrophages or trapped in extracellular spaces. This may also explain why macrophages in the spleen were not filled to capacity but the liver Kupffer cells were. We did not see a decrease in Bioparticle® fluorescence in the spleens after treatment with clodronate liposome, CML beads, or MVE, most likely because the Bioparticles® were preferentially cleared to the liver. Other studies have demonstrated preferential clearance to the liver. In one study, ≈60% of a dose of IV-injected Listeria monocytogenes was cleared rapidly from the bloodstream and recovered in the liver. Organisms that escaped clearance in the liver were found in other tissues, including spleen, bone marrow, and lungs (Gregory et al., Citation2002). Liver has been demonstrated to be the preferential organ for clearance of Quantum dots as well (Liu et al., Citation2011).
There have been attempts to modify particle characteristics to prevent capture by the liver and select for spleen localization (Moghimi, Citation1995). We may be able to use particles such as these to modify this model for measurement of spleen macrophage function. In the future we would also like to adapt the model to mice and potentially measure phagocytosis of other organisms such as gram positive bacteria or yeast. By correlating data obtained from this model with data generated from existing or newly-developed in vitro assays with macrophage cell lines or primary macrophages, it may be possible to develop a predictive in vitro method to help assess MPS function.
The current model is a fluorescence-based method that does not require the use of radioactivity. By removing the livers and using the IVIS® imaging system, macrophage function can be quickly accessed. Currently, the model works to measure phagocytosis in the liver and can be used to assess the impact of test compounds on the function of Kupffer cells in the MPS system.
Conclusions
We have developed a fluorescence-based method to measure in vivo phagocytosis in the livers of rats and demonstrated that IV administration of clodronate liposomes, latex beads, or MVE polymer resulted in decreased phagocytosis of the E. coli particles by liver Kupffer cells. This assay will be useful to evaluate therapeutics that have the potential to alter macrophage function as well as liposomal, particle-based, or polymer-based drug delivery systems for their propensity to inhibit the MPS function of the liver. The detection of inhibition of splenic macrophage function will require further assay development.
Declaration of interest
The authors report no conflicts of interest. The authors alone are responsible for the content and writing of the paper.
Acknowledgements
We thank Cheryl Tyszkiewicz for performing the IV injections, Kenye Sebastian for the liver and spleen immunohistochemistry, and Kimber L. White for the gift of maleic vinyl ether polymer.
References
- Allen, T. M. 1988. Toxicity of drug carriers to the mononuclear phagocyte system. Adv. Drug Deliv. Rev. 2:55–67
- Auttachoat, W., Chitsomboon, B., Peachee, V. L., et al. 2004. Immunomodulation by Dok Din Daeng (Aeginetia indica Roxb.) extracts in female B6C3F1 mice: II. Humoral immunity, innate immunity and hematology. Int. Immunopharmacol. 4:1381–1390
- Bick, P. H., Tucker, A. N., White, K. L. Jr and Holsapple, M. P. 1984. Effects of subchronic exposure to diethylstilbestrol on humoral immune function in adult female B6C3F1 mice. Immunopharmacology 7:27–39
- Cesta, M. F. 2006. Normal structure, function, and histology of the spleen. Toxicol. Pathol. 34:455–465
- Donald, K. J., and Tennent, R. J. 1975. The relative roles of platelets and macrophages in clearing particles from the blood; the value of carbon clearance as a measure of reticuloendo-thelial phagocytosis. J. Pathol. 117:235–245
- Gregory, S. H., Cousens, L. P., van Rooijen, N., et al. 2002. Complementary adhesion molecules promote neutrophil-Kupffer cell interaction and the elimination of bacteria taken up by the liver. J. Immunol. 168:308–315
- Kettiger, H., Schipanski, A., Wick, P., and Huwyler, J. 2013. Engineered nanomaterial uptake and tissue distribution: From cell to organism. Int. J. Nanomedicine 8:3255–3269
- Liu, W., Zhang, S., Wang, L., et al. 2011. CdSe quantum dot (QD)-induced morphological and functional impairments to liver in mice. PLoS One 6:e24406
- Moghimi, S. M. 1995. Mechanisms of splenic clearance of blood cells and particles: Towards development of new splenotropic agents. Adv. Drug Deliv. Rev. 17:103–115
- Moghimi, S. M., and Patel, H. M. 1998. Serum-mediated recognition of liposomes by phagocytic cells of the reticuloendothelial system – The concept of tissue specificity. Adv. Drug Deliv. Rev. 32:45–60
- Munson, A. E., Sain, L. E., Sanders, V. M., et al. 1982. Toxicology of organic drinking water contaminants: Trichloromethane, bromodichloromethane, dibromochloromethane and tribromomethane. Environ. Health. Perspect. 46:117–126
- Sadauskas, E., Wallin, H., Stoltenberg, M., et al. 2007. Kupffer cells are central in the removal of nanoparticles from the organism. Part. Fibre Toxicol. 4:10
- Steiniger, B. (Ed.). 2001. Spleen. New York: John Wiley and Sons, Ltd
- Tsujimoto, T., Kawaratani, H., Kitazawa, T., et al. 2008. Decreased phagocytic activity of Kupffer cells in a rat non-alcoholic steatohepatitis model. World J. Gastroenterol. 14:6036–6043
- van Rooijen, N., and Sanders, A. 1994. Liposome mediated depletion of macrophages: Mechanism of action, preparation of liposomes and applications. J. Immunol. Meth. 174:83–93
- van Rooijen, N., and Sanders, A. 1996. Kupffer cell depletion by liposome-delivered drugs: Comparative activity of intracellular clodronate, propamidine, and ethylenediaminetetra-acetic acid. Hepatology. 23:1239–1243
- van Rooijen, N., Kors, N., van den Ende, M., and Dijkstra, C. D. 1990. Depletion and re-population of macrophages in spleen and liver of rats after intravenous treatment with liposome-encapsulated dichloromethylene diphosphonate. Cell. Tissue. Res. 260:215–222
- van Rooijen, N., Sanders, A., and van den Berg, T. K. 1996. Apoptosis of macrophages induced by liposome-mediated intracellular delivery of clodronate and propamidine. J. Immunol. Meth. 193:93–99