
Abstract
Amodiaquine (AQ) treatment is associated with a high incidence of idiosyncratic drug-induced liver injury (IDILI) and agranulocytosis. Evidence suggests that AQ-induced IDILI is immune mediated. A significant impediment to mechanistic studies of IDILI is the lack of valid animal models. This study reports the first animal model of IDILI with characteristics similar to mild IDILI in humans. Treatment of female C57BL/6 mice with AQ led to liver injury with delayed onset, which resolved despite continued treatment. Covalent binding of AQ was detected in the liver, which was greater in female than in male mice, and higher in the liver than in other organs. Covalent binding in the liver was maximal by Day 3, which did not explain the delayed onset of alanine aminotransferase (ALT) elevation. However, coincident with the elevated serum ALT, infiltration of liver and splenic mononuclear cells and activation of CD8 T-cells within the liver were identified. By Week 7, when ALT levels had returned close to normal, down-regulation of several inflammatory cytokines and up-regulation of PD-1 on T-cells suggested induction of immune tolerance. Treatment of Rag1−/− mice with AQ resulted in higher ALT activities than C57BL/6 mice, which suggested that the adaptive immune response was responsible for immune tolerance. In contrast, depletion of NK cells significantly attenuated the increase in ALT, which implied a role for NK cells in mild AQ-induced IDILI. This is the first example of a delayed-onset animal model of IDILI that appears to be immune-mediated.
Introduction
Amodiaquine (AQ), a 4-aminoquinoline, was approved to treat malaria because of the development of resistance to chloroquine. Although it is still used in some countries, AQ was withdrawn from the market because of severe idiosyncratic drug reactions (IDR) that included hepatotoxicity (Larrey et al., Citation1986; Neftel et al., Citation1986), agranulocytosis (Rouveix et al., Citation1989), and aplastic anemia (Hatton et al., Citation1986). The mechanism of AQ-induced adverse reactions is currently not well understood, but AQ is metabolized to N-desethylamodiaquine (DEAQ) by CYP2C8 (Li et al., Citation2002), and both AQ or DEAQ can be oxidized to a reactive quinoneimine, which reacts with proteins to form covalent adducts (Maggs et al., Citation1987, Citation1988).
As with most drugs that cause idiosyncratic drug-induced liver injury (IDILI), the clinical characteristics of AQ-induced liver injury involve a delayed onset of several weeks, and the injury usually resolves despite continued treatment (Neftel et al., Citation1986). There is a prompt recurrence of liver injury upon rechallenge, which is consistent with immune memory. Histopathology shows necrosis and the presence of inflammatory cells including Kupffer cells (Larrey et al., Citation1986; Neftel et al., Citation1986). It has also been reported that there are circulating anti-AQ IgG antibodies in humans who developed a severe adverse reaction (Clarke et al., Citation1991), and anti-AQ antibodies were also observed in rats (Clarke et al., Citation1990). These observations suggest that the mechanism of AQ-induced IDILI is an immune-mediated reaction.
Although the clinical characteristics of AQ-induced liver injury and other drugs that are associated with IDILI suggest an immune mechanism, the lack of a valid animal model has hampered progress in understanding the molecular mechanism and factors that lead to the initiation of liver injury and liver failure. Recently, a model of AQ-induced hepatotoxicity has been reported (Shimizu et al., Citation2009). However, as with most animal models, this is an acute model of hepatotoxicity in which mice were treated with buthionine sulfoximine and AQ for up to 24 hours, and this resulted in an increase in alanine transaminase (ALT) levels. A similar study was reported in Swiss mice (Mishra et al., Citation2011). Because there is a delayed onset in liver injury in humans, it is likely that the mechanism of AQ-induced liver injury in humans is very different from these models. In this report we describe the development of an animal model of AQ-induced liver injury with a delayed onset that resolves despite continued treatment. This is similar to what often occurs in humans, i.e. the IDILI resolves despite continued treatment with the drug and mild IDILI is more common than severe IDILI.
Materials and methods
Mice and treatments
Mice (C57BL/6NCrl; 6–8-weeks-of-age) were purchased from Charles River Laboratories (Montreal, QC, Canada). T- and B-cell immunodeficient Rag−/− (Rag1tm1Mom/J; 6–8-weeks-of-age) mice were purchased from Jackson Laboratories (Bar Harbor, ME). All mice were housed in a specific pathogen-free environment maintained at 22 °C with a 30–70% relative humidity and a 12-h light/dark cycle. All mice had ad libitum access to filtered water. Upon arrival, all mice were allowed to acclimatize for 1 week before treatment. The University of Toronto animal care committee approved all protocols.
AQ was thoroughly mixed with food and given to rodents at a dose of 0.2% [w/w] in food. Food was provided to the animals (four mice/cage) in small jars ad libitum, and the average amount consumed was measured; this resulted in an AQ dose of ≈200–300 mg/kg/day. Liver enzyme activities were measured by collecting blood from the saphenous vein at baseline or every week, unless otherwise stated, during the course of the exposures. As biomarker of liver injury, the activity of alanine aminotransferase (ALT, Thermo Scientific, Middletown, VA) was measured (Metushi et al., Citation2012; Metushi & Uetrecht, Citation2013).
Serum concentration of AQ
Methanol (80 µl), including 0.1 µM of the internal standard 4-dimethylaminoantipyrene (Sigma, Oakville, ON), was added to 10 µl serum to precipitate proteins. The mixture was vortexed and stored at −20 °C for 30 min, then centrifuged at 13 200 × g for 10 min. The supernatant was evaporated to dryness under a gentle stream of nitrogen. Residues were dissolved in 100 µl of mobile phase, and a 20 µl aliquot was injected into the LC–MS/MS system consisting of a Shimadzu LC10 HPLC and a API3000 mass spectrometer (PE Sciex, Concord, ON, Canada). The HPLC column was a 2.1 mm × 50 mm Luna® C18 3 µm analytical column; mobile phase flow rate was 0.2 ml/min. The mobile phases used were 0.1% formic acid (Solvent A) and methanol (Solvent B) and were delivered using a linear gradient elution program of 5% methanol (Solvent B) at 0 min increasing to 90% Solvent B at 2.5 min. Optimization for multiple reaction monitoring transitions were performed using synthetic standards (Toronto Research Chemicals, Toronto, ON) for AQ (Q1/Q3: 356.1/283.2), DEAQ (Q1/Q3: 328.1/283.2) and internal standard (232.1/56.1). Data were collected and processed using Analyst 1.4.2 software (Applied Biosystems, Grand Island, NY).
Histology and immunohistochemistry
At various end-points over the course of the exposures, animals were euthanized by placement inside a CO2 chamber, after which their livers were removed, perfused, extracted, and then placed in 10% neutral buffered formalin solution (Sigma; Oakville, ON) overnight. For preparation of frozen sections, the liver tissue was placed in OCT medium (VWR International; Radnor, PA) and immediately frozen using liquid nitrogen. Paraffin and frozen section slides were cut and H&E stained by the Department of Pathology at the Hospital for Sick Children (University of Toronto).
Rat monoclonal primary antibodies against mouse CD11b (clone M1/70), F4/80 (clone CI:A3-1), CD45R (clone RA3-6B2), and rabbit polyclonal antibody against mouse KI67 were purchased from Abcam (Cambridge, MA). Dr P. Ohashi (Princess Margaret Hospital, University of Toronto) donated monoclonal antibodies against mouse CD4 (clone GK 1.5) and CD8 (clone YTS169). Rabbit anti-AQ produced in our laboratory, as previously described (Lobach & Uetrecht, Citation2014), was shown to be specific for AQ binding to macromolecules. Polyclonal rabbit secondary antibody anti-rat IgG-biotinylated and streptavidin-peroxidase were purchased from Dako (Burlington, ON) and goat anti-rabbit IgG-peroxidase from Sigma. Each experiment was repeated at least twice, and the signal was developed using 3,3′-diaminobenzidine for paraffin-embedded slides or NovaRed for frozen slides (Vector; Burlington, ON) with Mayer’s hematoxylin (Sigma) as counterstain. Paraffin-embedded slides were stained with antibodies against F4/80, CD45R, and KI-67. Antibodies against CD11b, CD4, and CD8 were used with frozen sections. Immunohistochemical grading was blinded, and the numbers of cells per field of view under a microscope were counted; at least two slices of tissue (3–6 mm2) were mounted on glass slides and cell numbers from five areas of each slice were counted.
Western blotting
The liver, spleen, gut (consisting of small and large intestine), and kidney were removed at necropsy, and each homogenized in the presence of protease inhibitors (Sigma) as previously described (Metushi et al., Citation2012) and centrifuged at 2500 × g (i.e., S2.5 fraction). Alternatively, in an independent experiment, the liver was removed, homogenized, and centrifuged at 9000 × g (referred to as S9 fraction). Protein concentration in each sample was measured using a bicinchoninic acid kit (Fisher Scientific; Ottawa, ON). From each sample, 10 µg of protein (for S2.5 fractions) and 20 µg protein (for S9 fraction) was loaded into dedicated lanes on an 8% SDS-PAGE gel and the proteins then separated by electrophoresis. Super-signal enhanced molecular weight marker was loaded onto one of the lanes (Fisher Scientific) to monitor sample progress. The resolved proteins were then electrotransferred onto a nitrocellulose membrane (BioRad, Mississauga, ON). After blocking to prevent non-specific binding, the membrane was incubated with rabbit anti-AQ (1:10 000 dilution; primary antibody) for 16–18 h at 4 °C; after washing away unbound primary antibody, the membrane was incubated with goat anti-rabbit IgG-peroxidase secondary antibody (1:10 000 dilution; Sigma) for 1–2 h at room temperature. For all studies, mouse monoclonal anti-GAPDH (Sigma) was used as loading control and detected using goat anti-mouse IgG-peroxidase (Jackson ImmunoResearch; West Grove, PA). Bound peroxidase was then visualized using Supersignal West Pico Chemiluminescent Substrate (Fisher Scientific). The blots were then scanned with a FluorChem FC2 imager (Alpha Innotech, Toronto, ON).
Flow cytometry
Mouse liver was perfused with cold phosphate-buffered saline (PBS, pH 7.4), removed, and crushed with a syringe plunger. The cells were suspended in 35% Percoll (GE Healthcare, Mississauga, ON) and passed through a 100-µm cell strainer. This material was then centrifuged at 1000 × g for 20 min and the lymphocytes at the bottom collected. The cells were then incubated in red cell lysis buffer for 5 min and washed with FACS buffer (10% fetal calf serum in PBS). Non-specific binding was blocked by incubating the cells with anti-mouse CD32 antibody (eBioscience, San Diego, CA). In addition, half of the spleen and five cervical lymph nodes collected from each mouse at necropsy were also analyzed. Single cell suspensions of the liver, spleen, and lymph nodes were prepared by passing each tissue through a 100-µm cell strainer using a syringe plunger. Following lymphocyte isolation, red cell lysis was performed followed by a second filtration through a 40-µm cell strainer. The remaining cells were re-suspended in 10% fetal calf serum in PBS buffer for cell counting and the number of lymphocytes counted using a Countless Automated Cell Counter by Invitrogen (Life Technologies, Grand Island, NY). From each suspension, 0.5 × 10⁶ cells were stained for surface markers using antibodies against mouse CD4-PECY7, CD69-APC, NKp46-eFluor450, streptavidin-PECY5 (eBioscience), CD8-APCCY7, CD279-APC (BD Biosciences, Mississauga, ON), NK1.1-FITC, CD62L-PE, CD44-Biotin, and CD152-Biotin (Sunnybrook Hospital, Toronto, ON); 4′,6′-diamidino-2-phenylindole (DAPI, Molecular Probe, Burlington, ON) was used as a live cell marker. Analyses were performed by gating first on the lymphocyte population; cell aggregates were gated out and live cells used for analysis by using DAPI viability dye by gating on the negative population. Results are reported as percentages and as total cell numbers, which were calculated by multiplying the percentage of each cell type by the total number of lymphocytes from each organ (corrected for organ weight), with the exception of cervical lymph nodes for which a total of five nodes from each host were used for cell counting.
Natural killer cell depletion
Depletion of NK cells was performed by intraperitoneal injection of 200 µg/mouse of anti-NK1.1 antibody (clone PK136) diluted in sterile PBS at −3 and −1 days before drug initiation, as described in Lang et al. (Citation2012), or IgG1 isotype control diluted in PBS (both from Sunnybrook Hospital, Toronto, ON). Control mice were injected with PBS only. The drug was started at Day 0, and injection of anti-NK1.1 antibody, IgG1 isotype, or PBS was repeated every week to maintain suppressed NK activity (Koo et al., Citation1986). Administration of this anti-NK1.1 antibody has been previously shown to deplete NK and NKT cells (Masson et al., Citation2008). In our laboratory, injection with anti-NK1.1 antibody depletes NK and NKT cells in the liver, spleen, blood, and cervical lymph nodes; depletion of NK cells was also confirmed by staining with anti-NKP46 antibody (another cellular marker for NK cells; data not shown).
Serum cytokines
Female C57BL/6 mice were treated with AQ for 1, 3, or 7 weeks. Blood was collected at the end of each timepoint by euthanizing the mice in a CO2 chamber. The harvested blood was allowed to clot for 30 min at room temperature, and then centrifuged at 2000 × g for 10 min at 4 °C to isolate the serum. Cytokines were ultimately measured in 25 µl serum using a BioRad BioPlex Pro Mouse Cytokine 23-plex, as per manufacturer instructions. The cytokines assessed included: interleukin (IL)-1α, -1β, -2, -3, -4, -5, -6, -9, -10, -12 (p40), -12 (p70), -13, and-17A, as well as eotaxin, G-CSF, GM-CSF, interferon (IFN)-γ, KC (CXCL1), MCP-1 (MCAF), MIP-1α, MIP-1β, RANTES, and tumor necrosis factor (TNF)-α.
Statistical analysis
Statistical analyses were performed using GraphPad Prism (GraphPad Software, San Diego, CA). Data were analyzed using two-way analysis of variance (ANOVA) or Mann-Whitney U-test. All p values < 0.05 were considered significant (*p < 0.05, **p < 0.01, ***p < 0.001).
Results
Treatment of female C57BL/6 mice with AQ results in mild liver injury with delayed onset
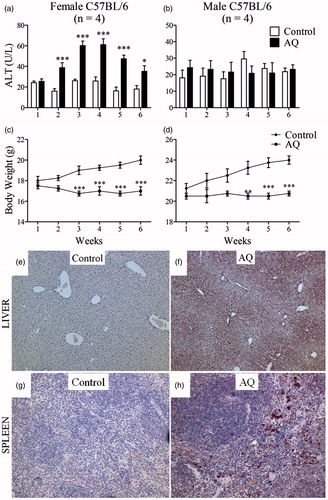
Treatment of female C57BL/6 mice with AQ resulted in a mild increase in ALT, which had a delayed onset of at least 1 week and resolved despite continued treatment (). The ALT peak was the highest between 3–4 weeks and had returned to almost normal by Week 6. There was no increase in ALT in male C57BL/6 mice (). In general, mice that were treated with AQ in food did not eat as much food as control mice, but their body weight remained stable throughout the treatment (). The liver histology of female mice did not show signs of significant abnormalities at the end of 6 weeks (data not shown); it is likely that this is because the injury is mild and resolves despite continued treatment. AQ has a long terminal half-life; the serum concentration of AQ in female mice was ∼250–300 ng/ml (Table S1), which is within the range of the plasma AQ concentrations found in humans after intravenous dosing (CAQ = 80–800 ng/ml) (White et al., Citation1987). Female mice had higher serum concentrations of AQ (2.5-fold higher) and DEAQ (3.7-fold higher) than male mice (Table S1); this corresponded to the greater extent of liver injury in female mice. Serum concentrations of AQ were somewhat higher at Week 1 than at Weeks 3 or 7 (Table S1); thus, the delay in injury cannot be explained by accumulation of AQ.
Figure 1. Treatment of C57BL/6 mice with AQ results in mild liver injury. (a) Serum ALT in female or (b) male mice treated with AQ for up to 6 weeks. (c, d) Body weight of mice in (a) and (b). (e) Covalent binding of AQ in liver of a control female C57BL/6 mouse or (f) treated with AQ for 3 weeks. (g, h) Covalent binding in spleens of the same mice (20× magnification). For covalent binding studies, figures are representative of four animals/group. Values shown are mean ± SE. Analyzed for statistical significance by two-way ANOVA; p values < 0.05 were considered significant (*p < 0.05; **p < 0.01; ***p < 0.001).
Covalent binding of AQ in the liver, spleen, gut, and kidney
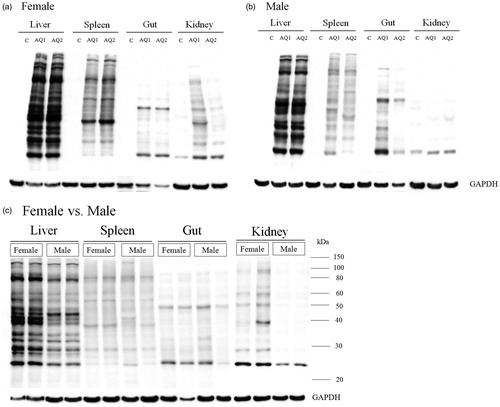
AQ covalently binds proteins in the liver (Shimizu et al., Citation2009). An anti-AQ antibody was used here to evaluate the extent of covalent binding in different tissues. Covalent binding in the liver was greater in the centrilobular region (), an outcome that correlates with the highest concentrations of cytochromes P450; this is similar to what was observed with other drugs such as isoniazid (Metushi et al., Citation2012). AQ was also found to bind in the red pulp of the spleen that contains antigen-presenting cells (APC; ). The relationship between ALT elevation and covalent binding in the liver was also examined. Both in female and male mice, AQ covalent binding in the liver was significant at Day 1 and appeared slightly greater on Day 3, but there was no significant increase in binding after that (). In an independent experiment we examined covalent binding of AQ in the liver of female mice in the S9 fraction of liver homogenate, and covalent binding peaked after Day 2 (Supplemental Figure 1; Figure S1). Covalent binding in the gut was never very high and did not increase after Day 3 (); covalent binding in the spleen and kidney continued to increase past 1 week. A comparison of covalent binding between different tissues revealed that the greatest covalent binding occurred in the liver, followed by the spleen, kidney, and gut (). AQ covalent binding was greater in the liver and kidney of female compared to male mice, but there did not appear to be any difference in covalent binding in the spleen and gut ().
Figure 2. Covalent binding of AQ. Binding in the liver, spleen, gut, and kidney of (a) female and (b) male C57BL/6 mice (n = 2) as a function of time. Mice were treated for 5 weeks with AQ (0.2% [w/w] in food). The covalent binding to proteins in the S2.5 fraction was determined on Western blots with antibodies that recognize AQ bound to proteins as described in the Methods section. The same amount of protein was loaded in each lane so that the binding could be compared between different treatment durations.
![Figure 2. Covalent binding of AQ. Binding in the liver, spleen, gut, and kidney of (a) female and (b) male C57BL/6 mice (n = 2) as a function of time. Mice were treated for 5 weeks with AQ (0.2% [w/w] in food). The covalent binding to proteins in the S2.5 fraction was determined on Western blots with antibodies that recognize AQ bound to proteins as described in the Methods section. The same amount of protein was loaded in each lane so that the binding could be compared between different treatment durations.](/cms/asset/e111fb1f-11ad-4629-8257-24032962803b/iimt_a_934977_f0002_b.jpg)
Figure 3. Comparison of AQ covalent binding. Binding in the liver, spleen, gut, and kidney (n = 2) of (a) female or (b) male C57BL/6 mice. (c) Comparison of AQ covalent binding between female and male C57BL/6 mice (under the same conditions and on the same blot). The methods are the same as described in the legend for . The timepoint is 5 weeks.
Increase in ALT is associated with lymphocyte infiltration in the liver
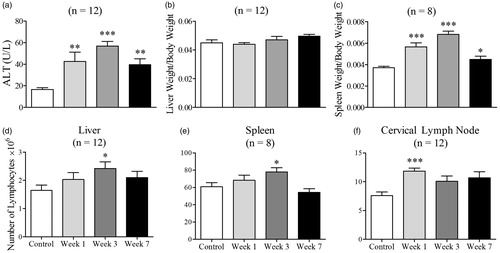
To determine whether the increase in ALT was associated with an immune response, lymphocyte infiltration into the liver, spleen, and cervical lymph nodes was examined. The greatest increase in ALT was observed at Weeks 3–4 (). Consequently, to determine the immune response before, during, and after the timepoint of maximal ALT elevation, mice were sacrificed at Weeks 1, 3, and 7. ALT activity was highest at Week 3, followed by at Weeks 1 and 7 (). Liver weights of the control and AQ-treated mice were similar (), but the total number of lymphocytes isolated from the liver of AQ-treated mice was highest at Week 3 (), which coincides with the greatest increase in ALT. The spleen weight of the AQ-treated mice was greatest at Week 3 but decreased after that time (). The number of lymphocytes associated with the AQ-treated mice was highest at Week 1 in the cervical lymph nodes and at Week 3 in the spleen ().
Figure 4. ALT, liver and spleen weight, and total lymphocyte numbers in female C57BL/6 mice treated with AQ. (a) ALT activity after treatment with AQ for 1, 3, or 7 weeks. (b, c) Liver and spleen weights divided by body weights of control or AQ-treated animals from (a). (d–f) Total number of lymphocytes of control or AQ-treated animals from (a). The number of lymphocytes was adjusted for liver and spleen weight, and a total of five lymph nodes were isolated/mouse. Values shown are mean ± SE. Analyzed for statistical significance versus control by Mann-Whitney U-test; p values <0.05 were considered significant (*p < 0.05; **p < 0.01; ***p < 0.001).
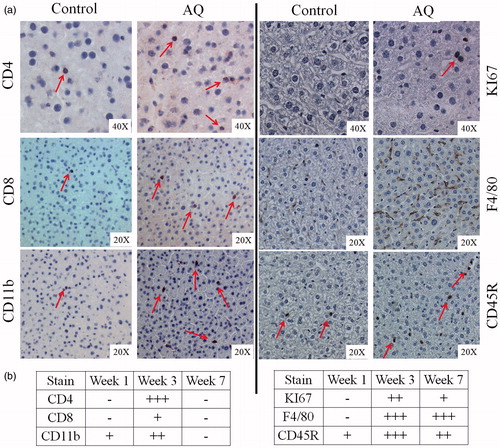
Immunohistochemical analysis revealed an increase in immune cells staining positive for CD4, CD8, CD11b, F4/80, and CD45R in livers of mice treated with AQ, as well as increased cell proliferation as determined by cells that stained positive for KI67 (). The increase in cell numbers was greatest at Week 3—except for F4/80 cells that remained elevated at Week 7 (). The grading of immunohistochemistry is shown in Figure S2. In the spleen, an increase in cells staining for CD11b, KI67, F4/80, and CD45R in the red pulp (Figures S3 and S4) was observed. Most of these changes were apparent between Week 1 and 3 (data not shown), with the exception for KI67 that increased only at Weeks 3 and 7 and not on Week 1 (data not shown for all slides).
Figure 5. Immunohistochemical staining of livers from female C57BL/6 mice. (a) Staining for CD4, CD8, CD11b, KI67, F4/80, or CD45R. (b) Grading of the number of cells in (a); grading is based on the results of statistical analysis from Figure S2. Figures are representative of four animals/group. For illustration purposes, slides from mice treated with AQ for 3 weeks are shown as they showed the greatest changes.
Increase in ALT is associated with activation of T-cells
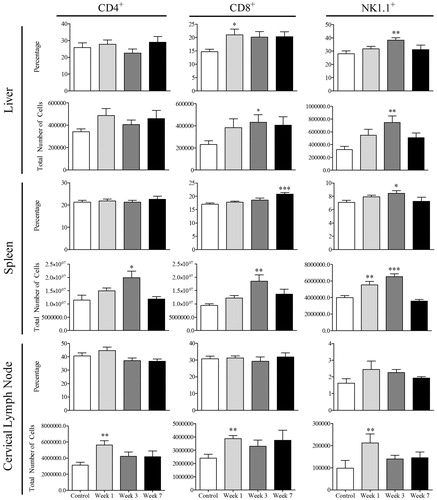
In addition to immunohistochemistry, flow cytometry was used to quantify lymphocyte infiltration and activation. No major changes were detected in the number of CD4+ T-cells in the livers of AQ-treated mice, but there was an increase in total number of CD4+ T-cells in cervical lymph nodes at Week 1 and in the spleen at Week 3 (). Moreover, an increase in the percentage and total CD8+ and NK1.1+ cells was observed in the liver of these hosts at Weeks 1 and 3 (). In addition, an increase in CD8+ and NK1.1+ cells was also apparent in the cervical lymph nodes at Week 1 and in the spleen at Week 3 ().
Figure 6. Lymphocyte phenotyping for CD4, CD8, and NK1.1. Control mice (n = 8) or mice treated with AQ for 1, 3, or 7 weeks (n = 8). Values shown are mean ± SE. Analyzed for statistical significance versus control by Mann-Whitney U-test; p values < 0.05 were considered significant (*p < 0.05; **p < 0.01; ***p < 0.001).
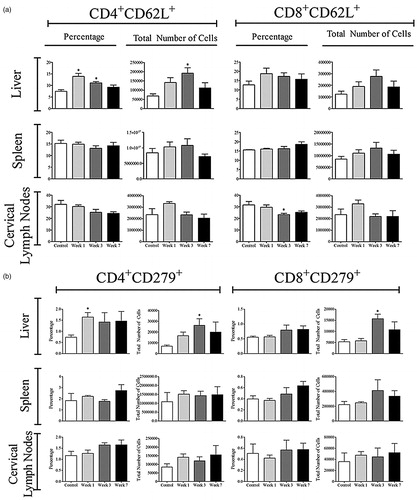
The number of activated CD4+ and CD8+ T-cells was determined by staining for CD62L, CD44, and CD69 (Bjorkdahl et al., Citation2003; Chao et al., Citation1997; Ziegler et al., Citation1994). No significant increase in the total number of activated CD4+ cells in the liver was observed in the AQ-treated hosts (); in fact, the percentage of activated CD4+ cells decreased (Figure S5). However, an increase in the activation of CD4+ cells in the spleen and cervical lymph nodes was noted at Week 1 (, Figure S5). A greater increase was seen in the total number of activated CD8+ cells in the liver, followed by trends that suggest activation in the spleen and cervical lymph nodes of the AQ-treated mice (). The percentage of CD8+ activated lymphocytes in the liver also increased (Figure S6). Further analysis of CD4 T-cells revealed that there was an increase in CD4+CD62L+ T cells in the liver at Weeks 1 and 3, which could be characterized as central memory T-cells () with no significant increase in CD8+CD62L+ cells observed (data not shown). In addition, there was an increase in the percentage and total number of cells that stained positive for CD279 (otherwise known as PD-1) in the liver (), suggesting induction of immune tolerance. Of note, no changes in the surface expression of CD152 (known as CTLA-4) were observed (data not shown).
Figure 7. Lymphocyte activation in AQ-treated mice. Cells were from control (n = 4) or mice treated with AQ (n = 4) for 1, 3, or 7 weeks. Values shown are mean ± SE. Analyzed for statistical significance versus control by Mann-Whitney U-test; p values < 0.05 were considered significant (*p < 0.05; **p < 0.01; ***p < 0.001).
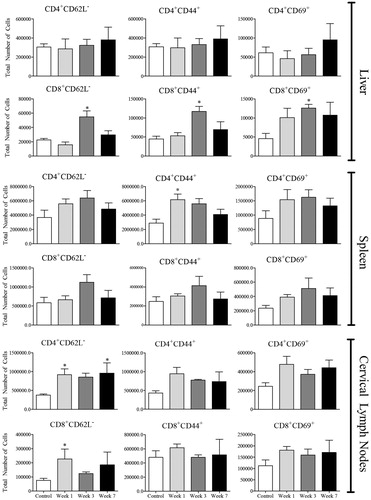
Figure 8. Expression of CD62L+ and PD-1+ (CD279) on T-cells. Cells were from control (n = 4) or mice treated with AQ (n = 4) for 1, 3, or 7 weeks. Values shown are mean ± SE. Analyzed for statistical significance versus control by Mann-Whitney U-test; p values < 0.05 were considered significant (*p < 0.05; **p < 0.01; ***p < 0.001).
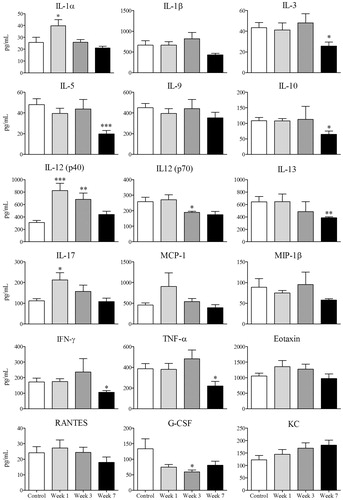
Serum cytokines such as IL-1α, IL-12 (p40), and IL-17 increased at Week 1 in the AQ-treated hosts (). However, a general trend suggested that most serum cytokines followed the pattern of ALT; by Week 7 there was a down-regulation that was significant for a variety of cytokines including IL-3, IL-5, IL-10, IL-12(p70), IL-13, IFNγ, TNFα, and G-CSF ().
Figure 9. Serum cytokine concentrations. Levels in serum of control (n = 8) or mice treated with AQ (n = 8) for 1, 3, or 7 weeks. Values shown are mean ± SE. Analyzed for statistical significance versus control by Mann-Whitney U-test; p values < 0.05 were considered significant (*p < 0.05; **p < 0.01; ***p < 0.001).
Treatment of Rag1−/− mice and depletion of NK cells
To determine whether the adaptive immune system was involved in the pathogenesis of liver injury in this model, Rag1−/− mice (B- and T-cell deficient) were treated with AQ. In preliminary experiments, an increase in ALT was noted in wild-type (WT) and Rag1−/− mice (Figure S6A); by Week 5, the ALT appeared higher in the Rag1−/− mice. The covalent binding of AQ in the liver of Rag1−/− mice was equal to that of WT mice (Figure S6B), an outcome that suggested Rag1−/− mice may have impaired immune tolerance at later timepoints. We then monitored ALT activities in C57BL/6 or Rag1−/− mice for up to 11 weeks and found ALT was consistently higher in Rag1−/− mice. However, these mice did not progress to liver failure (). Covalent binding of AQ in the liver at Week 11 was similar between WT and Rag1−/− mice, suggesting that covalent binding was not the reason for the differences in ALT (). An increase was observed in NK cell numbers () and IL-12 levels (), the latter which is produced by activated macrophages and can activate NK cells. Consequently, the role of NK cells in this model was investigated. Upon depletion of NK cells, there was a significant attenuation of AQ-induced ALT elevation compared to the isotype-treated controls, but there was no difference in the covalent binding of AQ in the liver ().
Figure 10. Liver injury in AQ-treated Rag−/− mice or mice treated with an anti-NK cell antibody. (a) ALT activity in C57BL/6 or Rag−/− mice treated with AQ for up to 11 weeks. (b) Western blot showing covalent binding of AQ to the S9 liver fraction from mice in (a). (c) ALT activity in female C57BL/6 mice. Control = untreated mice but injected with PBS on the same schedule as anti-NK1.1 antibody. IgG Isotype + AQ = mice that were injected with IgG isotype control while being treated with AQ at 0.2% [w/w] in food for up to 3 weeks. Anti-NK1.1 + AQ = mice were injected with anti-NK1.1 antibody (as described in Methods) while receiving AQ at 0.2% [w/w] in food for up to 3 weeks. ALT levels were similar to control when mice were injected with anti-NK1.1 antibody alone (data not shown). (d) Western blotting showing covalent binding of AQ in the liver of mice at the end of 3 weeks. Quantification of AQ covalent binding expressed as relative intensity (and corrected for GAPDH) was performed for both (b) and (d), but there were no differences between groups (data not shown). For (a) and (c), values shown are mean ± SE. Analyzed for statistical significance using two-way ANOVA; p values < 0.05 were considered significant (#or*p < 0.05; **p < 0.01; ***p < 0.001; * = significantly different from control; # = significantly different from AW-treated groups).
![Figure 10. Liver injury in AQ-treated Rag−/− mice or mice treated with an anti-NK cell antibody. (a) ALT activity in C57BL/6 or Rag−/− mice treated with AQ for up to 11 weeks. (b) Western blot showing covalent binding of AQ to the S9 liver fraction from mice in (a). (c) ALT activity in female C57BL/6 mice. Control = untreated mice but injected with PBS on the same schedule as anti-NK1.1 antibody. IgG Isotype + AQ = mice that were injected with IgG isotype control while being treated with AQ at 0.2% [w/w] in food for up to 3 weeks. Anti-NK1.1 + AQ = mice were injected with anti-NK1.1 antibody (as described in Methods) while receiving AQ at 0.2% [w/w] in food for up to 3 weeks. ALT levels were similar to control when mice were injected with anti-NK1.1 antibody alone (data not shown). (d) Western blotting showing covalent binding of AQ in the liver of mice at the end of 3 weeks. Quantification of AQ covalent binding expressed as relative intensity (and corrected for GAPDH) was performed for both (b) and (d), but there were no differences between groups (data not shown). For (a) and (c), values shown are mean ± SE. Analyzed for statistical significance using two-way ANOVA; p values < 0.05 were considered significant (#or*p < 0.05; **p < 0.01; ***p < 0.001; * = significantly different from control; # = significantly different from AW-treated groups).](/cms/asset/ec9ba658-c448-439a-a770-34a4577a75c7/iimt_a_934977_f0010_b.jpg)
Discussion
IDILI is a significant problem because it is associated with significant patient mortality (Bjornsson, Citation2010) and can lead to the withdrawal of an otherwise useful drug (Senior, Citation2007). It will be difficult to effectively deal with the problem without a better mechanistic understanding. A major impediment to a better mechanistic understanding of IDILI is the lack of valid animal models that could be used to test hypotheses. To be a valid animal model it must mimic the IDILI that occurs in humans. This includes a delay in the onset of liver injury for at least 1 week (Ng et al., Citation2012) and a liver histology that consists of mononuclear inflammatory infiltrates (consisting mostly of CD8+ T-cells and macrophages) that ultimately lead to hepatocyte necrosis (Foureau et al., Citation2012). If a drug can cause idiosyncratic liver failure, it is always associated with a higher incidence of mild IDILI, which often resolves despite continued treatment with the drug; this is referred to as adaptation (Watkins, Citation2005).
In this paper, we describe the successful development of an animal model (female C57BL/6) of AQ-induced liver injury, which has a delayed onset and resolves despite continued treatment. The delayed onset in this animal model is similar to the IDILI caused by most drugs that induce idiosyncratic drug reactions (Bjornsson, Citation2010; Uetrecht, Citation2009). Liver injury occurred only in female mice. This is most easily explained by the higher blood levels of AQ and DEAQ in female mice. Greater AQ covalent binding was also detected in the liver of female mice compared to male mice. The greater injury in female mice was consistent with the observation that women appear more susceptible to most forms of IDILI (De Valle et al., Citation2006; Sgro et al., Citation2002), especially when liver injury is more severe as in the case of fulminant hepatic failure (Lucena et al., Citation2009; Metushi et al., Citation2013; Russo et al., Citation2004). Covalent binding of AQ occurred in the liver as well as in the spleen, kidney, and gut; however, the highest amount of covalent binding was observed in the liver, the target organ of the injury. AQ covalent binding in the liver plateaued after 3 days of treatment; however, the liver injury was not evident until after 1–2 weeks of treatment, and peaked at 3 weeks. This disconnect between the rapid covalent binding but delayed onset of liver injury is consistent with a mechanism in which the covalent binding does not directly cause the liver injury, but instead initiates an immune response that results in liver injury. Coincident with an increase in ALT, an infiltration of T-cells, B-cells, macrophages, and dendritic cells in the liver and spleen was observed. In addition, AQ treatment resulted in an increase in the size of the spleen and lymphocyte infiltrates in the liver, spleen, and cervical lymph nodes. Taken together, these data indicated an immune response. Furthermore, the increase in the number of lymphocytes in lymph nodes appeared to precede the increase in the spleen and liver. This was in line with an immune response causing the injury rather than being a response to the injury (Bowen et al., Citation2005).
The dominant immune cell infiltrating the livers of patients with drug-induced liver failure are CD8+ cells (Foureau et al., Citation2012). We determined the phenotype of infiltrating CD4+ and CD8+ T-cells by using a variety of activation markers such as CD62L, CD44, and CD69 (Ziegler et al., Citation1994). Overall, it was shown that the greatest cell activation in the liver occurred in CD8+ T-cells. An increase in the number and activation of CD4+ cells in the spleen and cervical lymph nodes, but not in the liver, was also detected. These results suggested an immune response in the spleen and lymph nodes involving helper T-cells. In addition, an increase in CD4+ central memory (TCM) T-cells (defined as CD62L+) and an increase in CD8+ effector memory (TEM) cells (defined as CD62L−) was observed in the liver that could be involved in the resolution of liver injury (Bowen et al., Citation2005; Sallusto et al., Citation2004; Yang et al., Citation2011). Consistent with these findings we found the increase in CD8+CD44+ cells in the liver and in the spleen. Although CD44 (a cell-adhesion molecule that binds to hyaluronan) is commonly used as a marker of activation (Pure & Cuff, Citation2001; Siegelman et al., Citation1999), recently CD44 has been implicated in leukocyte recruitment to inflammatory areas and resolution of inflammation in models of hepatitis (Johnson & Ruffell, Citation2009). This is consistent with the fact that studies with acetaminophen and carbon tetrachloride revealed that the lack of CD44 gene exacerbated liver injury in animals and humans, as reviewed elsewhere (Tujios & Fontana, Citation2011). In the present study, the greatest increase in CD44+ liver lymphocytes was observed at Week 3 and could be involved in the resolution of liver injury. The data clearly shows activation of CD8 T-cells in the liver. If the role of these CD8 T-cells were pathogenic, then one would expect that Rag1−/− mice that are B- and T-cell deficient would not develop an increase in ALT. The fact that Rag1−/− mice showed a greater increase in ALT suggests that the adaptive immune system may play a more important role in induction of immune tolerance than injury in this model. Consistent with induction of tolerance by the adaptive immune system is the fact that the delayed onset of ALT was followed by a resolution in injury and with a decrease in the number of most cell types in the liver except for macrophages, which are classically involved in the repair of injury (Singer & Clark, Citation1999). In addition, the resolution of liver injury was preceded by an increase in hepatic T-cells (both CD4+ and CD8+) that stained positive for PD-1, a molecule involved in immune tolerance (Pardoll, Citation2012). Additional data here that support the hypothesis of immune tolerance included decreases detected at Week 7 in levels of pro-inflammatory cytokines such as IL-12, TNFα, IFNγ, IL-5, and IL-1β.
This is not a model of idiosyncratic drug-induced liver failure, but it does mimic the mild liver injury that is more common than liver failure and usually has a delayed onset with resolution despite continued treatment with the drug. Although the peak ALT was not very high, in general the ALT is not as high in chronic liver injury as it is in acute injury. Thus, these data suggest that IDILI may be initiated with a sequence of events, starting with bioactivation of AQ and covalent binding. This appears to trigger an immune response by activated helper T-cells migrating to lymph nodes (and to a lesser extent the spleen) within the first week. This is followed by an increase in serum inflammatory cytokines (IL-1α, Il-12 and IL-17) and an early increase in CD8+ T-cells in the liver. Given the observation that the injury is greater in Rag1−/− mice and that there was an increase in PD-1+ T-cells in the liver (both CD4+ and CD8+), with the ultimate result that the injury resolved, this appears to represent the more common response of humans to a drug that can cause IDILI; namely, immune tolerance. The protective effect of anti-NK1.1 antibodies provided clear evidence that NK cells—a major cell type in the liver and implicated in other types of liver injury (Tian et al., Citation2013)—mediated much of the liver injury in this model. However, the major cell type found in the liver of patients with IDILI resulting in liver failure is the CD8+ T-cell (Foureau et al., Citation2012). In this model both innate and adaptive immune cells were involved. It is plausible that the initial liver injury in humans is also mediated by NK cells, but this usually resolves with immune tolerance; it is only if immune tolerance fails that cytotoxic CD8+ T-cells become the dominant cell responsible for serious liver injury. In conclusion, this model provides investigators with a unique opportunity to study an immune response to a drug that causes significant IDILI in humans.
Supplementary material available online. Supplementary Figures and Tables
Declaration of interest
The authors report no conflicts of interest. The authors alone are responsible for the content and writing of the paper.
This work is supported by grants from the Canadian Institutes of Health Research. Jack Uetrecht holds the Canadian chair in Adverse Drug Reactions. Imir G. Metushi is a trainee of the Drug Safety and Effectiveness Cross Disciplinary Training Program, which is funded by CIHR.
References
- Bjorkdahl, O., Barber, K. A., Brett, S. J., et al. 2003. Characterization of CC-chemokine receptor 7 expression on murine T-cells in lymphoid tissues. Immunology 110:170–179
- Bjornsson, E. 2010. Review article: Drug-induced liver injury in clinical practice. Aliment Pharmacol. Ther. 32:3–13
- Bowen, D. G., Mccaughan, G. W., and Bertolino, P. 2005. Intrahepatic immunity: A tale of two sites? Trends Immunol. 26:512–517
- Chao, C. C., Jensen, R., and Dailey, M. O. 1997. Mechanisms of L-selectin regulation by activated T-cells. J. Immunol. 159:1686–1694
- Clarke, J. B., Maggs, J. L., Kitteringham, N. R., and Park, B. K. 1990. Immunogenicity of amodiaquine in the rat. Int. Arch. Allergy Appl. Immunol. 91:335–342
- Clarke, J. B., Neftel, K., Kitteringham, N. R., and Park, B. K. 1991. Detection of antidrug IgG antibodies in patients with adverse drug reactions to amodiaquine. Int. Arch. Allergy Appl. Immunol. 95:369–375
- De Valle, M. B., Av Klinteberg, V., Alem, N., et al. 2006. Drug-induced liver injury in a Swedish University hospital out-patient hepatology clinic. Aliment Pharmacol. Ther. 24:1187–1195
- Foureau, D. M., Walling, T. L., Kleiner, D. E., et al. 2012. Profiles of leukocytes infiltrating livers of subjects with drug-induced liver injury (DILI). Hepatology 56:596A (Abstract #827)
- Hatton, C. S., Peto, T. E., Bunch, C., et al. 1986. Frequency of severe neutropenia associated with amodiaquine prophylaxis against malaria. Lancet 1:411–414
- Johnson, P., and Ruffell, B. 2009. CD44 and its role in inflammation and inflammatory diseases. Inflamm. Allergy Drug Targets 8:208–220
- Koo, G. C., Dumont, F. J., Tutt, M., et al. 1986. The NK-1.1− mouse: A model to study differentiation of murine NK cells. J. Immunol. 137:3742–3747
- Lang, P. A., Lang, K. S., Xu, H. C., et al. 2012. Natural killer cell activation enhances immune pathology and promotes chronic infection by limiting CD8+ T-cell immunity. Proc. Natl. Acad. Sci. USA 109:1210–1215
- Larrey, D., Castot, A., Pessayre, D., et al. 1986. Amodiaquine-induced hepatitis. A report of seven cases. Ann. Int. Med. 104:801–803
- Li, X. Q., Bjorkman, A., Andersson, T. B., et al. 2002. Amodiaquine clearance and its metabolism to N-desethylamodiaquine is mediated by CYP2C8: A new high affinity and turnover enzyme-specific probe substrate. J. Pharmacol. Exp. Ther. 300:399–407
- Lobach, A., and Uetrecht, J. 2014. Involvement of myeloperoxidase and NADPH oxidase in the covalent binding of amodiaquine and clozapine to neutrophils: Implications for drug-induced agranulocytosis. Chem. Res. Toxicol. 27:699–709
- Lucena, M. I., Andrade, R. J., Kaplowitz, N., et al. 2009. Phenotypic characterization of idiosyncratic drug-induced liver injury: Influence of age and sex. Hepatology 49:2001–2009
- Maggs, J. L., Kitteringham, N. R., Breckenridge, A. M., and Park, B. K. 1987. Autoxidative formation of a chemically-reactive intermediate from amodiaquine, a myelotoxin and hepato-toxin in man. Biochem. Pharmacol. 36:2061–2062
- Maggs, J. L., Tingle, M. D., Kitteringham, N. R., and Park, B. K. 1988. Drug-protein conjugates– XIV. Mechanisms of formation of protein-arylating intermediates from amodiaquine, a myelotoxin and hepatotoxin in man. Biochem. Pharmacol. 37:303–311
- Masson, M. J., Carpenter, L. D., Graf, M. L., and Pohl, L. R. 2008. Pathogenic role of natural killer T- and natural killer cells in acetaminophen-induced liver injury in mice is dependent on the presence of dimethyl sulfoxide. Hepatology 48:889–897
- Metushi, I. G., Nakagawa, T., and Uetrecht, J. 2012. Direct oxidation and covalent binding of isoniazid to rodent liver and human hepatic microsomes: Humans are more like mice than rats. Chem. Res. Toxicol. 25:2567–2576
- Metushi, I. G., Sanders, C., Lee, W. M., and Uetrecht, J. 2013. Detection of anti-isoniazid and anti-cyp antibodies in patients with isoniazid-induced liver failure. Hepatology 59:1084–1093
- Metushi, I. G., and Uetrecht, J. (2013). Isoniazid-induced liver injury and immune response in mice. J. Immunotoxicol. (Epub ahead of print)
- Mishra, S. K., Singh, P., and Rath, S. K. 2011. A study of toxicity and differential gene expression in murine liver following exposure to anti-malarial drugs: Amodiaquine and sulphadoxine-pyrimethamine. Malaria J. 10:109
- Neftel, K. A., Woodtly, W., Schmid, M., et al. 1986. Amodiaquine induced agranulocytosis and liver damage. Br. Med. J. 292:721–723
- Ng, W., Lobach, A. R., Zhu, X., et al. 2012. Animal models of idiosyncratic drug reactions. Adv. Pharmacol. 63:81–135
- Pardoll, D. M. 2012. The blockade of immune checkpoints in cancer immunotherapy. Nat. Rev. Cancer 12:252–264
- Pure, E., and Cuff, C. A. 2001. A crucial role for CD44 in inflammation. Trends Mol. Med. 7:213–221
- Rouveix, B., Coulombel, L., Aymard, J. P., et al. 1989. Amodiaquine-induced immune agranulocytosis. Br. J. Hematol. 71:7–11
- Russo, M. W., Galanko, J. A., Shrestha, R., et al. 2004. Liver transplantation for acute liver failure from drug induced liver injury in the United States. Liver Transplant. 10:1018–1023
- Sallusto, F., Geginat, J., and Lanzavecchia, A. 2004. Central memory and effector memory T-cell subsets: Function, generation, and maintenance. Annu. Rev. Immunol. 22:745–763
- Senior, J. R. 2007. Drug hepatotoxicity from a regulatory perspective. Clin. Liver Dis. 11:507–524
- Sgro, C., Clinard, F., Ouazir, K., et al. 2002. Incidence of drug-induced hepatic injuries: A French population-based study. Hepatology 36:451–455
- Shimizu, S., Atsumi, R., Itokawa, K., et al. 2009. Metabolism-dependent hepatotoxicity of amodiaquine in glutathione-depleted mice. Arch. Toxicol. 83:701–707
- Siegelman, M. H., Degrendele, H. C., and Estess, P. 1999. Activation and interaction of CD44 and hyaluronan in immunological systems. J. Leukocyte Biol. 66:315–321
- Singer, A. J., and Clark, R. A. 1999. Cutaneous wound healing. New Engl. J. Med. 341:738–746
- Tian, Z., Chen, Y., and Gao, B. 2013. Natural killer cells in liver disease. Hepatology 57:1654–1662
- Tujios, S., and Fontana, R. J. 2011. Mechanisms of drug-induced liver injury: From bedside to bench. Nat. Rev. Gastroenterol. Hepatol. 8:202–211
- Uetrecht, J. 2009. Immunoallergic drug-induced liver injury in humans. Sem. Liver Dis. 29:383–392
- Watkins, P. B. 2005. Idiosyncratic liver injury: Challenges and approaches. Toxicol. Pathol. 33:1–5
- White, N. J., Looareesuwan, S., Edwards, G., et al. 1987. Pharmacokinetics of intravenous amodiaquine. Br. J. Clin. Pharmacol. 23:127–135
- Yang, S., Liu, F., Wang, Q. J., et al. 2011. The shedding of CD62L (L-selectin) regulates the acquisition of lytic activity in human tumor reactive T-lymphocytes. PLoS One 6:e22560
- Ziegler, S. F., Ramsdell, F., and Alderson, M. R. 1994. The activation antigen CD69. Stem Cells 12:456–465