
Abstract
Aflatoxins (AF) are important foodborne mycotoxins implicated in human health and have immunocytotoxic effects. The aims of this study were to evaluate a new aflatoxin B1 (AFB1) and fumonisin B1 (FB1)-binding/degrading micro-organism for biological detoxification, to examine its ability to degrade AFB1 and FB1 in liquid medium, and to evaluate its potential in vivo protective role against any combined effects from AFB1 and FB1 on host splenocyte caspase-3 activity (reflecting DNA damage/cell death) and mRNA levels of select inflammation-regulating cytokines. Balb/c mice were divided into groups (10/group) and treated daily for 2 weeks by oral gavage with AFB1 (80 µg/kg BW), FB1 (100 µg/kg), AFB1 + FB1, or lactic acid bacteria (Lactobacillus paracasei BEJ01, 2 × 10⁹ CFU/L, ∼2 mg/kg) – alone or in combination with the AFB1 and/or FB1. After the exposures, spleens were collected for measures of caspase-3 activity, lipid peroxidation (LP), and glutathione (GSH) content, expression of anti-oxidation protective enzymes (GPx and SOD), and mRNA levels of inflammation-regulating cytokines (e.g. IL-10, IL-4, IFNγ, TNFα). Thymii were also removed for analysis of apoptosis. The results indicated that, in the spleen, exposure to the mycotoxins led to increased caspase-3 activity, LP, and IL-10 and IL-4 mRNA levels, but decreased GSH content and down-regulated expression of GPx and SOD, and of IFNγ and TNFα mRNA. Co-treatment using Lactic Acid Bacteria (LAB) with AFB1 or FB1 suppressed levels of DNA fragmentation, normalized splenic LP and increased GSH levels, up-regulated expression of GPx and SOD, and normalized mRNA levels of the analyzed cytokines. It is concluded that AFB1 and FB1 might have combinational (synergistic moreso than additive) toxic effects in situ. Further, it can be seen that use of LAB induced protective effects against the oxidative stress and (immuno)toxicity of these agents in part through adhesion (and so likely diminished bioavalability).
Introduction
Several toxigenic fungi strains produce toxic compounds in foods and feeds (Bryden, Citation2007) that ultimately cause health problems in animals and humans (Bennett & Klich, Citation2003). The bulk of our knowledge regarding adverse effects of naturally occurring mutagens/carcinogens and their possible effects on human health was obtained by investigating biological effects of purified compounds in experimental animals. In contrast, little is known about the interaction of complex mixtures in biological systems. A single compound may affect different reactions within one biological system, while it may also exhibit additive, antagonistic, or synergistic interactions with other compounds (Carpenter et al., Citation1998). The co-occurrence of mycotoxins, together with various endogenous and exogenous risk factors such as nutrition, viral infections, alcohol, and tobacco that may modulate cell proliferation and drug metabolism, are known to act synergistically with respect to the development of cancer in animals and possibly in humans (Yu et al., Citation1996). The multiplicity and complexity of these interactions need to be elucidated in order to clarify the adverse health and environmental effects of a mixture of compounds and their subsequent regulation.
Numerous studies have been conducted on the aflatoxins (AF), secondary metabolites produced by species in the genus Aspergillus, which are natural contaminants of foods and feeds. Aflatoxins are potent liver carcinogens in laboratory animals (Wogan, Citation1992). Aflatoxin B1 (AFB1) has been implicated as an etiological factor, apart from hepatitis B virus, in development of human liver cancer (van Rensburg et al., Citation1985). In transgenic mice it was shown that over-expression of the hepatitis B virus large peptide envelope acted synergistically with AFB1 in impacting on neoplastic development and other forms of chronic liver damage (Sell et al., Citation1998). Other studies have indicated that fumonisin B1 (FB1) is also a hepato-carcinogen in BD IX rats; another study reported on its nephro-carcinogenicity in Fischer rats and liver of B6C3F1 mice (Howard et al., Citation2001). A presence of FB1 in corn is associated with an increase in the incidence of esophageal (Chu & Li, Citation1994) and liver (Ueno et al., Citation1997) cancers in humans.
The immunotoxic potential of AF is known in many species, including laboratory and domestic animals (Bondy & Pestka, Citation2000). In pigs, AF causes decreases in blastogenic responses to mitogen, reductions in complement titers, decreases in macrophage activation, and depression of delayed hypersensitivity responses (Mocchegiani et al., Citation1998; Silvotti et al., Citation1997). Interestingly, in other studies using comparable doses, no depression of the proliferative responses of lymphocytes to mitogens was noted (van Heugten et al., Citation1994). Conflicting reports regarding the immunosuppressive effects of AF might be explained in part by differences in experimental design and the specific immune response(s) examined. Another explanation may be, possibly, different biological effects secondary to the applied AF dosage. In fact, like other cytotoxic molecules with toxic effects at a certain dosage and immunomodulatory effects at a different dosage (Mihich, Citation2007), AF might affect the function and cytokine release of immune cells in relation to the dosage, timing, and schedule of administration.
Among mycotoxins, it is long known that AFB1 imparts immunotoxicity against peritoneal macrophages and splenic lymphocytes in certain animal species (Neldon-Ortiz & Qureshi, 1991, 1992). Conversely, less information is available about the immunotoxic effects of FB1. Reports indicated that FB1 stimulates T-cell proliferation and induces nitric oxide production by rat splenic macrophages (Dombrink-Kurtzman et al., Citation2000), and that macrophages from FB1-treated mice show increased production of tumor necrosis factor (TNF)-α. However, FB1 did not cause significant effects on humoral immune responses in Balb/c mice or in Sprague-Dawley rats (Tryphonas et al., Citation1997).
Several studies have reported on the co-occurrence of AFB1 and FB1 (Gao & Yoshizawa, Citation1997; Ueno et al., Citation1997). At present, little is known about the interaction between AFB1 and FB1 with regard to changes in their individual or overall toxic/carcinogenic properties. FB1 is known to exhibit different kinetics with respect to cancer initiation, presumably due to an inhibitory effect on hepatocyte proliferation (Gelderblom et al., Citation1994) and induction of apoptosis (Lemmer et al., Citation1999). On the other hand, this inhibitory effect on cell proliferation is suggested to be a major mechanism underlying cancer-promoting effects of most fumonisins (Gelderblom et al., Citation1995). As with FB1, cancer initiation by AFB1 in the rat liver is not readily effected by a single dosage, but rather by a low-level prolonged feeding regimen (Neal & Cabral, Citation1980).
Because of the detrimental health effects, a number of strategies have been developed to prevent the growth of mycotoxigenic fungi, as well as to decontaminate/detoxify mycotoxin-contaminated foods and animal feeds. The use of many of the available physical and chemical methods for detoxification of food products contaminated with mycotoxins is restricted due to problems concerning safety issues, possible losses in nutritional quality, as well as limited efficacy and cost implications (Bata & Lasztity, 1999). This has led to the search for alternative strategies such as biological agents. Recently, there has been increasing interest in the hypothesis that absorption of AFB1 and/or FB1 in consumed foods could be reduced by micro-organisms in the gastrointestinal tract.
Lactic acid bacteria (LAB; lactobacilli and bifidobacteria), being part of the normal gut flora and its consumption is associated with a range of health benefits, including modulation of immune function and prevention of cancer. Consequently, numerous investigators have been undertaken to ascertain if LAB could act as an agent for use in mycotoxin detoxification. Some studies have already shown that some dairy strains of LAB and bifidobacteria were able to effectively bind to AFB1 in buffered solution. Jebali et al. (Citation2014) also reported that LAB fermentation could significantly reduce the levels of free AFB1 in PBS. However, such a reduction may not be sufficient for complete detoxification of the toxin.
In general, it would appear that toxic responses to AFB1 and FB1 in terms of induction and rate of progression of resulting pathologies depend on length of exposure, dose level, and rate of cell proliferation. Based on that, the aim of the study reported here was to evaluate the potential for developing an AFB1 and FB1-binding LAB and for use of this organisms in the prevention/mitigation of any [synergistic] effects of AFB1 and FB1 on induction of inflammatory response-related end-points in mice, as well as induction of markers of oxidative stress, inflammation, and apoptosis among immune system cells in these mice.
Materials and methods
Chemicals and bacteria
Standard AFB1 and FB1 (purity >98%) were obtained from Sigma (St. Louis, MO) and a stock solution was prepared in ethanol/water (1:1 [v/v]). All other chemicals purchased were of analytical grade. Two working solutions of 0.25 and 0.27 mg of, respectively, AFB1 and FB1 per milliliter of ethanol were prepared. Another two solutions (80 µg AFB1/ml and 100 µg FB1/ml) were prepared in phosphate-buffered saline (PBS, pH 6.5) for use in the in vitro study. All solutions were freshly prepared using sterile distilled water and held at 4 [±1] °C until use. The bacterial strain used in the present study was Lactobacillus paracasei BEJ01, a lactic acid bacteria (LAB) isolated from 1-month-old artisanal butter made from cow milk from local Tunisian producers.
Influence of the mycotoxins on L. paracasei BEJ01 growth
LAB was cultured in MRS medium contaminated with AFB1 and/or FB1 for 24 h. The total concentration of toxin(s) in the medium was 20 µg/ml and initial LAB concentration ≈105 CFU/ml. The increase in number of bacteria after 24 h at 30 °C was determined by plating and subsequent enumeration. All data were then expressed as log [N/N0], where N = CFU/ml after 24 h and N0 = CFU/ml at start of incubation.
AFB1 and FB1 removal from PBS using L. paracasei BEJ01
LP culture broth (containing 108 CFU/ml) was centrifuged (3000 × g, 15 min) and the bacterial pellet washed with water. The LP pellets were then re-suspended in 5 ml PBS containing 50 µg AFB1/ml and/or 50 µg FB1/ml. The tubes were mixed and the bacterial suspensions then incubated at 37 °C for 0, 12, and 24 h. AFB1- and FB1-positive controls (50 µg/ml PBS) in the absence of bacteria and a negative control (bacteria suspended in PBS only) were also incubated for the same periods to monitor efficacy of bacteria binding of AFB1 and FB1. At each timepoint, the dedicated tubes were centrifuged 15 min at 3000 × g and supernatants collected and transferred to clean tubes. The tubes were stored at 4 °C until time of AFB1 and FB1 content analysis. Unbound AFB1 and FB1 in the supernatants were determined using HPLC (see below). All experiments were performed in triplicate. To determine the effect of bacteria viability on binding affinity, bacteria (108 CFU/ml) were heated at 90 °C for 15 min and the killed bacteria then pelleted, contaminated with AFB1 and FB1, and analyzed as above.
Determination of AFB1 and AB1
AFB1 and FB1 analyses were performed using HPLC that incorporated an immunoaffinity column. In brief, after blending, the samples were filtered using Whatman filter paper, and the filtrate diluted with 80 ml PBS. A sample of the filtrate (10 µl) was then passed through an AFB1 or FB1 immunoaffinity column containing specific anti-AFB1 or anti-FB1 mono-clonal antibodies bound to a solid support (Vicam, Watertown, MA), followed by washing with 20 ml distilled water at 5 ml/min. Bound AFB1 or FB1 was eluted with 1.5 ml acetonitrile followed by 1.5 ml distilled water, and collected in a clean vial. These two eluted samples were mixed and analyzed using an Agilent 1100 HPLC system (Agilent Technologies, Englewood, CO) containing an ACE C18 silica (5 µm i.d., 25 × 46 mm) column purchased from Advanced Chromatography Technologies (Aberdeen, Scotland); product measurements were made in-line spectrophotometrically at an OD of 435 nm.
Quantification of AFB1 and FB1 were done from measures of peak areas and extrapolating against a calibration curve prepared/analyzed in parallel using AFB1 and FB1 standards (Sigma). Three replicate analyses were performed for each sample. To verify the soundness of the assay, recovery from bacteria-free PBS was determined for the test range of AFB1 and FB1 used; mean recovery was 89–93%. The percentage of AFB1 and FB1 bound to the bacteria was calculated using the formula: 100% × (1.00 − [peak area of AFB1 or FB1 in supernatant/peak area of AFB1 or FB1 in positive control sample]).
Animals and treatments
Balb/c mice (10-weeks-of-age, female) were obtained from the Pasteur Institute (Tunis, Tunisia) and acclimatized for 1 week before use in the experiments. All mice were housed in filter-top polycarbonate cages in specific pathogen-free facilities maintained at 22 [±2] °C, with a 40 [±5]% relative humidity, and a 12-h light/dark cycle. Standard rodent chow and filtered water were available ad libitum. All water and food were tested according to NF ISO 15302 to confirm that all matrices were AFB1- and FB1-free down to a detection limit of 1 ng/g fat matter and 1 ng/L water. All experiments were done in compliance with the rules of the European Communities Council Directive of November 24, 1986 (86/609/EEC).
For the experiments, 80 mice were randomly allocated into eight groups (10/group) to be treated daily for 14 days as follows: Group 1, normal control (treated by gavage with saline solution); Group 2, treated orally with LAB (2 × 10⁹ CFU/L, ∼2 mg/kg) only; Group 3, mice treated orally with AFB1 (80 µg/kg); Group 4, mice treated orally with FB1 (100 µg/kg); Group 5, mice treated with mixture of AFB1 + FB1 at same doses as in Groups 3 and 4; Group 6, mice treated with AFB1 + LAB; Group 7, mice treated with FB1 + LAB; and Group 8, mice treated with mixture of AFB1 + FB1 + LAB. Gavage volumes (total) never exceeded 200 µl/dosing. Mice were observed daily for any signs of toxicity.
At the end of the treatment period (i.e. day 14), all mice were fasted for 12 h, then euthanized by cervical dislocation. At necropsy, the spleen of each host was removed and weighed (from this and body weight, splenic indices were calculated). A section of the organ was snap-frozen in liquid N2 and stored at −80 °C for later analyses of inflammatory cytokine mRNA expression. A second section was stored at −20 °C for measures of anti-oxidant enzymes. The thymus of each mouse was also recovered and immediately processed for analysis of apoptosis among resident thymocytes.
Determination of inflammatory cytokine mRNA expression
Total RNA from 3 × 10⁵ splenocytes/mouse was isolated using Trizol (EZNA® Total RNA Kit, Omega Biotek, Inc., Norcross, GA). RNA concentration of each sample was measured by a spectrophotometer (260 versus 280 nm) and quality estimated by assessing 18S and 28S rRNA; the intensity ratio of these bands was 1:2 in the gels. A SYBR Green I real-time polymerase chain reaction (RT-PCR) was then used to measure the mRNA expression levels of IL-4, IL-10, IFNγ, and TNFα. First-strand cDNA was synthesized from 5 μg total RNA (after processing with DNase) using the following oligo (dT) primers (IL-4: 5′-GCGACATCACCTT-ACAAGAGAT-3′; IL-10: 5′-AGGAGGAGAAGGGGTAGGTAAG-3′; IFNγ: 5′AAGATAAC-CAGGCCAGG-CCATTCAAAG-3′; and TNFα: 5′-ACCACGCTCTTCTGCCTACT-3′) and Superscript II reverse transcriptase, according to manufacturer instructions (Tiangen Biotech, Beijing, China). Real-time PCR was then done in an ABI PRISM 7500 SDS thermal cycler (Applied Biosystems, Foster City, CA). Each sample was analyzed in triplicate. Analyses were performed with 2.0 μl first-strand cDNA and 0.8 μl sense and anti-sense primers in a 20 μl final volume as recommended by the SYBR real-time PCR kit (TaKaRa BioCatalog, Dalian, China). RT-PCR conditions were: one cycle at 95 °C for 30 s and 40 cycles at 95 °C for 5 s and 60 °C for 34 s. Relative expression of the mRNA of each inflammatory cytokine was determined using the 2−ΔCt method (Bousquet et al., Citation2009; Lee & Schmittgen, Citation2006).
Determination of anti-oxidative parameters in mice
Several measures of host anti-oxidative status were determined using commercial diagnostic kits (Nanjing Jiancheng Biotechnology Co., Ltd, Jiangsu, China) and a Shimadzu UV-2410PC ultraviolet spectrophotometer (Shimadzu, Kyoto, Japan). The parameters evaluated in the spleen tissues were malondialdehyde (MDA) level, superoxide dismutase (SOD) activity, glutathione peroxidase (GHS-Px) activity, and total anti-oxidative capacity (T-AOC) (Liu et al., Citation2007).
Caspase-3 enzyme activity determination
Caspase-3 activities in splenocytes, as a measure of mycotoxin-induced apoptosis/DNA damage (rather than due to normal metabolic processes associated with splenocytes [as opposed to what might occur in thymus due to thymic lymphocyte selection processes]) and overall cell death were determined using the procedure of Kim et al. (Citation2000). Splenocytes were harvested from portions of the isolated spleens by standard protocols; after lysing of red blood cells with 0.84% [w/v] ammonium chloride solution, the cells were re-pelleted, re-suspended in PBS, and counted. Aliquots of the splenocytes (103 cells/ml) were then centrifuged at 5000 rpm and the pellet incubated in ice-cold lysing buffer (0.5 M EDTA, 5 M NaCl, 10% SDS) in 1 M Tris (pH 7.4) for 10 min. The materials were then centrifuged at 5000 rpm for 20 min. Supernatants (cell extracts containing caspase-3) were retrieved and protein concentrations determined via a BCA assay (Thermo Fisher Scientific, Rockford, IL). Thereafter, 10 µl of cytosolic extracts (1–2 mg/ml protein) was added to wells of a 96-well flat bottomed microplate to which 50 µl substrate buffer (containing 100 mM HEPES (pH 7.5), 10% sucrose, 0.1% CHAPS, 5 mM dithiothreitol, 16 mM caspase-3 substrate [Ac-Asp-Glu-Val-Asp-p-nitroanalide) was then added, and the plate incubated for 3 h at 37 °C. In the presence of active caspase-3, release of pNA from the substrate occurs, with the free pNA producing a yellow color that can be measured spectrophotometrically at 405 nm. Additional controls, free from cell lysates and others lacking substrate, were included in the assays. A standard curve was prepared to permit extrapolation of the sample pNA concentration. From this, results were then expressed as caspase-3 specific activity (pmol pNA/h/mg protein).
Apoptotic DNA analysis
The thymus was dissected from each mouse and single cell suspensions prepared by passing the organ through a stainless steel mesh. The suspension was centrifuged at 200 × g (4 °C, 10 min) and the pelleted cells re-suspended in complete cell culture medium (RPMI 1640 containing 10 mM HEPES, 2 mM glutamine, 10% FBS, and 1% antibiotic-antimycotic solution). Cell density was adjusted to 1.5 × 10⁶ cells/ml and viability of the freshly isolated cells assessed via trypan blue exclusion (always >95%). The numbers of cells with hypodiploid DNA were then assessed determined by flow cytometry. Specifically, the harvested cells were washed with PBS, fixed by drop-wise addition of ice-cold 70% ethanol, and stored at 4 °C overnight. The fixed cells were then washed with PBS and suspended in 1 ml PBS. Phosphate-citrate buffer (100 µl, pH 7.8) was added to the cells and the mixture incubated for 60 min at room temperature. The cells were then centrifuged (200 × g, 4 °C, 10 min), and the cells then re-suspended in 0.5 ml of PI stain (10 mg PI, 0.1 ml Triton-X 100, 3.7 mg EDTA in 100 ml PBS) to which 0.5 ml RNase A (50 mg/ml) solution was then added. After incubation for 30 min in the dark, the PI fluorescence was measured in BD-LSR flow cytometer (BD Biosciences, San Jose, CA) using a FL-2 filter (585 nm). A minimum of 10,000 events was acquired for each sample. Cell debris, characterized by a low FSC/SSC, was excluded from analysis. All data was analyzed by Cell Quest software (BD Biosciences) and the mean fluorescence intensity was obtained from histogram statistical analyses.
Statistics
All data were expressed as mean ± SD. All in vivo data were analyzed by a one-way analysis of variance (ANOVA) followed by a Dunnet’s post-hoc test. In the in vitro study, a Student’s t-test was used. All analyses were done using Sigma Stat Version 2.0 (Systat Software Inc., San Jose, CA). The criterion for significance was set at p < 0.05.
Results
Influence of AFB1 and FB1 on L. paracasei BEJ01 growth
indicates that, after 24 h of incubation, the number of L. paracasei cells in MRS medium increased by ≈2 log units. When incubated with the AFB1 and/or FB1, there were no statistically significant effects on the growth of the L. paracasei. To be certain the mycotoxins were potent, parallel experiments were performed using Escherichia coli ATCC 10536 in combination with AFB1 and/or FB1. With that bacterium, the mycotoxins each imparted a negative influence on yield.
Table 1. Effect of AFB1 and FB1 on yield of L. paracasei BEJ01.
AFB1 and FB1 removal from PBS using L. paracasei BEJ01
shows the time-dependent accumulation of AFB1 and FB1 by LAB in PBS. Viable LAB adsorbed 63.4 [±6.1]% of AFB1 after 12 h and the binding rose to 83.4 [±7.1]% after 24 h of incubation. Regarding FB1, live LAB adsorbed 67.5 [±7.2]% of FB1 after 12 h and reached 88.9 [±5.9]% by 24 h incubation in PBS. Moreover, viable LAB adsorbed 70.2 [±4.2]% of the AFB1 + FB1 (combined toxin) mixture after 12 h; binding rose to 91.2 [±7.5]% after 24 h of incubation. With heated LAB cells, AFB1, FB1, and the AFB1 + FB1 mixture binding decreased to 21.8 [±3.3], 25.5 [±1.3], and 26.3 [±4.1]% at 24 h, respectively.
Table 2. Percentage AFB1 and FB1 removal from PBS by live and killed LAB in PBS.
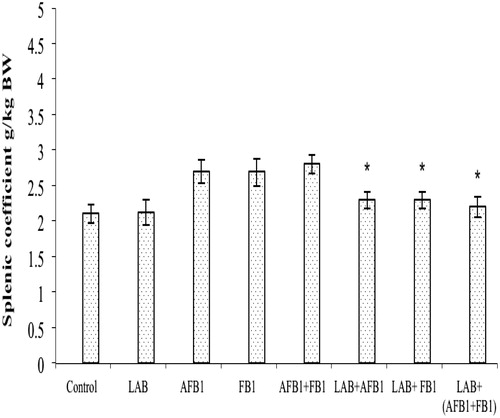
Splenic index
Both AFB1 and FB1 exposures (separately or together in combination) significantly decreased the splenic coefficient compared with the value seen in control mice (; p < 0.05). The treatments of LAB alleviated the adverse effect of both toxins on this parameter.
Figure 1. Splenic indices for mice after treatments. Mice were orally exposed daily for 2 weeks to LAB (2 × 10⁹ CFU/L, ∼2 mg/kg BW), AFB1 (80 µg/kg), FB1 (100 µg/kg), AFB1 + FB1, AFB1 + LAB, FB1 + LAB, or AFB1 + FB1 + LAB. Measures were made after 12 h fasting (i.e. on day after the final treatment in each group). Data shown are mean ± SD. In each histogram, values (bars) with superscripts bearing differ significantly (p < 0.05).
Cytokine mRNA expression
AFB1 and FB1 exposure, separately or in combination, resulted in significant increases in IL-10 and IL-4 mRNA expression and decreases in IFNγ and TNFα mRNA expression in the spleen (). This suggested that AFB1 and FB1 (separately or in mixture) could have a direct impact on inflammatory cytokine expression. Moreover, the presence of both toxins together had a somewhat (albeit non-significant) greater effect then if given separately; this indicated potential synergism from a co-presence of the mycotoxins. Co-treatment using LAB with either mycotoxin (alone/in combination) ameliorated the adverse effects on mRNA expression.
Table 3. Effect of treatments on splenic mRNA expression of select inflammatory cytokines.
Anti-oxidative parameters in mice
Several indicators related to oxidative stress in the treated mice, such as MDA, SOD, GSH, and T-AOC, were measured in the harvested spleens. As shown in , AFB1, FB1, and the AFB1 + FB1 mixture induced a significant increase in MDA and decreases in the levels of SOD, GSH, and T-AOC in the spleens of mice. The co-treatment with LAB decreased the changes in each oxidative stress-related parameter.
Table 4. Effect of treatments on splenic oxidative stress enzymes.
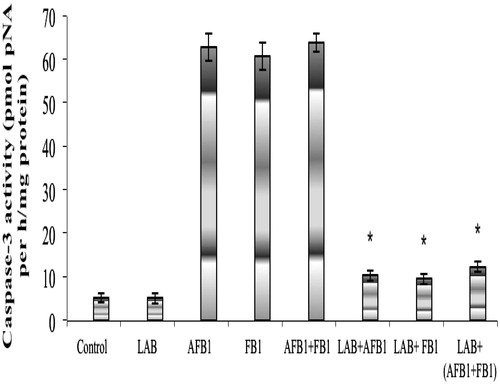
Splenocyte caspase-3 activity
The results of measures of splenocyte caspase-3 activity are presented in . It is clear there were no significant differences in activity between cells from mice treated with LAB alone (5.12 [±1.18] pmol pNA/h/mg protein) and those from the controls (5.10 [±1.30]). In contrast, splenocytes from the hosts that had received AFB1, FB1, or the AFB1 + FB1 mixture had significant increases in activity (to, respectively, 62.7 [±3.17], 60.6 [±3.19], and 63.8 [±2.13] pmol pNA/h/mg protein). These levels were significantly reduced when LAB was included as co-treatment; values dropped to 10.3 [±1.12], 9.5 [±1.14], and 12.3 [±1.17] pmol pNA/h/mg protein, respectively, for the LAB + AFB1, LAB + FB1, and the LAB + AFB1 + FB1 groups.
Figure 2. Caspase-3 activity in splenocytes from mice after treatment. Mice treated as indicated in the legend for . Cells were harvested from spleens isolated after hosts were fasted for 12 h (i.e. on day after the final treatment in each group). Data shown are mean ± SD. In each histogram, bars with (*) differ significantly to other treatments (p < 0.05).
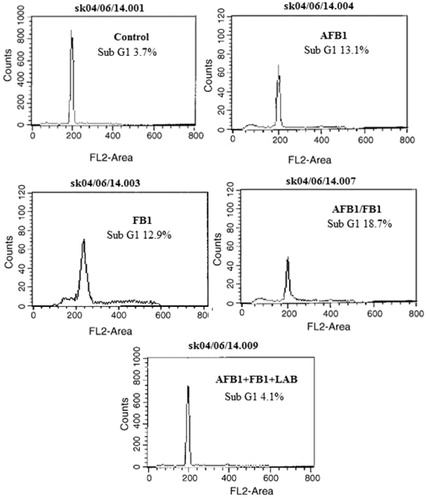
Apoptosis in thymocytes
AFB1 and/or FB1 induced increases in the levels of apoptotic DNA (sub-G1 population), but this effect was suppressed by co-treatment of the hosts with LAB (). The percentages of all thymocytes that appeared apoptotic due to AFB1 or FB1 individually were, respectively, 13.1 and 12.9%. When AFB1 and FB1 were given simultaneously, the level increased to 18.7%. The co-treatment of the hosts with LAB decreased the apoptotic DNA (sub-G1) populations. In the case of the combined mycotoxin exposures, there was a 4.5-fold lowering of apoptotic DNA (sub-G1) population sizes due to the LAB; similar outcomes were noted in mice that received the LAB with either mycotoxin alone (data not shown).
Figure 3. Effect of LAB on AFB1/FB1 induced apoptotic DNA. Freshly-isolated thymocytes (1.5 × 10⁶) from each mouse treated as indicated in the legend for . Propidium iodide fluorescence was measured using a flow cytometer with an FL-2 filter. Results are expressed in each histogram as the percentage of sub-G1 population.
Discussion
The aflatoxin (AF) content of some foods in Africa and Asia is >10-times recommended levels. Contamination with AF is responsible for significant financial losses that encompass a broad spectrum of crop and farm animals and extends through the food chain to humans. The natural co-occurrence of AFB1 and FB1, especially in corn, is a worldwide problem and has been associated with a high incidence of human hepatocellular carcinoma (CAST, Citation2003). Moreover, it is also likely the oxidative stress exerted individually by AFB1 and FB1 may be enhanced by sub-chronic co-exposure to both toxins (Theumer et al. Citation2003).
The World Health Organization has defined probiotics as “live micro-organisms that, when administered in adequate amounts, confer a health benefit on the host” (WHO, Citation2001, Citation2002). A large number of benefits have been ascribed also to heat-killed probiotic microbes (Ouwehand & Salminen, Citation1998). Clearly, there is a need to further define probiotics as it is now understood that most microorganisms in the human gut are non-culturable using current methodologies. Probiotics usually interact with intestinal micro-biota and intestinal wall receptors to produce varying effects on a host. Viability per se is not a pre-requisite for such health benefits, as non-viable LAB and bifidobacteria have been shown to impart health benefits.
LAB and bifidobacteria have been reported to remove heavy metals (Halttunen et al., Citation2008), cyanotoxins (Nybom et al., Citation2007), and mycotoxins (Abbès et al., Citation2013; Jebali et al., Citation2014) from aqueous solution in vitro. The binding appears to be species- and strain-dependent. The most efficient species/strains in removal of these compounds vary between components tested; however, surprisingly, most do not bind positive components or nutrients in the diet (El-Nezami et al., Citation1998; Haskard et al., Citation2001). In a similar manner, LAB and bifidobacteria interact directly with pathogens that may influence host health. In the context of effects upon host immune function from mycotoxins like AFB1 (Moon et al., Citation1999; Quist et al., Citation2000), Jebali et al. (Citation2014) demonstrated the immunomodulatory/anti-immunotoxic effects of LAB in mycotoxin-exposed mice. LAB caused an increase in bone marrow cellularity and α-esterase+ cells that had been negatively impacted upon by the mycotoxins. Treatment with LAB also enhanced circulating antibody titers and levels of plaque-forming cells in the mycotoxin-exposed hosts, reflecting a potential for the micro-organism to stimulate the humoral arm of the immune response.
AFB1 toxicity involves biotransformation through cytochrome P450 to highly reactive AFB1-exo-8,9-epoxide that forms DNA adducts (Guengerich et al., Citation1998). Similarly, FB1 can produce oxidative stress/apoptosis, depending on host species and specific cell type exposed (Stockmann-Juvala & Savolainen, Citation2008). It is widely accepted that many of the (cyto)toxic effects of AFB1 or FB1 are due to increases in production of reactive oxygen species (ROS) to toxic levels (Matur et al., Citation2011; Towner et al., Citation2003). Oxidative damage induced by these ROS can, in turn, cause tissue damage by a variety of mechanisms including DNA damage, lipid peroxidation, protein oxidation, and depletion of thiols. In the current study, experimental mycotoxicosis in mice was developed (by 2-week treatment of known levels of AFB1 and FB1, individually or as a mixture) in order to characterize immune cell alterations, changes in levels of inflammation-regulating cytokines, apoptosis among thymocytes, and oxidative stress induced by these agents. Moreover, a possible protective role against these outcomes in mice was also evaluated.
To lay a foundation for possible in vivo beneficial effects of the LAB, in vitro studies to assess if/the extent to which the LAB might bind the mycotoxins were performed here. The in vitro portion of the study showed that while, after 24 h of incubation, the number of cells in MRS medium only increased, the co-presence of AFB1 and/or FB1 did not have a negative influence on biomass yield. These results are similar to those in the literature, wherein AFB1 and FB1 at a much higher dose (50 μg/ml) did not inhibit the growth of L. plantarum or L. paracasei (Ali-Vehmas et al., Citation1998). On the other hand, analyses of the binding abilities by L. Lactobacillus paracasei BEJ01 toward AFB1, FB1, or the mixture of the toxins in PBS indicated the bacterial was capable of sufficiently binding free AFB1 and FB1 in solution. This was similar to a report about trichothecene binding by some strains of Lactobacillus and Propionibacterium (Abbès et al., Citation2013; El-Nezami et al., Citation1998).
In the in vivo study here, the doses of AFB1, FB1, and LAB used were based on our previous work (Abdel-Wahhab et al., Citation2010; Abbès et al., Citation2013). The results showing that levels of lipid peroxidation (MDA), and of GSH and T-AOC (oxidative stress marker) were increased in the spleen – and that of GSH significantly decreased by – AFB1 and/or FB1 were in accordance with earlier findings of the effects of these mycotoxins on induced oxidative stress and lipid peroxidation (Hassan et al., Citation2014). These results were also in agreement with those of Mary et al. (Citation2012), who reported increased LP levels and concomitant decreases in the activities of protective anti-oxidation promoting enzyme activities. The study here also showed that each mycotoxin induced apoptosis among the host thymocytes; such outcomes were in line with earlier finding that AFB1 and FB1 produced oxidative stress/apoptosis (Hassan et al., Citation2010), depending on the host species and cell type examined (Stockmann-Juvala & Savolainen, Citation2008).
The mechanisms used by each of these two mycotoxins to induce ROS has become clearer in recent years (Domijan & Abramov, Citation2011). Furthermore, it has been suggested that the oxidative damage induced by AFB1 and FB1 might indirectly lead to mutagenicity or geno-toxicity (Stockmann-Juvala et al., Citation2004; Hassan et al., Citation2010). The interaction of AFB1 and FB1 in the induction of DNA damage and its correlation with biomarkers of cellular oxidative status here revealed a clear potential for “synergism” among these agents in situ to lead to even greater levels of induced toxicity. This would be in line with the findings of Mary et al. (Citation2012), who demonstrated that AFB1 and FB1, alone or as a mixture, affected the oxidative status of splenic mononuclear cells (by increasing ROS levels and biomolecular oxidative damage), but with the mixture inducing the greatest effects.
The present studies also assessed effects of the AFB1 ± FB1 on the presence of inflammation-regulating cytokines in the treated hosts. Here, exposures caused elevations in expression of IL-4 and 10 mRNA, but decreases in that of IFNγ and TNFα within host splenocytes. While this contrasted with the findings of Li et al. (Citation2014), who noted increases in IL-6, IFNγ, and TNFα expression in birds exposed to AFB1-contaminated diets, the results were in accordance with those of Liu et al. (Citation2002), who reported that cytokine mRNA expression in phytohemagglutinin-stimulated blood cells from pigs exposed to AF had decreased pro-inflammatory (IL-1β, TNFα) and increased anti-inflammatory (IL-10) cytokine mRNA expression.
The reason for these differences in outcomes between our study and those of the other investigators is not clear, although species-specific responses may be one explanation. While this is likely the main reason, the age of the treated animals (10-week-old mice versus 11-day-old birds) and the period of treatment (14 days versus 3 weeks) may also have influenced the results. Nevertheless, the possibility that, over a long period, cytokines inhibiting inflammation might be found to be increased and inflammation decreased might suggest that active inflammation was appearing earlier in the mouse model and that these were effects reflecting an evolution toward re-modeling/reparation of the damage. It should also be noted that this situation could lead to tissue changes that are prone to pro-carcinogenic evolution – especially when associated with enhanced levels of oxidative stress.
The current studies also revealed that co-treatment with LAB and each toxin, separately or together, resulted in a significant mitigation/prevention of the combined effects of AFB1 and FB1 on induction of inflammatory response-related end-points in mice, as well as of markers of oxidative stress, inflammation, and apoptosis among immune system cells of these hosts. Indeed, measures of splenocyte caspase-3 activity () clearly indicated no significant differences in activity between cells from control mice and those treated with AFB1 + FB1 + LAB. Regarding oxidative stress (), AFB1, FB1, and the AFB1 + FB1 mixture induced a significant increase in MDA and decreases in levels of SOD, GSH, and T-AOC in spleens of mice. Co-treatment with LAB decreased levels of each of these changes by each specific mycotoxin. Further, the AFB1-/FB1-induced increases in levels of apoptotic DNA (sub-G1 population) was also reduced by co-treatment of the hosts with LAB (). Lastly, the LAB co-treatment regimen also ameliorated the adverse effects of each mycotoxin on mRNA expression.
The protective effects of LAB may be explained, in part, by the ability of this bacterium to bind AFs in vitro or in the gastrointestinal tract and reduce toxin bioavailability. Many micro-organisms, e.g. bacteria, yeasts, molds, actinomycetes, are able to remove or degrade small amounts of mycotoxins in food/feed (Styriak et al., Citation2001). Results of several studies suggest that binding is the main mechanism of detoxification (Gratz, Citation2007). Strains L. rhamnosus GG and LC-705 seem to be the most effective in such detoxifications (Lahtinen et al., Citation2004). However, the binding mechanism itself still remains not thoroughly understood. It was suggested that carbohydrate-rich mannoproteins or glucans might be involved in the binding, as levels of complex formation appear to be strain- and toxin-specific (Shetty & Jespersen, Citation2006). Raju & Devegowda (Citation2000) attributed the binding of aflatoxins by yeast cell walls to mannan oligosaccharides, while toxin binding was attributed to glucan components (Yiannikouris et al., Citation2004). Haskard et al. (Citation2001) suggested that AFs bind predominantly to carbohydrate and protein components of viable cells. Clearly, as noted by Shetty & Jespersen (Citation2006), systematic studies are still needed to understand the precise binding mechanisms.
Conclusion
Results of the present study demonstrated that AFB1 and FB1, alone or in combination, affected the oxidative status in mice, by increasing ROS generation (as inferred by the elevation of MDA and the reduction of GSH levels) in the spleen. These mycotoxins also down-regulated mRNA gene expression of several key inflammation-regulating cytokines, but increased the levels of apoptosis among thymocytes and caspase-3 activity within splenocytes. The mixture of the two mycotoxins often induced the greatest effect, although the change versus that from either mycotoxin alone often was not statistically significant. Thus, use of L. paracasei BEJ01 to provide a protective effect against cytotoxicity from these mycotoxins in vivo and their removal in vitro should be further assessed to see if wider application could be an option in the future.
Declaration of interest
The authors report no conflicts of interest. The authors alone are responsible for the content and writing of the paper.
Acknowledgments
The work was supported by the Tunisian Ministry of Higher Education and Scientific Research (Unit of Immunology, Environmental Microbiology, and Cancerology), the Higher Institute of Biotechnology of Beja (Animal Biotechnology Department) and The National Institute of Genetic Engineering and Biotechnology of Tehran.
References
- Abbès, S., Ben Salah-Abbès, J., Sharafi, H., et al. 2013. Lactobacillus paracasei BEJ01 prevents immunotoxic effects during chronic zearalenone exposure in Balb/c mice. Immunopharmacol Immunotoxicol. 35:341–348
- Abdel-Wahhab, M. A., Hassan, N. S., El-Kady, A., et al. 2010. Red ginseng protects against aflatoxin B1 and fumonisin-induced hepatic pre-cancerous lesions in rats. Food Chem. Toxicol. 48:733–742
- Ali-Vehmas, T., Rizzo, A., Westermarck, T., and Atroshi, F. 1998. Measurement of antibacterial activities of T-2 toxin, deoxynivalenol, ochratoxin A, aflatoxin B1 and fumonisin B1 using micro-titration tray based turbidimetric techniques. J. Vet. Med. 45:453–458
- Bata, A., and Lasztity, R. 1999. Detoxification of mycotoxin-contaminated food and feed by microorganisms. Trends Food Sci. Technol. 10:223–228
- Bennett, J. W., and Klich, M. 2003. Mycotoxins. Clin. Microbiol. Rev. 16:497–516
- Bondy, G., and Pestka, J. J. 2000. Immunomodulation by fungal toxins. J. Toxicol. Environ. Health 3:109–143
- Bousquet, L., Pruvost, A., Guyot, A., et al. 2009. Combination of intracellular drug accumulation. Antimicrob. Agents 53:896–902
- Bryden, W. L. 2007. Mycotoxins in the food chain: Human health implications. Asia Pacif. J. Clin. Nutr. 16:95–101
- Carpenter, D. O., Arcaro, K. F., Bush, B., et al. 1998. Human health and chemical mixtures: An overview. Environ. Health Perspect. 106:1263–1270
- CAST. 2003. Mycotoxins: Risks in plant, animal, and human systems. In: Council for Agricultural Science and Technology Task Force Report #139. (Richard, J. L., and Payne, G. A., Eds.), Ames, IA: CAST
- Chu, F. S., and Li, G. Y. 1994. Simultaneous occurrence of fumonisin B1 and other mycotoxins in moldy corn collected from the Peoples Republic of China in regions with high incidences of esophageal cancer. Appl. Environ. Microbiol. 60:847–852
- Dombrink-Kurtzman, M. A., Gomez-Flores, R., and Weber, R. J. 2000. Activation of rat splenic macrophage and lymphocyte functions by fumonisin B1. Immunopharmacology 49:401–409
- Domijan, A. M., and Abramov, A. Y. 2011. Fumonisin B1 inhibits mitochondrial respiration and deregulates calcium homeostasis-implication to mechanism of cell toxicity. Int. J. Biochem. Cell Biol. 43:897–904
- El-Nezami, H., Kankaanpaa, P., Salminen, S., and Ahokas, J. 1998. Ability of dairy strains of lactic acid bacteria to bind a common food carcinogen aflatoxin B1. Food Chem. Toxicol. 36:321–326
- Gao, H., and Yoshizawa, T. 1997. Further study of Fusarium mycotoxins in corn and wheat from a high-risk area for human esophageal cancer in China. Mycotoxins 45:51–55
- Gelderblom, W. C., Cawood, M. E., Snyman, S. D., and Marasas, W. F., 1994. Fumonisin B1 dosimetry in relation to cancer initiation in rat liver. Carcinogenesis 15:209–214
- Gelderblom, W. C., Snyman, S. D., van der Westhuizen, L., and Marasas, W. F., 1995. Mito-inhibitory effect of fumonisin B1 on rat hepatocytes in primary culture. Carcinogenesis 16:625–631
- Gratz, S. 2007. Aflatoxin binding by probiotics. Experimental Studies on Intestinal Aflatoxin Transport, Metabolism and Toxicity. Doctoral dissertation, School of Public Health and Clinical Nutrition, Clinical Nutrition and Food Health Research Centre, University of Kuopio, Finland
- Guengerich, F. P., Johnson, W. W., Shimada, T., et al. 1998. Activation and detoxication of aflatoxin B1. Mutat. Res. 402:121–128
- Halttunen, T., Collado, M. C., El-Nezami, H., et al. 2008. Mixing of lactic acid bacteria strains may reduce their toxin removal efficiency from aqueous solution. Lett. Appl. Microbiol. 46:160–165
- Haskard, C., El-Nezami, H., Kankaanpaa, P. E., et al. 2001. Surface binding of aflatoxin B1 by lactic acid bacteria. Appl. Environ. Microbiol. 67:2086–3091
- Hassan, A., Abdel-Aziem, S., El-Nekeety, A., and Abdel-Wahhab, M. 2014. Panax ginseng extract modulates oxidative stress, DNA fragmentation and up-regulate gene expression in rats subchronically treated with aflatoxin B1 and fumonisin B1. doi: 10.1007/s10616–014–9726–z
- Hassan, A., Hassan, N., Mohamed, S., et al. 2010. Aquilegia vulgaris L. extract counteracts oxidative stress and cytotoxicity of fumonisin in rats. Toxicon 56:8–18
- Howard, P. C., Eppley, R. M., Stack, M. E., et al. 2001. Fumonisin B1 carcinogenicity in a 2-year feeding study using F344 rats and B6C3F1 mice. Environ. Health Perspect. 109:277–282
- Jebali, R., Abbès, S., Ben Salah-Abbès, J., et al. 2014. Ability of Lactobacillus plantarum MON03 to mitigate aflatoxins (B1 and M1) immunotoxicities in mice. J. Immunotoxicol. doi:10.3109/1547691X.2014.973622
- Kim, H. S., Hausman, D. B., Comton, M. M., et al. 2000. Induction of apoptosis by all-trans-retinoic acid and C2-ceramide treatment in rat stromal-vascular cultures. Biochem. Biophys. Res. Commun. 270:76–80
- Lahtinen, S. J., Haskard, C. A., Ouwehand, A. C., et al. 2004. Binding of aflatoxin B1 to cell wall components of Lactobacillus rhamnosus strain GG. Food Addit. Contam. 21:158–164
- Lee, E. J., and Schmittgen T. D. 2006. Comparison of RNA assay methods used to normalize cDNA for quantitative real-time PCR. Anal. Biochem. 357:299–301
- Lemmer, E. R., Hall, P. M., Omori, N., et al. 1999. Histopathology and gene expression changes in rat liver during feeding of fumonisin B1, a carcinogenic mycotoxin produced by Fusarium moniliforme. Carcinogenesis 20:817–824
- Li, Y., Ma, Q., Zhao, L., et al. 2014. Effects of lipoic acid on immune function, anti-oxidant defense system, and inflammation-related gene expression in broiler chickens fed aflatoxin-contaminated diets. Int. J. Mol. Sci. 15:5649–5662
- Liu, C., Yu, K., Shi, X., et al. 2007. Induction of oxidative stress and apoptosis by PFOS and PFOA in primary cultured hepatocytes of freshwater tilapia (Oreochromis niloticus). Aquat. Toxicol. 82:135–143
- Liu, B. H., Yu, F. Y., Chan, M. H., and Yang, Y. L. 2002. The effects of mycotoxins, fumonisin B1 and aflatoxin B1 on primary swine alveolar macrophages Toxicol. Appl. Pharmacol. 180:197–204
- Mary, V. S., Theumer, M. G., Arias, S. L., and Rubinstein, H. R. 2012. Reactive oxygen species sources and biomolecular oxidative damage induced by aflatoxin B1 and fumonisin B1 in rat spleen mononuclear cells. Toxicology 302:299–307
- Matur, E., Ergul, E., Akyazi, I., et al. 2011. Effects of Saccharomyces cerevisiae extract on hematological parameters, immune function and the anti-oxidant defense system in breeder hens fed aflatoxin contaminated diets. Br. Poult. Sci. 52:541–550
- Mihich, E. 2007. Anti-cancer drug-induced immunomodulation and cancer therapeutics. Curr. Cancer Ther. Rev. 3:174–193
- Mocchegiani, E., Corradi, A., Santarelli, L., et al. 1998. Zinc, thymic endocrine activity and mitogen responsiveness (PHA) in piglets exposed to maternal aflatoxicosis B1 and G1. Vet. Immunol. Immunopathol. 62:245–260
- Moon, E. Y., Rhee, D. K., and Pyo, S. 1999. Involvement of NO, H2O2 and TNFα in the reduced anti-tumor activity of murine peritoneal macrophages by aflatoxin B1. Cancer Lett. 136:167–176
- Neal, G. E., and Cabral, J. R. 1980. Effect of partial hepatectomy on response of rat liver to aflatoxin B1. Cancer Res. 40:4739–4743
- Neldon-Ortiz, D. L., and Qureshi, M. A. 1991. Direct and microsomal activated aflatoxin B1 exposure and its effects on turkey peritoneal macrophage function in vitro. Toxicol. Appl. Pharmacol. 109:432–442
- Neldon-Ortiz, D. L., and Qureshi, M. A. 1992. The effects of direct and microsomal activated aflatoxin B1 on chicken peritoneal macrophages in vitro. Vet. Immunol. Immunopathol. 31:61–76
- Nybom, S. M., Salminen, S. J., and Meriluoto, J. A. 2007. Removal of microcystin-LR by strains of metabolically active probiotic bacteria. FEMS Microbiol. Lett. 270:27–33
- Ouwehand, A. C., and Salminen, S. J. 1998. Health effects of viable and non-viable cultured milks. Intl. Dairy J. 8:749–758
- Quist, C. F., Bounous, D. I., Kilburn, J. V., et al. 2000. Effect of dietary aflatoxin on wild turkey poults. J. Wildlife Dis. 36:436–444
- Raju, M., and Devegowda, G. 2000. Influence of esterified glucomannan on performance and organ morphology, serum biochemistry and hematology in broiler exposed to individual and combined mycotoxicosis (aflatoxin, ochratoxin, and T-2 toxin). Br. Poult. Sci. 41:640–650
- Sell, S., Xu, K. L., Huff, W. E., et al. 1998. Afla-toxin exposure produces serum α-fetoprotein elevations and marked oval cell proliferation in young male Peking ducklings. Pathology 30:34–39
- Shetty, P., and Jespersen, L. 2006. Saccharomyces cerevisiae and lactic acid bacteria as potential mycotoxin decontaminating agents. Trends Food Sci. Technol. 17:48–55
- Silvotti, L., Petterino, C., Bonomi, A., and Cabassi, E. 1997. Immunotoxicologic effects on piglets of sows fed diets containing aflatoxins. Vet. Res. 141:469–472
- Stockmann-Juvala, H., and Savolainen, K. 2008. A review of the toxic facts and mechanisms of action of fumonisin B1. Human Exp. Toxicol. 27:799–809
- Stockmann-Juvala, H., Mikkola, J., Naarala J., et al. 2004. Fumonisin B1-induced toxicity and oxidative damage in U-118MG glioblastoma cells. Toxicology 202:173–183
- Styriak, I., Conková, E., Kmet, V., et al. 2001. Use of yeast for microbial degradation of some selected mycotoxins. Mycotoxin Res. 17:24–27
- Theumer, M. G., Lopez, A. G., Masih, D. T., et al. 2003. Immuno-biological effects of AFB1 and AFB1-FB1 mixture in experimental subchronic mycotoxicoses in rats. Toxicology 186:159–170
- Towner, R. A., Qian, S. Y., Kadiiska, M. B., and Mason, R. P. 2003. In vivo identification of aflatoxin-induced free radicals in rat bile. Free Rad. Biol. Med. 35:1330–1340
- Tryphonas, H., Bondy, G., Miller, J. D., et al. 1997. Effects of fumonisin B1 on the immune system of Sprague-Dawley rats following a 14-day oral (gavage) exposure. Fundam. Appl. Toxocol. 39:53–59
- Ueno, Y., Iijima, K., Wang, S.-D., et al. 1997. Fumonisins as a possible contributing risk factor for primary liver cancer: A 3-year study of corn harvested in Haimen, China by HPLC and ELISA. Food Chem. Toxicol. 35:1143–1150
- van Heugten, E., Spears, J. W., Coffey, M. T., et al. 1994. The effect of methionine and aflatoxin on immune function in weanling pigs. J. Anim. Sci. 72:658–664
- van Rensburg, S. J., Cook-Mozaffari, P., van Schalkwyk, D. J., et al. 1985. Hepatocellular carcinoma and dietary aflatoxin in Mozambique and Transkei. Br. J. Cancer 51:713–726
- WHO (World Health Organization). 2001. Health and nutritional properties of probiotics in food including powder milk with live lactic acid bacteria. Available online at: http://www.who.int/foodsafety/publications/fs_management/en/ probiotics.pdf
- WHO (World Health Organization). 2002. Guidelines for the evaluation of probiotics in foods. Available online at: http://www.who.int/foodsafety/fs_management/en/probiotic_guidelines.pdf
- Wogan, G. N. 1992. Aflatoxin as risk factors for hepato-cellualar carcinoma in humans. Cancer Res. 52:2114–2118
- Yiannikouris, A., Francois, J., Poughon, L., et al. 2004. Adsorption of zearalenone by β-D-glucans in the Saccharomyces cerevisiae cell wall. J. Food Protect. 67:1195–1200
- Yu, M., Lien, J., Liaw, Y., and Chen, C. 1996. Effects of multiple factors for hepatocellular carcinoma on formation of aflatoxin B1-DNA adducts. Cancer Epidemiol. Biomarker Prevent. 5:613–619