
Abstract
The development of immune-dependent drug hypersensitivity reactions (IDHR) is likely to involve activation of the innate immune system to stimulate neo-antigen specific T-cells. Previously it has been shown that, upon oral exposure to several drugs with immune-adjuvant capacity, mice developed T-cell-dependent responses to TNP-OVA. These results were indicative of the adjuvant potential of these drugs. The present study set out to evaluate the nature of this adjuvant potential by focusing on early immune changes in the spleen, by testing several drugs in the same experimental model. Mice were exposed to one or multiple oral doses of previously-tested drugs: the non-steroidal-anti-inflammatory drug (NSAID) diclofenac (DF), the analgesic acetaminophen (APAP), the anti-epileptic drug carbamazepine (CMZ) or the antibiotic ofloxacin (OFLX). Within 24 h after the final dosing, early innate and also adaptive immune parameters in the spleen were examined. In addition, liver tissue was also evaluated for damage. Exposure to APAP resulted in severe liver damage, increased levels of serum alanine aminotransferase (ALT) and local MIP-2 expression. DF exposure did not cause visible liver damage, but did increase liver weight. DF also elicited clear effects on splenic innate and adaptive immune cells, i.e. increased levels of NK cells and memory T-cells. Furthermore, an increase in plasma MIP-2 levels combined with an influx of neutrophils into the spleen was observed. OFLX and CMZ exposure resulted in increased liver weights, MIP-2 expression and up-regulation of co-stimulatory molecules on antigen-presenting cells (APC). The data suggested that multiple immune parameters were altered upon exposure to drugs known to elicit immunosensitization and that broad evaluation of immune changes in straightforward short-term animal models is needed to determine whether a drug may harbor the hazard to induce IDHR. The oral exposure approach as used here may be applied in the future as an immunotoxicological research tool in this type of evaluation.
Introduction
Immune-dependent drug hypersensitivity reactions (IDHR) are an important reason for black box warnings or even withdrawal of a drug from the market. Unfortunately, due to their relatively rare occurrence, IDHR are often not noticed until a drug has been marketed for some time. Furthermore, their etiology is very complex and multiple inherent and environmental factors are known to contribute to the induction of IDHR (Zhang et al. Citation2011). Because of the idiosyncratic nature of IDHR, available standard toxicity studies do not suffice to identify these drug reactions and, instead, a panel of more mechanism-oriented models and methods are most likely needed to identify a drug’s potential to induce IDHR.
The prevailing hypotheses related to IDHR include so-called hapten-protein formation of reactive drug metabolites (Naisbitt et al. Citation2001, Citation2003; Antoine et al. Citation2008; Park et al. Citation2011) and the induction of cellular damage, leading to cellular stress and danger signals (Seguin & Uetrecht Citation2003). The former may result in presentation of drug-metabolites in conjunction with MHC-peptide complexes, whereas the latter may cause cell stress-associated up-regulation of costimulatory signals on antigen-presenting cells (APC) and, thus, efficient antigen presentation and T-cell sensitization. We and others have previously shown that up-regulation of costimulatory signals, collectively representing signal 2, is a key process in drug-induced immune responses (Pieters & Albers Citation1999; Pirmohamed et al. Citation2002; Seguin & Uetrecht Citation2003; Kaplowitz Citation2005; Nierkens et al. Citation2005a, Citationb; Uetrecht Citation2008). To demonstrate the capacity of a drug to provide co-stimulatory adjuvant signals, the potential to stimulate adaptive immune responses to unrelated bystander antigens, such as trinitrophenyl-ovalbumin (TNP-OVA), can be determined (Albers et al. Citation1997; Gutting et al. Citation1999, Citation2002; Nierkens et al. Citation2004).
Recently, we have explored the immunosensitizing potential of several immunostimulating drugs using oral exposures in inbred mouse strains; it was found that a number of model drugs known to induce IDHR were able to stimulate T-cell-dependent immune reactions to TNP-OVA. Among these were acetaminophen (APAP), diclofenac (DF), carbamazepine (CMZ), ofloxacin (OFLX), D-penicillamine and nevirapine (Nierkens et al. Citation2005c; Kwast et al. Citation2011). In the current study, we set out to identify early immunological changes in the spleen in response to four of these previously tested drugs, namely APAP, DF, CMZ and OFLX. Using the same experimental set-up with oral dosing and a generally non-toxic dose (based on previous studies; see Kwast et al. Citation2011), this study showed that all used drugs induced a mild-to-moderate stimulation of innate immune responses.
Materials and methods
Mice
C3H/HeN mice (female, 4–6-weeks-of-age; n = 8/treatment group) were purchased from Harlan (Venlo, the Netherlands). Mice were specific pathogen-free and housed under barrier conditions in filter-topped macrolon cages with woodchip bedding in a facility maintained at 23 ± 2 °C, with a 50–55% relative humidity and a 12-h light/dark cycle. Drinking water and standard laboratory food pellets were provided ad libitum. Female mice were used since they are known to fight less and are, therefore, less stressed compared to male mice. All experiments were conducted according to the guidelines of, and with permission from, the Animal Experiments Committee of Utrecht University.
Chemicals
Chemicals used for oral administration were obtained from Sigma-Aldrich (Zwijn-drecht, the Netherlands). All compounds used for oral administration were dissolved in distilled water. Carbamazepine was dissolved in a 1% carboxymethylcellulose (CMC) solution in distilled water. Tissue culture reagents were purchased from Invitrogen Life Technologies (Paisley, Scotland) or Greiner Bio-one (Frickenhausen, Germany).
Oral exposure protocol
Mice received ofloxacin (OFLX), acetaminophen (APAP), carbamazepine (CMZ) or diclofenac (DF) by oral gavage, according to the dosing regimen depicted in . OFLX was given at a dose of 300 mg/kg; CMZ at a dose of 100 mg/kg; APAP at a dose of 300 mg/kg and DF at a single dose of 75 mg/kg or seven doses of 10 mg/kg. The different regimens were chosen using the maximum tolerable dose, as described in the datasheet of the compounds and as used in previous experiments (Kwast et al. Citation2011); thus, no dose–response experiments were performed here. To prevent severe stomach ulceration, the repeated exposures with DF were done using a relatively low dose. At 17–24 h following the final oral dosing, blood was drawn (by cheek-pouch puncture) and both plasma and serum were collected for further analysis (). Subsequently, the mice were euthanized by cervical dislocation. At necropsy, a part of the liver was removed, snap-frozen in liquid N2, and stored at −80 °C until further analysis. The spleen was removed in total and weighed immediately. Subsequently a part of the spleen was removed, weighed again and used for splenocyte isolation. The other part of the spleen was snap-frozen in liquid N2 and stored at −80 °C until further analysis.
Figure 1. Experimental protocol. C3H/HeN mice (n = 8/group) were treated orally with either a single (dosing frequency 1×) or multiple doses (dosing frequency 7×) of DF, APAP, CMZ or OFLX. Within 24 h after the last oral dose, blood was drawn via cheek-pouch puncture. Subsequently, the animals were euthanized and the liver and spleen were removed for analysis.
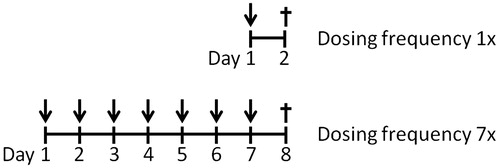
Table 1. Oral dosing scheme.
Splenocyte isolation
A part of the spleen was made into a single cell suspension by first placing it into ice-cold complete RPMI 1640 supplemented with 2.5% fetal calf serum and 1% penicillin/streptomycin (RPMI/2.5%). Cells were mashed through a 70-μm cell strainer, red blood cells were removed by incubating the cells with a hypotonic lysis buffer (0.16 M NH4Cl, 10 mM KHCO3, 0.1 mM Na2EDTA [pH 7.4]) on ice for 1 min followed by a single wash with phosphate-buffered saline (PBS, pH 7.4). Cells were then washed twice with RPMI/2.5% and finally re-suspended in ice-cold complete RPMI 1640 supplemented with 10% fetal calf serum and 1% penicillin/streptomycin (RPMI/10%). Cell numbers were determined using a Coulter Counter (Beckman Coulter, Woerden, The Netherlands) and adjusted to 106 viable cells/ml. Total spleen cellularity was subsequently re-calculated using counted cell numbers and the ratio between total spleen weight and the weight of the part used for splenocyte isolation.
Flow cytometry
For flow cytometric analysis, aliquots of 2–5 × 10⁵ cells were stained in FACS buffer (PBS containing 0.25% bovine serum albumin (BSA), 0.5 mM EDTA and 0.05% NaN3). Antibodies labeled with fluorescein isothiocyanate (FITC), R-phycoerythrin (RPE), perinidin chlorophyll protein (PerCP) or allophycocyanin (APC) were used to identify various immune subsets. After a pre-incubation with anti-CD16/CD32 (2.4G2) to block FcR (to inhibit non-specific binding), cells were incubated with the specific antibodies (at manufacturer-recommended levels) for 30 min at 4 °C in the dark, then fixed and stored in 0.4% formaldehyde until acquisition.
Leukocytes were characterized using (antibodies obtained from eBioscience, San Diego, CA or BD-Pharmingen, Eerenbodegem, Belgium) as follows: T-cells – CD4 (clone RM4-5)-PerCP, CD62L-APC (clone MEL-14), CD8α (clone 53-6.7)-FITC and CD44 (clone IM7)-PE; B-cells – CD19 (clone 1D3)-APC, CD86 (clone GL-1)-PerCP, CD80 (clone 16-10A1)-PE, MHCII (clone M5/114.15.2)-FITC; DC – CD11c (clone HL3)-APC, CD86 (clone GL-1)-PerCP, CD80 (clone 16-10A1)-PE; Neutrophils – CD11b (clone M1/70)-PE, Gr-1 (clone RB6-8C5)-FITC; and NK cells – CD49b (clone DX5)-APC, CD3 (clone 145-2C11)-PerCP Cy5.5. Data was acquired on a FACS Calibur (Becton Dickinson) flow cytometer and analysis was performed using Weasel software (v.3.0, Walter and Eliza Hall Institute of Medical Research, Melbourne, Australia). A minimum of 50 000 events/sample was acquired. Back-gating was performed to determine purity of the different populations. Since the experiments were performed on different days, inter-experimental variations in cell percentages may occur. Therefore, all drug-exposed groups are compared to their specific vehicle control group.
mRNA isolation and cDNA synthesis
RNA from spleen and liver was isolated by phenol-chloroform extraction using RNA instapure (Eurogentec, Maastricht, the Netherlands). Purity and concentration of the RNA was determined spectrophotometrically using a nanodrop technique at absorbance wavelengths of 260 and 280 nm. RNA samples were then stored at −80 °C until further analysis. Complementary DNA (cDNA) was synthesized using 66.7 μg/ml of RNA using a iScript cDNA synthesis kit (BioRad, Veenendaal, the Netherlands), according to manufacturer instructions.
Reverse transcriptase-quantitative polymerase chain reaction (RT-qPCR)
RT-qPCR was performed using the iCycler iQ system (BioRad) and amplification was performed using a IQTM SYBR Green super-mix (BioRad). Each PCR master-mix contained 100 nM forward and reverse primer (for sequences, see ) and 0.3 μl RNAse-free water per sample. Reactions were amplified using the following thermal profile: 95 °C for 3 min followed by 40 cycles of 61 °C for 15 s and 95 °C for 45 s. For each sample, the expression of MIP-2 mRNA was normalized for the Ct value of β-actin.
Table 2. Primer sequences.
Serum MIP-2 analyses
Serum MIP-2 levels were determined by sandwich ELISA. In brief, half-area plates were coated with 0.25 μg/ml rabbit anti-mouse MIP-2 (Koma Bioscience, Seoul, Korea) in a 50 mM carbonate buffer (pH 9.6) and incubated overnight at 4 °C. Thereafter, the plates were washed with PBS/0.01% Tween-20 (PBS-T) and non-specific binding was blocked by incubation with a PBS-T/1% bovine serum albumin (PBS-T/BSA) solution for 1 h at room temperature. After washing the wells with PBS-T, samples and standards were added to designated wells (in several dilutions in PBS-T/BSA) and the plates were incubated at room temperature for 2 h. Subsequently, the plates were again washed with PBS-T and the wells then received 0.125 μg/ml biotinylated-rabbit anti-mouse MIP-2 (Koma Biotech) diluted in PBS-T/BSA for 1.5–2.0 h at room temperature. The plates were then washed with PBS-T and then the wells received streptavidin-poly-horseradish peroxidase (HRP; Sanquin, Amsterdam, the Netherlands) in PBS-T/BSA and the plates were again incubated for 30 min at room temperature. After a final wash with PBS-T, tetramethylbenzidine (TMB) substrate solution was added to each well for ≈10 min before the color reaction in each was stopped by addition of 2 M H2SO4 stop solution. The absorbance in each well was then measured at 450 nm on an Asys Expert 96 reader (Biochrom, Cambridge, UK). Levels of MIP-2 in each sample were calculated by extrapolation from the standard curve generated in parallel.
Liver enzymes
Alanine aminotransferase (ALT) and alkaline phosphatase (ALP) were analyzed in plasma samples using an AU400 Chemistry System (Beckman Coulter Nederland B.V., Woerden, the Netherlands) at NOTOX B.V. (‘s-Hertogenbosch, the Netherlands).
Statistical analysis
Multiple comparisons of group means were analyzed using one-way analysis of variance (ANOVA) with a Bonferroni post-hoc test. A p value < 0.05 was considered significantly different when compared to controls or vehicle-treated groups. All analyses were done using Prism 5 for Windows software (Graphpad Inc., San Diego, CA).
Results
Alterations on liver weight and morphology
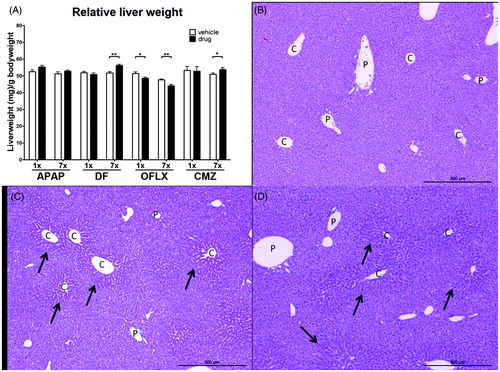
Systemic effects induced by drug administration were determined by measuring body weight, liver weight and liver morphology after single (1×) or multiple (7×) exposures. No changes in body weight were observed in the drug-exposed groups compared to vehicle-exposed control animals (data not shown), indicative of the absence of overt toxicity. Relative liver weight, however, was influenced by several of the compounds (). Multiple doses of DF and CMZ resulted in a significant increase in liver weight compared to vehicle-treated animals. Both single and multiple oral doses of OFLX significantly decreased relative liver weights when compared to values in the vehicle-treated controls. Exposure to APAP did not change the relative liver weight, but nevertheless clearly resulted in liver damage when compared to vehicle-treated controls. This damage was microscopically visible by a presence of necrosis around the central vein areas accompanied by cell swelling and loss of clear hepatic structure. There was no clear difference in liver damage between the groups receiving the single or seven doses of APAP (). None of the other drugs caused liver damage at the doses used (data not shown).
Figure 2. Relative liver weight and liver morphology following drug exposure. C3H/HeN mice (n = 8/group) were treated orally with either a single or multiple doses of DF, APAP, CMZ or OFLX. Within 24 h following the final dose, the mice were weighed and sacrificed. The liver was isolated and weighed; a portion was fixed and embedded for morphological analysis. (A) Relative liver weight compared to body weight was determined. Vehicle- (open bars) and drug-exposed (black bars) animals. Values shown are the mean of the vehicle- or drug-exposed group ± SEM. *p < 0.05, **p < 0.01; value significantly different compared to respective vehicle-exposed group. (B–D) H&E staining performed on liver tissue of APAP- exposed mice. Portal areas (P) and central vein areas (C) are indicated.
Changes in plasma liver enzymes
The liver enzymes ALT and ALP were measured in plasma of drug-exposed mice as an indication of liver damage (). Multiple dosing of APAP or CMZ and a single dose of OFLX resulted in significantly increased plasma levels of ALT when compared to vehicle-exposed controls. Remarkably, exposure to DF resulted in decreased plasma ALT levels. Plasma ALP levels were significantly decreased after the single dose of DF and after multiple doses of APAP or DF. Oral exposure to CMZ or OFLX did not change plasma ALP levels.
Table 3. Plasma levels of liver enzymes.
Changes in spleen weights and cellularity
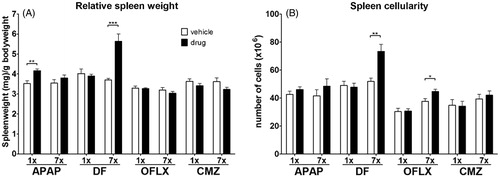
The current study focused on the spleen as an important immunological organ closely linked to the liver, and possibly involved in early phases of immunostimulating effects of drugs. A single dose of APAP or multiple doses of DF significantly increased relative spleen weight (), but exposure to CMZ or OFLX did not change in relative spleen weight. Multiple doses of DF and OFLX resulted in increased splenic cellularity. Exposure to APAP or CMZ did not alter the cellularity of the spleen ().
Figure 3. Relative spleen weight and cellularity. C3H/HEN mice (n = 8/group) were exposed orally to vehicle (open bars) or either a single or multiple doses of DF, APAP, CMZ or OFLX (black bars). Within 24 h following the final oral administration, the mice were euthanized and their spleens isolated. (A) Relative spleen weight compared to body weight and (B) total spleen cellularity were determined. Values shown are the mean of the vehicle- or drug-exposed group ± SEM. *p < 0.05, **p < 0.01, ***p < 0.001; value significantly different compared to vehicle controls.
Changes in MIP-2 and influx of neutrophils
Neutrophils are one of the innate immune players frequently shown to be involved in early immunotoxic insults. Since MIP-2 is an important chemokine involved in neutrophil attraction to sites of inflammation, we determined expression of MIP-2 in the spleen and the liver, serum levels of MIP-2 and subsequent percentages of neutrophils in the spleen.
In the liver, a single dose of CMZ or OFLX already increased MIP-2 expression (). Single doses of DF or APAP increased MIP-2 expression in the spleen and significantly increased serum levels of MIP-2 when compared to vehicle-exposed controls. Single doses of OFLX and CMZ decreased MIP-2 expression in the spleen () and serum levels of MIP-2 (), respectively. Only multiple doses of DF significantly increased the percentage of neutrophils (Gr-1+CD11b+) in the spleen ().
Figure 4. MIP-2 expression in spleen in lever, MIP-2 levels in serum and percentage of neutrophils in the spleen. C3H/HEN mice (n = 8/group) were treated orally with either vehicle (open bars) or a single or multiple doses of DF, APAP, CMZ or OFLX (black bars). At 17–24 h following the final dose, the mice were euthanized and parts of their (A) liver and (B) spleen were isolated and used for analysis of MIP-2 RNA expression. Values < 1 indicate decreased and those >1 indicate increased gene expression compared to controls. Values are represented as mean fold-increase [± SEM]. (C) Serum MIP-2 levels were determined using ELISA. (D) Percentages of neutrophils (Gr-1+CD11b+) in the spleen were determined using flow cytometry. Values represent the mean for the vehicle- or drug-exposed hosts ± SEM. *p < 0.05, **p < 0.01, ***p < 0.001; value significantly different compared to vehicle controls.
![Figure 4. MIP-2 expression in spleen in lever, MIP-2 levels in serum and percentage of neutrophils in the spleen. C3H/HEN mice (n = 8/group) were treated orally with either vehicle (open bars) or a single or multiple doses of DF, APAP, CMZ or OFLX (black bars). At 17–24 h following the final dose, the mice were euthanized and parts of their (A) liver and (B) spleen were isolated and used for analysis of MIP-2 RNA expression. Values < 1 indicate decreased and those >1 indicate increased gene expression compared to controls. Values are represented as mean fold-increase [± SEM]. (C) Serum MIP-2 levels were determined using ELISA. (D) Percentages of neutrophils (Gr-1+CD11b+) in the spleen were determined using flow cytometry. Values represent the mean for the vehicle- or drug-exposed hosts ± SEM. *p < 0.05, **p < 0.01, ***p < 0.001; value significantly different compared to vehicle controls.](/cms/asset/6ff98028-3289-4bae-abd9-20dcfd552f50/iimt_a_1139643_f0004_b.jpg)
Drug-induced changes on various leukocyte subsets
To explore the effect of selected drugs on leukocytes relevant to activation of both innate and adaptive immunity, the current study analyzed the presence of NK cells, dendritic cells (DC) and of subsets of T-cells in the liver and spleen. We also analyzed changes in T-cell subsets in particular because they may reflect changes in innate immune responses.
Changes in absolute number of NK cells in the spleen
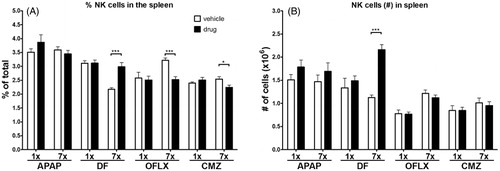
Multiple doses of DF significantly increased the percentage of NK (CD3−CD49b+) cells in the spleen, whereas multiple doses of OFLX or CMZ decreased the percentage of NK cells in the spleen (). The absolute number of these cells, using the cellularity of the spleen, was significantly increased by the multiple doses of DF, but not by multiple doses of APAP, OFLX, or CMZ (). Single doses of the drugs had no impact on either of these endpoints.
Figure 5. Percentages and absolute numbers of NK cells in the spleen. C3H/HEN mice (n = 8/group) were exposed orally to either a single or multiple doses of DF, APAP, CMZ or OFLX. Within 24 h after the final oral administration, mice were euthanized and the (A) percentages and (B) absolute numbers of splenic NK cells (CD3−CD49b+) were determined by flow cytometry. Vehicle- (open bars) and drug- (black bars) exposed hosts. *p < 0.05, **p < 0.01; value significantly different compared to vehicle-exposed controls.
Changes of CD4+ and CD8+ T-cells in spleen
The drug effects on proportions of CD4+ and CD8+ T-cells as well as on their differentiation status, i.e. naive (CD62L+CD44−), effector (CD62L+CD44+) and memory (CD62L−CD44+) was assessed. It appeared that the percentages of these subsets of T-cells were not or hardly affected, although some changes appeared statistically significant. For instance, APAP exposure did not result in changes in percentages of various T-cell subsets (), but a single dose of DF decreased the percentage of CD8+ T-cells and not of any of the other T-cell sub-sets (). Multiple doses of DF appeared more effective and significantly decreased both CD4+ and CD8+ T-cell percentages, decreased the percentage of naive CD4+ T-cells, but increased both CD4+ and CD8+ memory populations (). A single dose of OFLX did not change percentages of T-cell subsets (), whereas multiple doses of OFLX slightly increased CD8+ T-cell percentages (). A single dose of CMZ did not alter CD4+ or CD8+ T-cell percentages, but did increase the percentage of effector CD4+ T-cells (). Multiple doses of CMZ again did not change the percentage of CD4+ or CD8+ T-cells. CMZ exposure increased the percentage of naive CD8+ T-cells and decreased the percentage of effector CD8+ T-cells ().
Figure 6. Percentages of CD4+ and CD8+ T-cell numbers in spleen and relative T-cell subsets. C3H/HEN mice (n = 8/group) were exposed orally to either a single or multiple doses of (A, B) APAP, (C, D) DF, (E, F) OFLX or (G, H) OFLX. Within 24 h following the final oral administration, mice were euthanized and absolute CD4+ and CD8+ T-cell numbers were determined in spleens of vehicle- (open bars) and drug- (black bars) exposed hosts. Percentages of naive (CD62L+CD44−), effector (CD62L+CD44+) and memory (CD62L−CD44+) within splenic CD4+ and CD8+ T-cells were also determined. Values represent means of the vehicle- or drug-exposed group ± SEM. *p < 0.05, **p < 0.01, ***p < 0.001; value significantly different compared to vehicle controls.
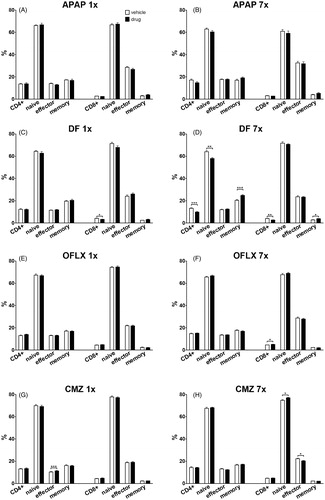
So, of all the tested drugs, only CMZ and DF caused slight effects after a single dose. Upon multiple dosing, DF caused clear effects on various T-cell subsets, whereas the other drugs did not have any effect (APAP) or induced minor changes. Apparently, exposure to the investigated drugs caused at most minor changes in T-cell subsets at the timepoints analyzed.
All drugs affected expression of co-stimulatory molecules by APC
The effect of oral drug exposure on the percentage of APC, i.e. DC and B-cells in the spleen, was determined as well as their expression of co-stimulatory molecules. A single dose of OFLX and both a single and multiple doses of DF significantly increased the percentage of DC in the spleen. Exposure to a single dose of APAP or multiple doses of OFLX decreased splenic DC percentages (). APAP exposure decreased, whereas OFLX exposure increased, the expression of the co-stimulatory molecule MHC II on the DC (). One dose of APAP, DF or CMZ or multiple doses of OFLX decreased CD80 expression by DC, whereas a single dose of OFLX significantly increased CD80 expression on DC (). A single dose of APAP or CMZ significantly decreased the expression of CD86 decreased on DC. A single dose of OFLX and multiple doses of CMZ induced increased CD86 expression ().
Figure 7. Expression of co-stimulatory molecules on APC. C3H/HEN mice (n = 8/group) were exposed orally to vehicle (open bars) or a single or multiple doses of DF, APAP, CMZ or OFLX (black bars). Within 24 h after the final oral administration, mice were euthanized and the percentage of (A) dendritic cells (DC; CD11c+) and (E) B-cells (CD19+) in the spleen was determined using flow cytometry. Subsequently, expression of co-stimulatory molecules MHC II, CD80 and CD86 on DC (B–D, respectively) and B-cells (F–H, respectively) was determined using the mean fluorescent intensity (MFI) compared to that by cells from vehicle-exposed controls. Values represent means of the vehicle- or drug-exposed group ± SEM. *p < 0.05, **p < 0.01, ***p < 0.001; value significantly different compared to vehicle controls.
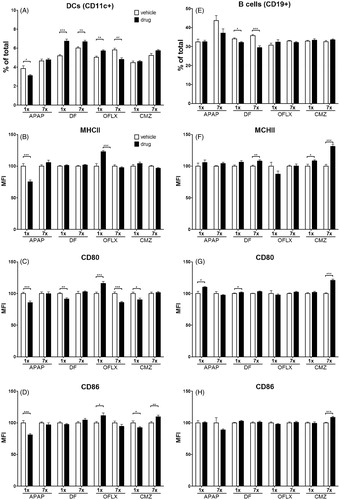
Oral exposure to DF significantly decreased the number of B-cells in the spleen (). Exposure to multiple doses of DF, OFLX or CMZ significantly up-regulated the expression of MHC II by B-cells (). A single dose of APAP or DF and multiple doses of CMZ increased CD80 expression on B-cells () and repeated exposure to CMZ caused an increase in CD86 expression on B-cells ().
Discussion
This study set out to describe drug-induced changes, with particular focus on early innate immune parameters. Previously, we have shown that several drugs known to cause IDHR, i.e. D-penicillamine, nevirapine, APAP, DF, OFLX and CMZ stimulate T-cell responses to TNP-OVA, used as a bystander antigen (Nierkens et al. Citation2004, Citation2005c; Kwast et al. Citation2011). In addition, D-penicillamine and DF have been shown to stimulate non-cognate IgG1 responses to the T-cell-independent antigen TNP-Ficoll. The latter is indicative of drugs-specific T-cell sensitization (Gutting et al. Citation1999; Nierkens et al. Citation2004), which for OFLX, CMZ and DF matched with findings of specific T-cells in drug-sensitized patients (Boelsterli Citation2003; Naisbitt et al. Citation2003; Beeler et al. Citation2006; Schmid et al. Citation2006; Wu et al. Citation2006).
Four of these previously-tested drugs were selected to test in this study for particular reasons, the main one being that they are all known to cause liver damage under certain conditions. APAP is well known for its clear liver damaging effect that is both dose- and metabolism-dependent (Rashed et al. Citation1990; Roberts et al. Citation1990; James et al. Citation2003). Furthermore, the formation of drug-protein adducts has been described for APAP (Switzar et al. Citation2013). The widely-used non-steroidal anti-inflammatory drug (NSAID) DF can induce rare but severe hepatotoxicity and also forms metabolites and subsequent drug-protein adducts (Boelsterli Citation2003; Naisbitt et al. Citation2007). DF is also known to cause gastrointestinal inflammation that possibly influences immune responses induced by this drug. This may happen in a similar manner as DF influences the response to food allergens (Bol-Schoenmakers et al. Citation2011). The formation of metabolites and subsequent drug-protein adducts has also been described for the anti-epileptic drug CMZ (Lillibridge et al. Citation1996; Ju & Uetrecht Citation1999; Njoku Citation2010). In man, adverse reactions to CMZ also involve allergy-like skin reactions, pointing towards involvement of specific T-cells (Naisbitt et al. Citation2003; Roychowdhury & Svensson Citation2005). Based on the above-mentioned and other previous studies, we utilized the fluoroquinolone OFLX as a suspected IDHR-causing drug (Rubinstein Citation2001; Weaver et al. Citation2005). Whether IDHR by fluoroquinolones depends on metabolism is not known; studies using trovafloxacin showed that toxic liver effects depended on co-exposure to microbial components such as lipopoly-saccharide (LPS) that elicited tumor necrosis factor (TNF)-α. In addition, for several fluoroquinolones, drug-specific T-cells as well as systemic immune derangements have been described in man (Schmid et al. Citation2006). The chosen compounds therefore represented several classes of drugs commonly associated with IDHR, i.e. NSAIDS, anti-convulsants and antibiotics.
We focused our analyses on the spleen, since it is an easily accessible organ to determine both innate and adaptive immune components, but more importantly because the spleen has a presumably central role in translating early innate organ-specific effects from, e.g. the liver or intestine, to IDHR-like systemic phenomena. Of note, to our knowledge, this is the first study to investigate multiple drugs in a similar experimental set-up, possibly providing a set of shared parameters that can be included in future drug testing for IDHR.
The present data showed that in all cases drug-exposure related effects occurred in the spleen. However, effects of the drugs tested here were mostly mild but, nevertheless, did not point towards comparable changes in innate immunity. Clearly none of the drugs caused a clear change in any of the T-cell subsets, which may be linked to the low damaging insult of the drugs at the dosing regimens, as used in this study. Previous studies showed that exposure to APAP resulted in formation of NAPQI-albumin adducts in serum (Switzar et al. Citation2013). Nevertheless, this did not result in effects on T-cell subsets, possibly also suggesting that the time-course of this experiment might just be too short to elicit clear adaptive immune responses. In line with this, minor changes in the expression of co-stimulatory molecules on DC- or B-cells were only occasionally observed. In addition, we previously were able to detect delayed-type hypersensitivity (DTH) responses to TNP-OVA, elicited by the same drugs, on Day 15 after the start of exposure (Kwast et al. Citation2011). However, all drugs tested here induced varying changes in MIP-2 production and in the numbers of neutrophils and NK cells. The fact that changes were not consistent when all drugs were compared suggested to us that, indeed, individual drug classes may have additional requirements to elicit clear IDHR-inducing, i.e. inflammatory or adjuvant effects.
Development of IDHR is a multi-factorial process involving dosing and timing regimens, route of exposure, factors related to ADME and various internal (e.g. immunological polymorphisms) and external environmental (e.g. microbe and diet-related) factors. Probably, adaptation or inclusion of one if not all of these factors is needed to induce IDHR-like effects. We obviously have chosen to use one specific mouse strain of one gender, i.e. female C3H/He, to circumvent variation due to genetic polymorphisms and based on previous experiments with reporter antigens (Nierkens et al. Citation2004, Citation2005c; Kwast et al. Citation2011). Other groups used BALB/c of C57BL/6 mice, but never in a comparison study (Shaw et al. Citation2009a; Higuchi et al. Citation2012).
The influence of dosing was demonstrated for CMZ by Higuchi et al. (Citation2012), who found increased levels of plasma liver enzymes and of various cytokines only after a specific dosing regimen, i.e. after four repeated doses of 400 mg/kg and an additional fifth challenge-like dose of 800 mg/kg. In our hands, higher doses of CMZ than the one used (100 mg/kg) caused strong sedative effects, resulting in long-lasting (up to 24 h) immobility of the animals (unpublished data). Higuchi et al. (Citation2012) did not mention anything about this; however, because of these sedative effects, we were not able to increase the dose.
The route of exposure may also be of importance. Others have demonstrated that intraperitoneal dosing of 80 mg/kg of DF can result in clear hepatic and immunological (i.e. cytokine level) changes (Yano et al. Citation2012). Repetitive oral dosing of 75 mg/kg, however, resulted in severe stomach bleeding in mice (unpublished data). Therefore, we preferred to use the relatively low oral dose in the case of the 7-days exposure period. This dose, however, was sufficient to enhance food allergic responses in a mouse model for peanut allergy (Bol-Schoenmakers et al. Citation2011). This effect involved clear stress to the gut epithelium (e.g. flattening of epithelial cells) that may be relevant to current findings and possibly to human situations as well.
Environmental factors, e.g. microbial products such as LPS or lipoteichoic acid (LTA) entering from the gut, may influence cellular and molecular processes, ultimately leading to additional cell stress. This, in turn, may elicit production of cytokines such as TNFα, chemokines such as MIP-2 and subsequent activation of first line-of-defense cells, such as NK cells and neutrophils. The kinetics of these changes may vary per environmental factor, but it may also vary per drug (Deng et al. Citation2006, Citation2009; Luyendyk et al. Citation2006; Shaw et al. Citation2009a,Citationb, Citation2010). The experimental liver injury model using trovafloxacin is by far the best example demonstrating the need for co-exposure of a drug with LPS or TNFα (Shaw et al. Citation2007, Citation2009a,Citationb). In that model, TNFα appeared to be crucial and sufficient to trigger the hepatotoxicity caused by trovafloxacin. Possibly, co-exposure to TNFα was also needed to cause clear immunotoxic liver damage in the case of OFLX.
Regardless of the above-mentioned complicating factors, all drugs tested here showed effects that were indicative of involvement of the innate immune system that would fit with early stages development of IDHR. This includes early changes in the liver (in case of APAP and DF), changes in innate parameters (neutrophil influx, levels of neutrophil attracting chemokine MIP-2 or levels of NK cells) and in minor changes in expression of costimulatory molecules on APC. Exposure to APAP resulted in clear liver damage, but this did not result in increased numbers of neutrophils or NK cells in the spleen. It is well-known that the liver injury caused by APAP is accompanied by a local increase in numbers of neutrophils. The increase in MIP-2 levels in the spleen may just not be sufficient to deviate the neutrophils from the liver to the spleen. Also, the number of NK cells may have been changed in the liver instead of the spleen, as an influence of NK cells during APAP-induced hepatotoxicity has been described. Notably, when these cells were depleted, a reduction in APAP induced liver damage was observed (Masson et al. Citation2008).
Conclusions
Using a straightforward oral exposure set-up, our data showed for the first time that a number of defined classes of drugs known to be able to cause IDHR and/or liver toxicity induced subtle changes in innate immune parameters that together would be alarming enough to pursue more detailed follow-up immunotoxicity studies. This suggested to us that the inclusion of multiple immune parameters may serve as first biomarkers to determine the hazard of a drug to induce IDHR. As such, we conclude that a short-term oral exposure approach as used here would possibly fit in a test strategy to assess immune-sensitizing drug effects. Clearly, such a strategy would include further studies to investigate the influence of additional factors (i.e. microbial components or dosing) on individual drugs.
Acknowledgments
The authors greatly acknowledge the technical support provided by Dr. M. Stitzinger and M.H.M van Tuyl, MSc and the technicians of WIL Research (‘s-Hertogenbosch, The Netherlands) for measuring liver enzymes. This project was funded by Dutch Top Institute Pharma project “Towards novel translational safety biomarkers for adverse drug toxicity” [D3-201-1] and the MIP-DILI project, a European Community grant under the Innovative Medicines Initiative (IMI) Program [115336].
Disclosure statement
The authors report no conflicts of interest. The authors alone are responsible for the content and writing of the paper.
References
- Albers R, Broeders A, van der Pijl A, Seinen W, Pieters R. 1997. The use of reporter antigens in the popliteal lymph node assay to assess immunomodulation by chemicals. Toxicol Appl Pharmacol. 143:102–109.
- Antoine DJ, Williams DP, Park BK. 2008. Understanding the role of reactive metabolites in drug-induced hepatotoxicity: state of the science. Expert Opin Drug Metab Toxicol. 4:1415–1427.
- Beeler A, Engler O, Gerber BO, Pichler WJ. 2006. Long-lasting reactivity and high frequency of drug-specific T-cells after severe systemic drug hypersensitivity reactions. J Allergy Clin Immunol. 117:455–462.
- Boelsterli UA. 2003. Diclofenac-induced liver injury: A paradigm of idiosyncratic drug toxicity. Toxicol Appl Pharmacol. 192:307–322.
- Bol-Schoenmakers M, Bleumink R, Marcondes Rezende M, Mouser E, Hassing I, Ludwig I, Smit J, Pieters R. 2011. Diclofenac enhances allergic responses in a mouse peanut allergy model. Clin Exp Allergy. 41:424–433.
- Deng X, Luyendyk JP, Ganey PE, Roth RA. 2009. Inflammatory stress and idiosyncratic hepatotoxicity: Hints from animal models. Pharmacol Rev. 61:262–282.
- Deng X, Stachlewitz RF, Liguori MJ, Blomme EA, Waring JF, Luyendyk JP. 2006. Modest inflammation enhances diclofenac hepatotoxicity in rats: Role of neutrophils and bacterial translocation. J Pharmacol Exp Ther. 319:1191–1199.
- Gutting BW, Schomaker SJ, Kaplan AH, Amacher DE. 1999. A comparison of the direct and reporter antigen popliteal lymph node assay for the detection of immunomodulation by low molecular weight compounds. Toxicol Sci. 51:71–79.
- Gutting BW, Updyke LW, Amacher DE. 2002. Investigating the TNP-OVA and direct popliteal lymph node assays for the detection of immunostimulation by drugs associated with anaphylaxis in humans. J Appl Toxicol. 22:177–183.
- Higuchi S, Yano A, Takai S, Tsuneyama K, Fukami T, Nakajima M, Yokoi T. 2012. Metabolic activation and inflammation reactions involved in carbamazepine-induced liver injury. Toxicol Sci. 130:4–16.
- James LP, Mayeux PR, Hinson JA. 2003. Acetaminophen-induced hepatotoxicity. Drug Metab Disp. 31:1499–1506.
- Ju C, Uetrecht JP. 1999. Detection of 2-hydroxyiminostilbene in urine of patients taking carbamazepine and its oxidation to a reactive iminoquinone intermediate. J Pharmacol Exp Ther. 288:51–56.
- Kaplowitz N. 2005. Idiosyncratic drug hepatotoxicity. Nat Rev Drug Discov. 4:489–499.
- Kwast LM, Fiechter D, Hassing I, Bleumink R, Boon L, Ludwig IS, Pieters RHH. 2011. Oral exposure to drugs with immune-adjuvant potential induces hypersensitivity responses to the reporter antigen TNP-OVA. Toxicol Sci. 121:312–319.
- Lillibridge JH, Amore BM, Slattery JT, Kalhorn TF, Nelson SD, Finnell RH, Bennett GD. 1996. Protein-reactive metabolites of carbamazepine in mouse liver microsomes. Drug Metab Disp. 24:509–514.
- Luyendyk JP, Lehman-McKeeman LD, Nelson DM, Bhaskaran VM, Reilly TP, Car BD, Cantor GH, Maddox JF, Ganey PE, Roth RA. 2006. Coagulation-dependent gene expression and liver injury in rats given lipopolysaccharide with ranitidine but not with famotidine. J Pharmacol Exp Ther. 317:635–643.
- Masson MJ, Carpenter LD, Graf ML, Pohl LR. 2008. Pathogenic role of natural killer T- and natural killer cells in acetaminophen-induced liver injury in mice is dependent on the presence of dimethyl sulfoxide. Hepatology. 48:889–897.
- Naisbitt DJ, Britschgi M, Wong G, Farrell J, Depta JP, Chadwick DW, Pichler WJ, Pirmohamed M, Park BK. 2003. Hypersensitivity reactions to carbamazepine: Characterization of the specificity, phenotype, and cytokine profile of drug-specific T-cell clones. Mol Pharmacol. 63:732–741.
- Naisbitt DJ, Sanderson LS, Meng X, Stachulski AV, Clarke SE, Park BK. 2007. Investigation of the immunogenicity of diclofenac and diclofenac metabolites. Toxicol Lett. 168:45–50.
- Naisbitt DJ, Williams DP, Pirmohamed M, Kitteringham NR, Park BK. 2001. Reactive metabolites and their role in drug reactions. Curr Opin Allergy Clin Immunol. 1:317–325.
- Nierkens S, Aalbers M, Bleumink R, Boon L, Pieters R. 2005a. Drug-induced Type 1 and Type 2 immune responses are characterized by distinct profiles of cell kinetics, cytokine production, and expression of co-stimulatory molecules in the popliteal lymph node assay. J Immunotoxicol. 2:141–150.
- Nierkens S, Aalbers M, Bol M, Bleumink R, van Kooten P, Boon L, Pieters R. 2005b. Differential requirement for CD28/CTLA-4-CD80/CD86 interactions in drug-induced Type 1 and Type 2 immune responses to tri-nitrophenyl-ovalbumin. J Immunol. 175:3707–3714.
- Nierkens S, Aalbers M, Bol M, van Wijk F, Hassing I, Pieters R. 2005c. Development of an oral exposure mouse model to predict drug-induced hypersensitivity reactions by using reporter antigens. Toxicol Sci. 83:273–281.
- Nierkens S, Nieuwenhuijsen L, Thomas M, Pieters R. 2004. Evaluation of the use of reporter antigens in an auricular lymph node assay to assess immunosensitizing potential of drugs. Toxicol Sci. 79:90–97.
- Njoku DB. 2010. Suppressive and pro-inflammatory roles for IL-4 in the pathogenesis of experimental drug-induced liver injury: A review. Expert Opin Drug Metab Toxicol. 6:519–531.
- Park BK, Laverty H, Srivastava A, Antoine DJ, Naisbitt D, Williams DP. 2011. Drug bioactivation and protein adduct formation in the pathogenesis of drug-induced toxicity. Chem-Biol Interact. 192:30–36.
- Pieters R, Albers R. 1999. Assessment of autoimmunogenic potential of xenobiotics using the popliteal lymph node assay. Methods. 19:71–77.
- Pirmohamed M, Naisbitt DJ, Gordon F, Park BK. 2002. The danger hypothesis: Potential role in idiosyncratic drug reactions. Toxicology. 181:55–63.
- Rashed MS, Myers TG, Nelson SD. 1990. Hepatic protein arylation, glutathione depletion, and metabolite profiles of acetaminophen and a non-hepatotoxic regioisomer, 3′-hydroxyacetanilide, in the mouse. Drug Metab Disp. 18:765–770.
- Roberts SA, Price VF, Jollow DJ. 1990. Acetaminophen structure-toxicity studies: In vivo covalent binding of a nonhepatotoxic analog, 3-hydroxyacetanilide. Toxicol Appl Pharmacol. 105:195–208.
- Roychowdhury S, Svensson CK. 2005. Mechanisms of drug-induced delayed-type hypersensitivity reactions in the skin. AAPS J. 7:E834–846.
- Rubinstein E. 2001. History of quinolones and their side-effects. Chemotherapy. 47(Suppl 3):3–8.
- Schmid DA, Depta JP, Pichler WJ. 2006. T-Cell-mediated hypersensitivity to quinolones: Mechanisms and cross-reactivity. Clin Exp Allergy. 36:59–69.
- Seguin B, Uetrecht J. 2003. The Danger Hypothesis applied to idiosyncratic drug reactions. Curr Opin Allergy Clin Immunol. 3:235–242.
- Shaw PJ, Beggs KM, Sparkenbaugh EM, Dugan CM, Ganey PE, Roth RA. 2009a. Trovafloxacin enhances TNF-induced inflammatory stress and cell death signaling and reduces TNF clearance in a murine model of idiosyncratic hepatotoxicity. Toxicol Sci. 111:288–301.
- Shaw PJ, Ditewig AC, Waring JF, Liguori MJ, Blomme EA, Ganey PE, Roth RA. 2009b. Co-exposure of mice to trovafloxacin and lipopolysaccharide, a model of idiosyncratic hepatotoxicity, results in a unique gene expression profile and IFNγ-dependent liver injury. Toxicol Sci. 107:270–280.
- Shaw PJ, Ganey PE, Roth RA. 2010. Idiosyncratic drug-induced liver injury and role of inflammatory stress with an emphasis on an animal model of trovafloxacin hepatotoxicity. Toxicol Sci. 118:7–18.
- Shaw PJ, Hopfensperger MJ, Ganey PE, Roth RA. 2007. Lipopolysaccharide and trovafloxacin co-exposure in mice causes idiosyncrasy-like liver injury dependent on TNFα. Toxicol Sci. 100:259–266.
- Switzar L, Kwast LM, Lingeman H, Giera M, Pieters RH, Niessen WM. 2013. Identification and quantification of drug-albumin adducts in serum samples from a drug exposure study in mice. J Chromatography B. 917:53–61.
- Uetrecht J. 2008. Idiosyncratic drug reactions: Past, present, and future. Chem Res Toxicol. 21:84–92.
- Weaver JL, Chapdelaine JM, Descotes J, Germolec D, Holsapple M, House R, Lebrec H, Meade J, Pieters R, Hastings KL, et al. 2005. Evaluation of a lymph node proliferation assay for its ability to detect pharmaceuticals with potential to cause immune-mediated drug reactions. J Immunotoxicol. 2:11–20.
- Wu Y, Sanderson JP, Farrell J, Drummond NS, Hanson A, Bowkett E, Berry N, Stachulski AV, Clarke SE, Pichler WJ, et al. 2006. Activation of T-cells by carbamazepine and carbamazepine metabolites. J Allergy Clin Immunol. 118:233–241.
- Yano A, Higuchi S, Tsuneyama K, Fukami T, Nakajima M, Yokoi T. 2012. Involve-ment of immune-related factors in diclofenac-induced acute liver injury in mice. Toxicology. 293:107–114.
- Zhang X, Liu F, Chen X, Zhu X, Uetrecht J. 2011. Involvement of the immune system in idiosyncratic drug reactions. Drug Metab Pharmacokinet. 26:47–59.