
Abstract
Background and purpose — Surgical care and pain management for patients with fractures have evolved over the years. We wanted to ascertain if there were any changes in the incidence of non-unions and, if so, whether the use of non-steroidal anti-inflammatory drugs (NSAIDs), including COX-2 selective inhibitors, might have an effect.
Patients and methods — We used the National Inpatient Sample (NIS) to estimate the annual number of patients hospitalized for surgical treatment of a non-union between 1993 and 2012, and calculated age-adjusted rates of non-union. We estimated the prevalence of prescriptions for NSAIDs from 1996 through 2012 using the Medical Expenditure Panel Survey (MEPS). The interrupted time-series analysis was used to relate quarterly rates of non-union to changes in prescriptions for NSAIDs between 1996 and 2009.
Results — The annual estimate of non-unions in the USA declined 30% from 25,634 in 1993 to 17,815 in 2012 (p < 0.001). Specifically, the age-adjusted rate of non-unions decreased by 44% from 8.6 per 105 persons in 1996 to 4.8 per 105 persons in 2012 (p < 0.001). However, there was an 8% increase in the incidence rate of non-unions (p = 0.003) between 2000 and 2004, when certain COX-2 selective inhibitors were on the market and their prescriptions were prevalent at around 6% among those with fractures. A drop in non-union estimates from 22,321 in 2010 to 18,789 in 2011 (p = 0.04) also coincided with a marked decrease in prescriptions for NSAIDs in patients with fractures, from 22% to 14% (p = 0.02).
Interpretation — Non-unions in the USA declined substantially between 1993 and 2012, but this was interrupted by changes in prescriptions for NSAIDs, with sustained increases between 2000 and 2004 followed by transient decreases in 2005 and 2011.
Non-unions occur in 1–6% of patients with long-bone fractures (CitationWolinsky et al. 1999) and they can lead to pain and functional impairment, and possibly osteoarthritis (CitationMcKellop et al. 1991, CitationSanders et al. 2002, CitationCourt-Brown and McQueen 2008). Although non-unions are detrimental to individual patients, the overall burden of non-union to the healthcare system is unknown.
There are series of drugs that either impair or facilitate fracture repair (CitationAspenberg 2005, CitationPountos et al. 2008). For example, extensive basic science (CitationGerstenfeld et al. 2007) and some clinical data (CitationBurd et al. 2003, CitationDodwell et al. 2010) suggest that non-steriodal anti-inflammatory drugs (NSAIDs), including COX-2 selective inhibitors, may impede fracture healing, especially in long-bone fractures. Historical clinical studies have seldom corroborated the positive associations between use of NSAIDs and complications of fracture healing observed in animal models (CitationKurmis et al. 2012, CitationSimon and O’Connor 2007). However, one more recent study showed that exposure to NSAIDs prior to fracture may be associated with complications of fracture healing (CitationHernandez et al. 2012), as opposed to a role of NSAIDs used for postoperative pain control (CitationBhattacharyya et al. 2005). Other risk factors for non-union include age, sex, diabetes, use of corticosteroids, smoking, excessive alcohol use, and poor nutrition (CitationCalori et al. 2007).
We performed an epidemiological study to document the incidence of non-unions in the USA, to study the trends in non-union over the 2 last decades, and to relate any changes in trends to changes in the use of NSAIDs.
Material and methods
Data sources and samples
The National Inpatient Sample (NIS) is released annually by the Agency for Healthcare Research and Quality (AHRQ). NIS is designed to be a nationally representative sample of inpatient admissions to non-federal hospitals encompassing all payers, ages, and demographics, and it has been used in orthopedics because of its power to study rare outcomes (CitationWang and Bhattacharyya 2011). The dataset contains demographics, International Classification of Diseases Ninth Edition (ICD-9) diagnosis codes, and ICD-9 procedure codes on about 7 million admissions each year from 1996 to 2012. Because the data used was publicly available and only contained de-identified information, the study was exempted by the institutional review boards, and the AHRQ granted use of these data.
We identified admissions for non-unions using a principal ICD-9 diagnosis code of 733.82 with a matching procedure code. Thus, our report only covers non-unions treated surgically in the inpatient setting. We used principal ICD-9 procedure codes to classify the anatomic site of the non-union.
To study the use of NSAIDs, particularly COX-2 selective inhibitors such as Celecoxib and Recoxifib, we obtained data from the Medical Expenditure Panel Survey (MEPS) (CitationCohen 2003). The MEPS uses household interviews and pharmacy records from a representative national sample to document prescription drug use in the USA since 1996. We estimated (separately) the overall prevalence of medication prescriptions and specific prevalence for those with a diagnosis of fracture within the same year.
Data analysis
To estimate the incidence rate of non-union, we used either the US population or the weighted estimate of the overall number of fractures as the denominator. In cases where we used number of fractures, we conducted sensitivity analysis by using number of fractures in the previous time period as the denominator, since non-union is mainly a complication of the fracture healing process that may take months, and up to a year. Recognizing that patients with non-union could have multiple admissions, we analyzed the longitudinal data of the State Inpatient Dataset from New York in 2008, a source of data for the NIS. We found that the number of re-admissions of non-union patients within a calendar year was less than 0.1%.
The annual incidence rate of non-unions was presented as estimates of non-unions per 105 people, following adjustment by age and standardization to the population of the USA in 2000. The interrupted time-series analysis was conducted from 1996 through 2009 to analyze quarterly changes in incidence rates of non-union during market introduction of COX-2 selective inhibitors in 1999, and later withdrawal in 2004. We adopted 2 change points to accommodate both the introduction and the withdrawal of COX-2 selective inhibitors (CitationWagner et al. 2002). In addition, the seasonality of the fractures (higher in the winter months) indicates that the percentage of non-unions among those with fractures needs to be seasonally adjusted. In this regard, we added an autoregressive error term in the model with up to fifth-order autocorrelations, and we used a back-step automatic autocorrelation selection. Thus, we had the following model:
where
nnuqtr is the non-union rate at quarter qtr;
ß0 estimates the baseline non-union quarterly rate;
ß1 estimates the mean quarterly change in baseline non-union rate;
ß2 estimates the level change in quarterly rate following the introduction of COX-2 inhibitors;
ß3 estimates the mean quarterly change in non-union rate in the presence of COX-2 inhibitors, compared to the baseline trend;
ß4 estimates the level change in quarterly rate following the withdrawal of COX-2 inhibitors;
ß5 estimates the mean quarterly change in non-union rate after withdrawal of COX-2 inhibitors, compared to the trend in presence of COX-2 inhibitors;
eqtr represents autoregressive error term at quarter qtr.
We used the procedure AUTOREG from SAS version 9.2 (SAS Institute, Cary, NC) and set p < 0.05 as the significance level with 2-sided tests. Z-score test was used to compare national estimates and prevalence of prescriptions as population proportions.
Results
Demographic characteristics
We chose 1996, 2003, and 2009 as the comparison groups that represented the period before, during, and after the use of COX-2 selective inhibitors. In 2009, there were estimated to be 20,984 non-unions in the USA, as compared to 22,667 in 1996 and 25,426 in 2003. In patients less than 45 years old, there was a trend of a decline in non-unions from 1996—through 2003—to 2009. In comparison, the estimated numbers of non-unions increased from 1996 to 2003 in patients between 45 and 65 years of age, then from 2003 through 2009 the increase was mostly in patients who were 55 years or older. The tibia was the most common site, followed by the femur, femoral neck, humerus, radius, and spine. These 5 sites accounted for about 70% of all non-unions. Approximately 15% of all patients were uninsured. The majority of non-unions were treated in large teaching hospitals ().
Table 1. Patient and hospital characteristics associated with non-unions
General incidence trends
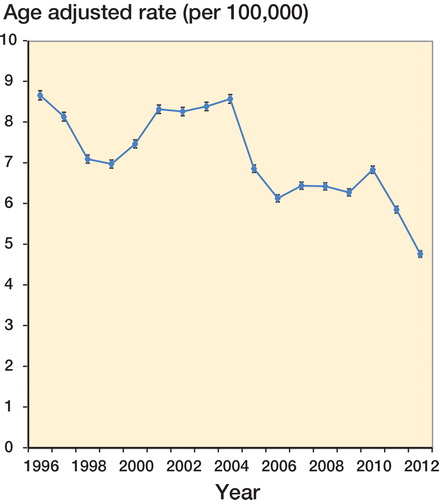
The national estimates of non-unions declined from 25,634 in 1993 to 21,057 in 2000, followed by a transient increase to 25,649 in 2004, and then down to 17, 815 in 2012 (). There were only 2 significant changes between 2 consecutive years, i.e. 2004–2005 (p = 0.007) and 2010–2011 (p = 0.04). The age-adjusted rate of non-union per 105 persons has declined by 23%—from 8.6 in 1996 to 6.6 in 2009 (p < 0.001). The annual estimates of all bone fractures remained largely unchanged: from 883,085 in 1993 to 888,630 in 2012. As a result, the number of non-unions per 100 fractures declined by 31% from 2.9% in 1993 to 2.0% in 2012 (p < 0.001). However, there was a transient increase in this percentage from 2000 to 2004 (from 2.5% in 2000 to 2.8% in 2004), which was equivalent to a 14% increase from 7.8 to 8.9 per 105 individuals during those 4 years ().
Figure 1. National estimates of non-unions in the USA during the period 1993–2012. The data are from the national inpatient samples from 1993–2012. Bars indicate standard error.
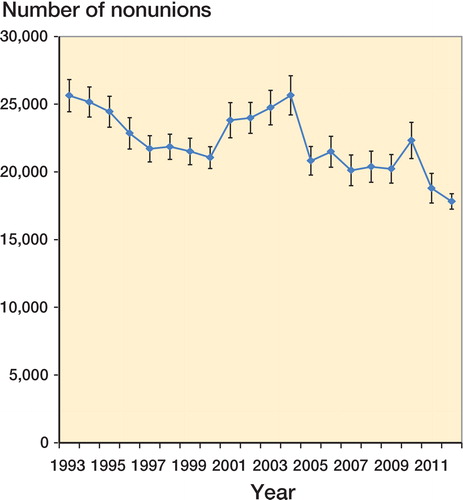
Figure 2. Incidence of non-union in the USA during the period 1996–2012. The data were adjusted for age and standardized to the US population in 2000. Bars indicate 95% confidence interval.
Prevalence of use of NSAIDs and COX-2 selective inhibitors
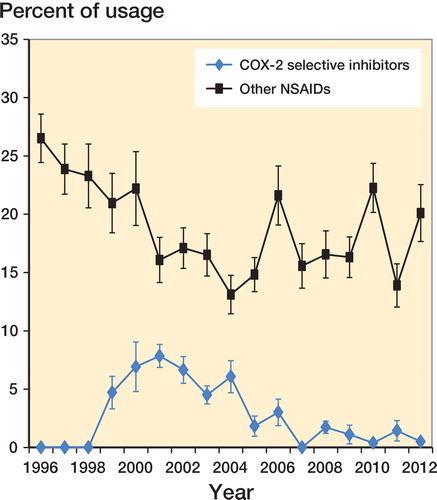
We estimated the prevalence of NSAIDs and COX-2 selective inhibitors from 1996 through 2012 in the US civilian population, since 1996 was the first year when MEPS started collecting data on the use of prescription medications. The prevalence of NSAID use has slowly declined, from 15.5% in 1996 to 11.8% in 2012 (). The decline was more evident from 2000 to 2004, a period during which the use of certain COX-2 selective inhibitors was prevalent. The prevalence of use of these COX-2 selective inhibitors increased from 3.3% in 1999 to 8.1% in 2001, plateaued until 2004, and then declined to 2.4% in 2005. Compared to the starting point of 14.8% in 1998, the overall use of combining these anti-inflammatory agents became significantly higher between 2000 and 2004—at 16.7% and 16.9%, respectively (). Similar patterns were observed for those with bone fractures (), except for a significant decrease in NSAID prescriptions from 2010 to 2011 that was not seen in the overall prevalence in (p = 0.02). The prevalence of smoking declined from 2000 (the first year that such data were available) to 2012, whereas that of diabetes increased (Figure 5, see Supplementary data).
Figure 3. Prevalence of anti-inflammatory drug prescriptions during the period 1996–2012. The prevalence of use of NSAIDs, COX-2 selective inhibitors, or both from the Medical Expenditure Panel Survey, 1996–2012. Bars indicate 95% confidence interval.
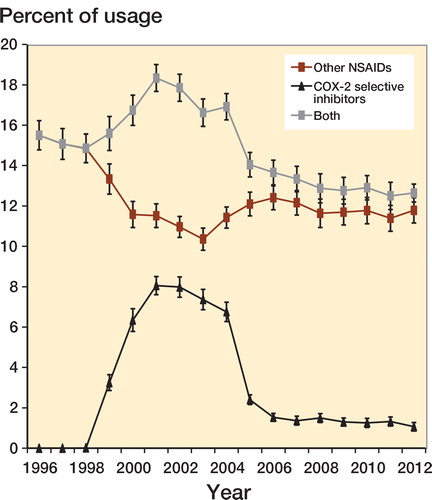
Figure 4. Prevalence of anti-inflammatory drug prescriptions in patients with fractures during the period 1996–2012. The prevalence of use of COX-2 selective inhibitors and other NSAIDs in patients with bone fractures, from the MEPS, 1996–2012. Bars indicate standard error. Significant differences between adjacent points were only detected for prevalence of prescriptions for COX-2 inhibitors between 2004 and 2005 (p = 0.01), and that of prescriptions for other NSAIDs between 2010 and 2011 (p = 0.02).
Interrupted time-series analysis
Based on the analysis above, we chose 2000 and 2004 as the change points for the interrupted time-series analysis. We found that during introduction of specific COX-2 inhibitors, the level of change in the non-union rate was not statistically significant, reflecting the slow onset of any effect. However, the time trend since introduction of COX-2 selective inhibitors was significant, indicating an increasing trend during prevalent use of COX-2 selective inhibitors relative to the baseline period (). After the market withdrawal of COX-2 selective inhibitors in 2004, the step decrease in the non-union rate was 0.51–20% of the baseline rate (p < 0.001). In addition, the time trend was also significant, reflecting a decreasing trend in non-unions after withdrawal of specific COX-2 inhibitors compared to the period of their prevalent use (p < 0.001) (). When we used fracture estimates from previous quarters as the denominators, we obtained similar results (data not shown).
Figure 6. Interrupted time-series analysis of quarterly non-union rates per 100 patients with fractures. Individual squares show the number of non-unions in the quarter divided by the number of fractures in that quarter. The gray line shows the average trend of the non-union rate. The solid line shows the time-series trend. The dashed line indicates the period when the use of specific COX-2 inhibitors was prevalent in the USA.
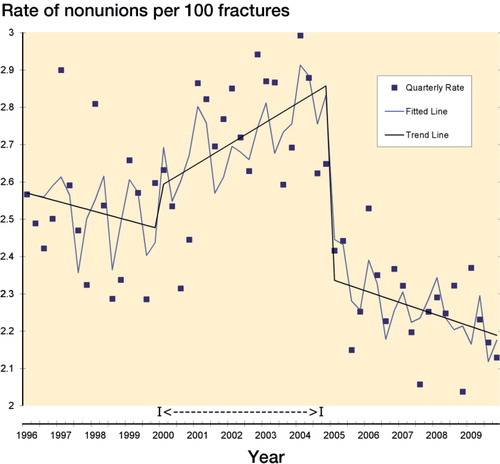
Table 2. Time trends (1996–2009) in the quarterly rates (%) of non-unions from introduction of certain COX-2 selective inhibitors (Coxibs) in 1999 to their withdrawal in 2004
Discussion
Our epidemiological analysis shows that overall burdens of non-union have declined substantially in the 2 decades from 1993 to 2012 in the USA. However, there were increases in the number of non-unions during the period 2000–2004, possibly due to a period of prevalent use of COX-2 selective inhibitors. A drop in prescriptions for NSAIDs from 2010 to 2011 also coincided with a decrease in non-unions.
It has been estimated that there are 105 fractures that go on to non-union each year in the USA (CitationHak et al. 2014), while our estimates were substantially lower. Delayed bone healing and non-union occur in 5–15% of bone fractures (CitationPraemer et al. 1992). Most of these estimates were presumably based on non-surgical methods such as computed tomography, which tended to be sensitive but of low specificity (CitationBhattacharyya et al. 2006). Our study methods were based on not just non-union diagnoses alone but related surgical treatments as well. Thus, our results support the argument that the “true” non-union rate is much lower than what most of the literature has suggested.
It is possible that our estimates were lower due to the fact that most NIS only contain short-term community hospitals that might have failed to capture some of these complications. For example, some hospitals in the NIS from 1993 to 1997 (< 3%) were short-term rehabilitation hospitals, which might have contributed to higher estimates of non-unions during these years than those in later years. Nevertheless, there was still a substantial drop in non-unions (by 18%) from 1998 to 2012, and even more so if age-adjusted rates were used (33%). It should be mentioned that we have accommodated the redesign of NIS in 2012 by using specific trend weights for all the previous years of the NIS.
In the context of declining trends, there was a gradual increase in non-unions between 2001 and 2004, which coincided with the prevalence of prescriptions for COX-2 selective inhibitors during the same time period. Our data also documented a clear drop in non-unions immediately after the removal of certain COX-2 selective inhibitors from the market in 2004. It is interesting to note that the strength of correlation was much higher at the downward phase than at the upward phase, due to the fact that prescription uptake is generally gradual as a medication is introduced, whereas prescriptions drop sharply when a drug is withdrawn. Similarly, we also observed a drop in non-unions from 2011 to 2010 that related to a similar change in NSAID prescriptions in patients with bone fractures. These data provide additional population-level evidence that NSAIDs, not just COX-2 selective inhibitors, may impede fracture healing (CitationAspenberg 2005). We also noted divergent shifts in prevalence of risk factors such as smoking and diabetes that may be important for non-union outcomes.
Our study remains limited by the use of administrative ICD-9 codes to determine our primary outcomes, which represent a complicated clinical process. We also acknowledge that the correlation between NSAID use and non-unions may not necessarily mean causation. Finally, our capture of NSAID use in the MEPS excluded over-the-counter sales, through which some NSAIDs are obtained, so we were only able to study the trends in prescribed medications.
In summary, we observed a secular trend of a general decline in non-unions in the last twenty years or so, and there were significant changes in these complications that could be related to sustained increase in prescriptions of COX-2 selective inhibitors and transient decrease in prescriptions of these and other NSAIDs in patients with bone fractures.
Supplementary data
Figure 5 is available at Acta’s website (www.actaorthop.org), identification number 5993.
IORT_A_1028860_SM1620.pdf
Download PDF (89.4 KB)ZW and TB designed the study. ZW analyzed the data. ZW wrote the draft, with comments from TB.
We thank Mr N. Laucis and Dr M. Ward of the clinical trials and outcomes branch of the Intramural Research Program at the National Institutes of Arthritis and Musculoskeletal and Skin Diseases, National Institutes of Health, for their comments.
ZW has no competing interests. TB has had consultancies with Maximus, PDA, and Eli Lilly, Inc. The study was supported by the Intramural Research Program at the National Institutes of Arthritis and Musculoskeletal and Skin Diseases, National Institutes of Health.
Related Research Data
- Aspenberg P. Drugs and fracture repair. Acta Orthop 2005; 76 (6): 741-8.
- Bhattacharyya T, Levin R, Vrahas MS, Solomon DH. Nonsteroidal antiinflammatory drugs and nonunion of humeral shaft fractures. Arthritis Rheum 2005; 53 (3): 364-7.
- Bhattacharyya T, Bouchard KA, Phadke A, Meigs JB, Kassarjian A, Salamipour H. The accuracy of computed tomography for the diagnosis of tibial nonunion. J Bone Joint Surg Am 2006; 88 (4): 692-7.
- Burd TA, Hughes MS, Anglen JO. Heterotopic ossification prophylaxis with indomethacin increases the risk of long-bone nonunion. J Bone Joint Surg Br 2003; 85 (5): 700-5.
- Calori GM, Albisetti W, Agus A, Iori S, Tagliabue L. Risk factors contributing to fracture non-unions. Injury 2007; 38 Suppl 2: S11-8. 312
- Cohen SB. Design strategies and innovations in the Medical Expenditure Panel Survey. Medical Care 2003; 41 (7): 5-12.
- Court-Brown CM, McQueen MM. Nonunions of the proximal humerus: their prevalence and functional outcome. J Trauma 2008; 64 (6): 1517-21.
- Dodwell ER, Latorre JG, Parisini E, Zwettler E, Chandra D, Mulpuri K, et al. NSAID exposure and risk of nonunion: a meta-analysis of case-control and cohort studies. Calcif Tissue Int 2010; 87 (3): 193-202.
- Gerstenfeld LC, Al-Ghawas M, Alkhiary YM, Cullinane DM, Krall EA, Fitch JL, et al. Selective and nonselective cyclooxygenase-2 inhibitors and experimental fracture-healing. Reversibility of effects after short-term treatment. J Bone Joint Surg Am 2007; 89 (1): 114-25.
- Hak DJ, Fitzpatrick D, Bishop JA, Marsh JL, Tilp S, Schnettler R, et al. Delayed union and nonunions: epidemiology, clinical issues, and financial aspects. Injury 2014; 45 Suppl 2: S3-7.
- Hernandez RK, Do TP, Critchlow CW, Dent RE, Jick SS. Patient-related risk factors for fracture-healing complications in the United Kingdom General Practice Research Database. Acta Orthop 2012; 83 (6): 653-60.
- Kurmis AP, Kurmis TP, O’Brien JX, Dalen T. The effect of nonsteroidal anti-inflammatory drug administration on acute phase fracture-healing: a review. J Bone Joint Surg Am 2012; 94 (9): 815-23.
- McKellop HA, Sigholm G, Redfern FC, Doyle B, Sarmiento A, Luck JVSr. The effect of simulated fracture-angulations of the tibia on cartilage pressures in the knee joint. J Bone Joint Surg Am 1991; 73 332 (9): 1382-91.
- Pountos I, Georgouli T, Blokhuis TJ, Pape HC, Giannoudis PV. Pharmacological agents and impairment of fracture healing: what is the evidence? Injury 2008; 39 (4): 384-94.
- Praemer A, Furner S, Rice DP. Musculoskeletal injuries. In: Musculoskeletal conditions in the United States. American Academy of Orthopaedic Surgeons: Park Ridge, IL 1992; 85–124.
- Sanders DW, Galpin RD, Hosseini M, MacLeod MD. Morbidity resulting from the treatment of tibial nonunion with the Ilizarov frame. Can J Surg 2002; 45 (3): 196-200.
- Simon AM, O’Connor JP. Dose and time-dependent effects of cyclooxygenase-2 inhibition on fracture-healing. J Bone Joint Surg Am 2007; 89 (3): 500-11.
- Wagner AK, Soumerai SB, Zhang F, Ross-Degnan D. Segmented regression analysis of interrupted time series studies in medication use research. J Clin Pharm Ther 2002; 27 (4): 299-309.
- Wang Z, Bhattacharyya T. Trends in incidence of subtrochanteric fragility fractures and bisphosphonate use among the US elderly, 1996-2007. J Bone Miner Res 2011; 26 (3): 553-60.
- Wolinsky PR, McCarty E, Shyr Y, Johnson K. Reamed intramedullary nailing of the femur: 551 cases. J Trauma 1999; 46 (3): 392-9.