
Abstract
Background and purpose — T1ρ or T2 relaxation imaging has been increasingly used to evaluate the cartilage of the knee. We investigated the cartilage of ACL-reconstructed knees 3 years after surgery using T2 relaxation times.
Patients and methods — 10 patients with a clinically successful unilateral ACL reconstruction were examined 3 years after surgery. Multiple-TE fast-spin echo sagittal images of both knees were acquired using a 3T MRI scanner for T2 mapping of the tibiofemoral cartilage. T2 values of the superficial and deep zones of the tibiofemoral cartilage were analyzed in sub-compartmental areas and compared between the ACL-reconstructed and uninjured contralateral knees.
Results — Higher T2 values were observed in 1 or more sub-compartmental areas of each ACL-reconstructed knee compared to the uninjured contralateral side. Most of the T2 increases were observed at the superficial zones of the cartilage, especially at the medial compartment. At the medial compartment of the ACL-reconstructed knee, the T2 values of the femoral and tibial cartilage were increased by 3–81% compared to the uninjured contralateral side, at the superficial zones of the weight-bearing areas. T2 values in the superficial zone of the central medial femoral condyle differed between the 2 groups (p = 0.002).
Interpretation — The articular cartilage of ACL-reconstructed knees, although clinically satisfactory, had higher T2 values in the superficial zone of the central medial femoral condyle than in the uninjured contralateral side 3 years after surgery. Further studies are warranted to determine whether these patients would undergo cartilage degeneration over time.
ACL reconstruction is widely used to restore stability of the knee after ACL injury. However, after 10–15 years of follow-up, osteoarthritis (OA) has been reported in 15–85% of patients (CitationAjuied et al. 2013, CitationChalmers et al. 2014). Radiographic features of OA appear only after substantial deterioration has occurred, and several years—or even decades—probably separate the first molecular changes from overt radiographic changes. Considerable progress has been made in explaining these early molecular changes by detecting alterations in the biochemical composition of the cartilage using MRI biomarkers such as T1ρ, T2, dGEMRIC, and sodium MRI (CitationChoi and Gold 2011). These studies indicated that MR measurements of biomarkers might be an efficient tool for detection of changes in the biochemical composition of articular cartilage.
Recently, some studies have used biochemical MRI methods to investigate the matrix changes in articular cartilage following ACL reconstruction, and early changes in the biochemical composition of articular cartilage in ACL-reconstructed knees have been investigated in relation to healthy populations or uninjured contralateral knees (CitationLi et al. 2011, CitationHaughom et al. 2012, CitationHirose et al. 2013, CitationSu et al. 2013, Van CitationGinckel et al. 2013, CitationTheologis et al. 2014). As progression of cartilage degeneration can be a long-term process, data on changes in the biochemical properties of cartilage at different postoperative times and in different patient populations are necessary for quantitative evaluation of cartilage degeneration after the surgery. We therefore conducted this study to evaluate the biochemical status of articular cartilage in ACL-reconstructed knees using T2 relaxation times (T2 values) at 3-year follow-up. The uninjured, healthy contralateral knees were used as a control, to eliminate inter-subject variation. The working hypothesis was that the cartilage in ACL-reconstructed knees would have higher T2 values than cartilage in uninjured contralateral knees 3 years after surgery.
Patients and methods
Subjects
10 consecutive patients who agreed to participate in this study were prospectively enrolled and recruited at 3 years after surgery (). The inclusion criteria were an acute unilateral ACL injury but no other knee ligament injuries, no evidence of gross cartilage damage at the time of ACL injury confirmed by MRI and arthroscopy (ICRS grade 0), and no history of contralateral knee injury or pain. The contralateral knee had to be uninjured with no history of injury, no symptoms, normal findings from physical examination, and normal radiographs. None of the patients had injury to either knee after ACL reconstruction.
Table 1. Preoperative patient characteristics and postoperative clinical scores at 3-year follow-up after ACL reconstruction
ACL reconstruction
Arthroscopic ACL reconstructions were performed within 4 months of injury, by a single surgeon using a transtibial technique. Postoperatively, a simple knee brace was used for knee immobilization. Range of motion of the knee and weight-bearing exercises were begun 3–4 days after surgery, with gradual progression. Isometric knee muscle exercises were started on the day after surgery, with progression. Full weight bearing without any crutch was encouraged within the first 4 weeks. Various sporting activities were practiced step by step, and any desired sporting activities were allowed between 6 and 9 months after surgery if the patient had achieved at least 80% of the knee extension strength of the uninjured leg. 3 years after surgery, each patient underwent a clinical evaluation (using the Tegner activity level scale, the Lysholm knee scoring scale, and the knee injury and osteoarthritis outcome score (KOOS)) and an MRI scan for T2 mapping.
Imaging protocols
3 years after ACL reconstruction (range 36–39 months), all knees were scanned on a 3T MR scanner using an 8-channel transmit-and-receive knee coil (Magnetom Trio; Siemens, Malvern, PA). Each patient rested for 1 h before the MRI scan. During scanning, the patient lay supine with the knees in a fully relaxed extension position. Both knees were scanned at the same session. A multiple-TE fast-spin echo sagittal pulse sequence was used for T2 relaxometry images (repetition time: 1,700 ms; 10 echo times (10.6, 21.2, 31.8, 42.4, 53.0, 63.6, 74.2, 84.8, 95.4, and 106 ms); matrix: 384 × 384; field of view: 18 × 18 cm; slice thickness: 3.0 mm; slice gap: 0 mm; number of slices: 26–30; bandwidth: 250 Hz/pixel; and total scan time: 11 min per knee). Imaging parameters were identical for both knees.
Cartilage segmentation and quantification of T2 relaxation times
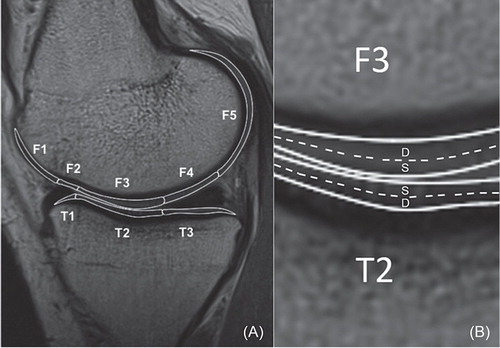
For quantification of the T2 relaxation time, the MR images were imported into the open-source DICOM viewer software (OsiriX; Pixmeo Sarl, Bernex, Switzerland). 4 compartments of articular cartilage were investigated: medial femoral condyle (FM), lateral femoral condyle (FL), medial tibial plateau (TM), and lateral tibial plateau (TL). Each compartment of the cartilage was further divided into sub-compartments (or regions of interest—ROIs) using the menisci as references (CitationLi et al. 2011). The femoral condyle cartilage was divided into 5 sub-compartments (): FM1 or FL1 = anterior to anterior meniscus horn; FM2 or FL2 = over anterior meniscus horn; FM3 or FL3 = between anterior and posterior meniscus horn; FM4 or FL4 = over posterior meniscus horn; and FM5 or FL5 = behind posterior meniscus horn. The tibial plateau was divided into 3 sub-compartments: TM1 or TL1 = under anterior meniscus horn; TM2 or TL2 = between anterior and posterior meniscus horn; and TM3 or TL3 = under posterior horn. Each ROI was manually segmented by an independent investigator. Furthermore, each ROI was evenly divided into 2 layers, superficial zone and deep zone (). The thickness of each zone was set to include at least 2 pixels. ROI analysis was performed on 3 consecutive images from the weight-bearing areas (including largest sagittal cross-sectional image) of the medial and lateral tibiofemoral joint. The average of the T2 values of the 3 consecutive images represented the T2 value of the ROI. The first echo time images in each calculation were excluded to avoid overestimation of T2 values (CitationBaum et al. 2013).
Figure 1. A. For sub-compartmental analysis, the cartilage of femur and tibia is divided into sub-compartments with regard to the anterior and posterior horns of the meniscus. The femoral condyle has 5 sub-compartments (F1, F2, F3, F4, and F5) and the tibial plateau has 3 sub-compartments (T1, T2, and T3). B. The articular cartilage is divided into the superficial zone and the deep zone. S: superficial zone; D: deep zone.
Statistics
This was a single-cohort, case series study and the data were prospectively collected. Statistical analysis was performed using SPSS statistical software version 12.0. Descriptive statistics, including the mean, standard deviation, and 95% confidence interval were calculated for T2 values of each ROI. The T2 values of both superficial-zone and deep-zone cartilage of the ACL-reconstructed knee were compared to those of the uninjured contralateral knee. Paired-samples t-test was used to compare the subgroup compartments. All tests were 2-tailed. As 15 hypotheses for the comparisons of 15 subgroup compartments were tested using a single set of data, Bonferroni correction was applied to reduce the chances of obtaining a false-positive result (type-I error). The corrected level of statistical significance was p < 0.003 (0.05/15 = 0.003) for each hypothesis.
Ethics
The study was performed in compliance with the Helsinki Declaration. It was approved by the institutional review board of the local institution (protocol no. 2013P000221/MGH), and written informed consent was obtained from each patient.
Results
Clinical results at 3-year follow-up
Demographics of the patients and clinical evaluation scores are listed in . At the time of ACL reconstruction, medial meniscus tears were found in 2 patients, lateral meniscus tears in 5 patients, and both medial and lateral meniscus tears in 1 patient. All the meniscus tears were treated with partial meniscectomy. All the patients had an uneventful recovery after ACL reconstruction. 3 years after surgery, physical examinations revealed a normal range of motion, a negative Lachman test, a negative pivot shift test, and a within 3 mm side-to-side anterior drawer test (by KT-1000 with 134 N (30 lbs) at 25° of knee flexion) in all patients. 7 patients had excellent Lysholm knee scores (> 90) and had returned to the same pre-injury level of sports activity, or 1 level lower, according to the Tegner scale (). 3 patients had a fair Lysholm knee score (65–83). There were wide variations in scores for KOOS items among the patients. 8 patients had occasional pain in their ACL-reconstructed knees after moderate recreational sports or moderate working activities.
T2 values at 3-year follow-up
All patients showed a wide range of increases in T2 values (3–81%) in 1 or more sub-compartmental areas of the tibiofemoral cartilage in the ACL-reconstructed knees when compared to the corresponding areas of the uninjured contralateral knees (Table 2, see Supplementary data; ). The changes in T2 values were mostly found at the superficial zones of the cartilage. 9 of 10 patients showed an increase in T2 values in the weight-bearing ROIs in both medial and lateral compartments of the ACL-reconstructed knees compared to the corresponding ROIs of the contralateral knees. In particular, T2 values in the superficial zone of FM3 were higher in all patients and those in the superficial zone of TM1 were higher in 7 patients. Statistically significant increases in T2 values were only found for the superficial zones of the FM3 areas of the medial compartment of the knee (p = 0.002) ( and Table 3, see Supplementary data).
Figure 2. Color-coded sagittal T2 maps in the medial compartment of the contralateral knee (A) and the ACL-reconstructed knee (B) of one patient. Note the elevated T2 values of articular cartilage in the femoral compartment of the ACL-reconstructed knee relative to the contralateral knee.
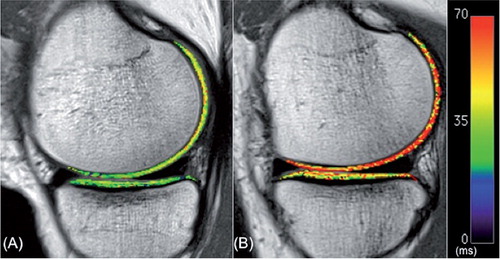
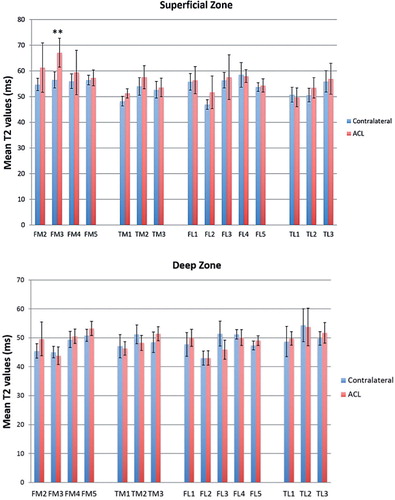
Figure 3. Mean T2 values for the superficial zone (upper panel) and the deep zone (lower panel) of the articular cartilage of ACL-reconstructed and uninjured contralateral knees (**p = 0.002) Error bars: 95% confidence intervals.
Discussion
We found heterogeneous increases in T2 values in the ACL-reconstructed knees relative to the contralateral knees at 3-year follow-up. Most patients (9 out of 10) showed increases in T2 values in the weight-bearing areas of both the medial and the lateral compartments of the ACL-reconstructed knees. The overall increases in T2 values in the ACL-reconstructed knees were evident in the superficial zone of the weight-bearing area of the medial femoral condyle (MFC).
Previous studies have found that the ACL-reconstructed knees, even though clinically successful, have increased T1ρ or T2 values at up to 2 years after ACL reconstruction (CitationLi et al. 2011, CitationHaughom et al. 2012, CitationPotter et al. 2012, CitationHirose et al. 2013, CitationLi et al. 2013, CitationSu et al. 2013, Van CitationGinckel et al. 2013, CitationTheologis et al. 2014). For example, CitationTheologis et al. (2014) found that T1ρ values of the MFC and medial tibia (MT) in ACL-reconstructed knees were elevated at 12–16 months of follow-up compared to the contralateral knees. Furthermore, a meniscal tear at the time of ACL reconstruction was found to be a risk factor for cartilage matrix degeneration on the same side. CitationHaughom et al. (2012) found that the T1ρ values of the weight-bearing areas of the medial femoral condyle cartilage were elevated in ACL-reconstructed knees at an average of 18 months of follow-up. Other studies have also compared T1ρ or T2 values of ACL-reconstructed patients to those of healthy populations and have reported changes in T1ρ or T2 values (CitationLi et al. 2011, CitationLi et al. 2013, CitationSu et al. 2013, Van CitationGinckel et al. 2013). Van CitationGinckel et al. (2013) showed that T2 values for the medial femoral cartilage of ACL-reconstructed knees were higher than those for normal controls (45 ms vs. 37 ms) at 6 months after surgery. Another study also found elevated T1ρand T2 values in ACL-injured knees, especially in the central regions of the medial femoral condyle and the posterior lateral tibial plateau at 2-year follow-up (CitationLi et al. 2011, CitationSu et al. 2013). Similarly, CitationLi et al. (2013) found that ACL-reconstructed subjects had higher T2 values in the trochlea, MFC, MT, LFC, and LT at 2-year follow-up. Our data on T2 values of the knee at 3-year follow-up showed a trend similar to those reported in these earlier studies.
A correlation has been shown between increase in T2 value and cartilage degeneration (CitationLi et al. 2007). Increased T2 values indicate disruption of the collagen matrix and higher water permeability, which may be the earliest physiological changes in cartilage degeneration (CitationLiess et al. 2002, CitationTaylor et al. 2009). However, no results have been reported on the threshold increases in T2 values that indicate cartilage degeneration (CitationJoseph et al. 2012, CitationPrasad et al. 2013). Previous studies have found that normal controls have between 3% and 12% lower T2 values than subjects with risk factors for OA and OA (CitationLi et al. 2007, CitationBaum et al. 2012, 2013). However, these data should only be used as a reference, since different MR acquisition methods and physiological variations between subjects could give different measurements of T2 values (CitationPai et al. 2008). In the present study, the increases in T2 values in the ACL-reconstructed knees compared to the contralateral knees ranged from 0% to 81%. To our knowledge, there have been no studies comparing the side-to-side differences in T2 values for the articular cartilage in subjects with healthy right and left knees. This information is important for interpretation of the changes in T2 values in patients when using the contralateral side as a reference. Further studies are needed to determine the threshold increases in T2 values that indicate development of early cartilage degeneration.
Recently, CitationSu et al. (2013) noticed different biochemical responses in the superficial and deep layers of cartilage. They reported that early degeneration was mainly in the deep layer of the posterolateral tibial cartilage (LT3) and in the superficial layer of the central cartilage of the medial femoral condyle (MFC3) by the 2-year follow-up. We found that 9 of 10 patients had an increase in T2 values in the superficial zone of central cartilage of the medial femoral condyle (MFC3) and no increase in T2 values in the corresponding area of the deep zone. This finding supports the idea that the cartilage degeneration in the medial compartment may start from the superficial layer of the articular cartilage. However, for the posterolateral tibia, our study only partially supports the idea that potential cartilage degeneration may originate from the deep layer. Only 4 patients had an increase in T2 value in the deep zone of the posterolateral cartilage relative to the contralateral knee, but no increase in the superficial zone.
Long-term clinical studies have shown that the status of the meniscus is one of the most important risk factors for development of OA after ACL reconstruction (CitationSalmon et al. 2006, CitationCohen et al. 2007, CitationIchiba and Kishimoto 2009, CitationOiestad et al. 2009, CitationAjuied et al. 2013, CitationBarenius et al. 2014). Some studies have found higher T1ρ or T2 values in ACL-reconstructed knees with a torn meniscus tear relative to the healthy knees (CitationLi et al. 2011, CitationSu et al. 2013, CitationTheologis et al. 2014). However, CitationHirose et al. (2013) reported that the T1ρ values of the MFC, MT, and LFC increased during the first year after ACL reconstruction, regardless of the presence or absence of meniscal injuries. In our study, all patients had increased T2 values in various regions of the cartilage. However, we cannot make any conclusions on the effect of meniscus tear on changes in T2 values of the cartilage, since we did not have a sufficiently large sample size to compare patients with and without meniscal tears.
High BMI with ACL injury or ACL reconstruction may accelerate cartilage degeneration when compared to normal BMI with ACL injury or ACL reconstruction (CitationCulvenor et al. 2015). 8 of 10 patients in our study were overweight or obese, which might affect knee cartilage degeneration (and also T2 value) after ACL reconstruction. However, as we compared T2 values of knee cartilage in the same patient (i.e. injured vs. uninjured, contralateral knee), we could minimize the effect of BMI as a confounding factor in the results of the present study.
This study had several limitations. Firstly, the sample size was small. We therefore obtained the clinical results and T2 values using an intra-patient control. Secondly, we had no preoperative or baseline data on the biochemical composition of the cartilage. We investigated the T2 values for articular cartilage at only 1 time point (3-year follow-up). Consequently, we cannot draw any conclusions regarding whether the status of the cartilage 3 years after ACL reconstruction reflected declining or improving results from the time of injury, or from earlier postoperative follow-up time points. Thirdly, our results should be limited to the ACL reconstruction technique that we used. There have been numerous discussions on whether anatomical reconstruction techniques will restore normal knee kinematics and prevent early degeneration of articular cartilage (CitationSalmon et al. 2006). Despite these limitations, our study found differences in T2 values between ACL-reconstructed knees and intact contralateral knees at the 3-year follow-up.
Supplementary data
Tables 2 and 3 are available at Acta’s website (www.actaorthop.org), identification number 8418.
IORT_A_1039426_SM1618.pdf
Download PDF (33.4 KB)JHB: acquisition of data, data analysis, interpretation of data, and drafting/revision of manuscript. AH: conception and design of study, data analysis, and drafting/revision of manuscript, YW: acquisition and analysis of data and revision of manuscript. MT: acquisition and analysis of data, and revision of manuscipt. AJG: manuscript revision and patient management. TJG: conception and design of study and manuscript revision. GL: conception and design of study, analysis and interpretation of data, and drafting/revision of manuscript.
This work was supported by the National Institutes of Health, USA (NIH/NIAMS grants R01 AR055612 and AR060331).
No competing interests declared.
Related Research Data
- Ajuied A, Wong F, Smith C, et al. Anterior cruciate ligament injury and radiologic progression of knee osteoarthritis: A systematic review and meta-analysis. Am J Sports Med 2013; 42: 2242–52.
- Barenius B, Ponzer S, Shalabi A, Bujak R, Norlen L, Eriksson K. Increased risk of osteoarthritis after anterior cruciate ligament reconstruction: A 14-year follow-up study of a randomized controlled trial. Am J Sports Med 2014; 42: 1049–57.
- . Baum T, Stehling C, Joseph GB, et al. Changes in knee cartilage T2 values over 24 months in subjects with and without risk factors for knee osteoarthritis and their association with focal knee lesions at baseline: data from the osteoarthritis initiative. J Magn Reson Imaging 2012; 35: 370–8.
- Baum T, Joseph GB, Karampinos DC, Jungmann PM, Link TM, Bauer JS. Cartilage and meniscal T2 relaxation time as non-invasive biomarker for knee osteoarthritis and cartilage repair procedures. Osteoarthritis Cartilage 2013; 21: 1474–84.
- . Chalmers PN, Mall NA, Moric M, et al. Does ACL reconstruction alter natural history?: A systematic literature review of long-term outcomes. J Bone Joint Surg Am 2014; 96: 292–300.
- Choi JA, Gold GE. MR imaging of articular cartilage physiology. Magn Reson Imaging Clin N Am 2011; 19: 249–82.
- Cohen M, Amaro JT, Ejnisman B, et al. Anterior cruciate ligament reconstruction after 10 to 15 years: association between meniscectomy and osteoarthrosis. Arthroscopy 2007; 23: 629–34.
- Culvenor AG, Collins NJ, Guermazi A, et al. Early knee osteoarthritis is evident one year following anterior cruciate ligament reconstruction: A magnetic resonance imaging evaluation. Arthritis Rheumatol 2015 ( E-pub ahead of print, PMID: 25692959).
- Haughom B, Schairer W, Souza RB, Carpenter D, Ma CB, Li X. Abnormal tibiofemoral kinematics following ACL reconstruction are associated with early cartilage matrix degeneration measured by MRI T1rho. Knee 2012; 19: 482–7.
- Hirose J, Nishioka H, Okamoto N, et al. Articular cartilage lesions increase early cartilage degeneration in knees treated by anterior cruciate ligament reconstruction: T1 mapping evaluation and 1-year follow-up. Am J Sports Med 2013; 41: 2353–61.
- Ichiba A, Kishimoto I. Effects of articular cartilage and meniscus injuries at the time of surgery on osteoarthritic changes after anterior cruciate ligament reconstruction in patients under 40 years old. Arch Orthop Trauma Surg 2009; 129: 409–15.
- . Joseph GB, Baum T, Alizai H, et al. Baseline mean and heterogeneity of MR cartilage T2 are associated with morphologic degeneration of cartilage, meniscus, and bone marrow over 3 years--data from the Osteoarthritis Initiative. Osteoarthritis Cartilage 2012; 20: 727–35.
- Li H, Tao H, Hua Y, Chen J, Li Y, Chen S. Quantitative magnetic resonance imaging assessment of cartilage status: a comparison between young men with and without anterior cruciate ligament reconstruction. Arthroscopy 2013; 29: 2012–9.
- . Li X, Benjamin Ma C, Link TM, et al. In vivo T(1rho) and T(2) mapping of articular cartilage in osteoarthritis of the knee using 3 T MRI. Osteoarthritis Cartilage 2007; 15: 789–97.
- Li X, Kuo D, Theologis A, et al. Cartilage in anterior cruciate ligament-reconstructed knees: MR imaging T1{rho} and T2--initial experience with 1-year follow-up. Radiology 2011; 258: 505–14.
- Liess C, Lusse S, Karger N, Heller M, Gluer CC. Detection of changes in cartilage water content using MRI T2-mapping in vivo. Osteoarthritis Cartilage 2002; 10: 907–13.
- Oiestad BE, Engebretsen L, Storheim K, Risberg MA. Knee osteoarthritis after anterior cruciate ligament injury: a systematic review. Am J Sports Med 2009; 37: 1434–43.
- Pai A, Li X, Majumdar S. A comparative study at 3 T of sequence dependence of T2 quantitation in the knee. Magn Reson Imaging 2008; 26: 1215–20.
- Potter HG, Jain SK, Ma Y, Black BR, Fung S, Lyman S. Cartilage injury after acute, isolated anterior cruciate ligament tear: immediate and longitudinal effect with clinical/MRI follow-up. Am J Sports Med 2012; 40: 276–85.
- Prasad AP, Nardo L, Schooler J, Joseph GB, Link TM. T(1)rho and T(2) relaxation times predict progression of knee osteoarthritis. Osteoarthritis Cartilage 2013; 21: 69–76.
- Salmon LJ, Russell VJ, Refshauge K, et al. Long-term outcome of endoscopic anterior cruciate ligament reconstruction with patellar tendon autograft: minimum 13-year review. Am J Sports Med 2006; 34: 721–32.
- . Su F, Hilton JF, Nardo L, et al. Cartilage morphology and T1rho and T2 quantification in ACL-reconstructed knees: a 2-year follow-up. Osteoarthritis Cartilage 2013; 21: 1058–67.
- Taylor C, Carballido-Gamio J, Majumdar S, Li X. Comparison of quantitative imaging of cartilage for osteoarthritis: T2, T1rho, dGEMRIC and contrast-enhanced computed tomography. Magn Reson Imaging 2009; 27: 779–84.
- . Theologis AA, Haughom B, et al. Comparison of T1rho relaxation times between ACL-reconstructed knees and contralateral uninjured knees. Knee Surg Sports Traumatol Arthrosc 2014; 22: 298–307.
- Van Ginckel A, Verdonk P, Victor J, Witvrouw E. Cartilage status in relation to return to sports after anterior cruciate ligament reconstruction. Am J Sports Med 2013; 41: 550–9.