
Abstract
Background and purpose — Historically, high 30-day and 1-year mortality post-amputation rates (> 30% and 50%, respectively) have been reported in patients with a transtibial or higher non-traumatic lower extremity amputation (LEA). We evaluated whether allocating experienced staff and implementing an enhanced, multidisciplinary recovery program would reduce the mortality rates. We also determined factors that influenced mortality rates. Patients and methods — 129 patients with a LEA were consecutively included over a 2-year period, and followed after admission to an acute orthopedic ward. Mortality was compared with historical and concurrent national controls in Denmark. Results — The 30-day and 1-year mortality rates were 16% and 37%, respectively, in the intervention group, as compared to 35% and 59% in the historical control group treated in the same orthopedic ward. Cox proportional harzards models adjusted for age, sex, residential and health status, the disease that caused the amputation, and the index amputation level showed that 30-day and 1-year mortality risk was reduced by 52% (HR =0.48, 95% CI: 0.25–0.91) and by 46% (HR =0.54, 95% CI: 0.35–0.86), respectively, in the intervention group. The risk of death was increased for patients living in a nursing home, for patients with a bilateral LEA, and for patients with low health status. Interpretation — With similarly frail patient groups and instituting an enhanced program for patients after LEA, the risks of death by 30 days and by 1 year after LEA were markedly reduced after allocating staff with expertise.
We previously reported 30-day and 1-year mortality rates of more than 30% and 50%, respectively, in a consecutive series of patients (assessed in 2009) with a transtibial or higher non-traumatic lower extremity amputation (LEA) (Kristensen et al. Citation2012). To our knowledge, these high mortality rates exceed those in all other reports, although short- and long-term mortality rates in general are high in this frail patient group (Johannesson et al. Citation2004, Lim et al. Citation2006, Dillingham and Pezzin Citation2008, Remes et al. Citation2008, Johannesson et al. Citation2010, Fortington et al. Citation2013, Wiessman et al. Citation2015).
We therefore implemented an enhanced, multidisciplinary treatment and rehabilitation program (Kehlet Citation2011) for patients admitted to an acute orthopedic ward who underwent a LEA due to complications from vascular disease or diabetes.
The main aim of this study was to compare the mortality data obtained in 2009 with data from a new 2-year series of consecutive patients, and to determine whether the new program would reduce the mortality rates. Secondary aims were to determine factors that influenced mortality rates in the new series of patients with LEAs and to compare the comorbidity and mortality rates in both cohorts with rates from national registry data.
Patients and methods
Patients
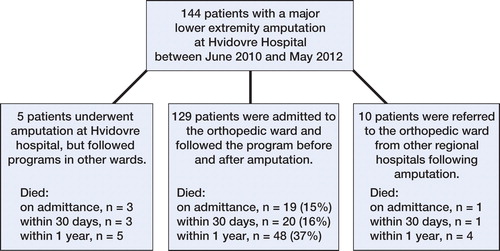
From June 1, 2010 through May 31, 2012, 144 consecutive patients who underwent a major non-traumatic LEA at Copenhagen University Hospital Hvidovre, Copenhagen, Denmark, were available for the study. We included only those patients who underwent amputation at the study hospital and who followed a pre- and postoperative program at the same orthopedic ward as the historic control group, which resulted in exclusion of 15 patients (). During the 2-year study period, the patients were treated in an amputation unit with multidisciplinary staff that had expertise concerning frail patients (Kristensen et al. Citation2010). All the patients were from the same catchment population as the previous series, and all the patients were admitted to the new amputation unit. The pre- and postoperative program included standards for fluid administration, transfusion, pain management, oxygen supplementation, early mobilization, physiotherapy, and a weekly multidisciplinary conference. No changes were made to the process of admission to the orthopedic ward during the study years, whereas none of the treatment standards instigated (except oxygen supplementation and physiotherapy to some extent) were used for the control group. The fulfillment of standards was audited by a research nurse on a monthly basis.
Figure 1. Flow chart of amputee patients at Hvidovre Hospital, from 2010 to 2012.
Treatment standards
Oral intake of fluids was supplemented with 1,000 mL standard isotonic Na-K-glucose or isotonic NaCl administered intravenously on postoperative days 1 and 2; fluid balance was measured from daily body weight, while hemoglobin and blood electrolytes were measured preoperatively and until the fourth postoperative day. Preoperative, perioperative, and postoperative transfusion with erythrocytes was given if hemoglobin levels were below 6.0 mmol/L; patients who were hypovolemic were treated with volume replacement fluid (500 mL expansion fluid). Spinal or full anesthesia was used. An ischiadicus catheter with continues infusion of 2 mg/mL Naropin at a rate of 4 mL/h with a possible “bolus” of 5 mL and 30 min lockout time was placed during amputation, to provide extended analgesia for the first 4 postoperative days. Additional postoperative analgesia consisted of paracetamol (4 g per day) and gabapentin (Pregabalin; 600–900 mg a day depending on hepatic function and/or side effects); morphine (10 mg) was used as rescue analgesia. Supplementary oxygen at 2 L/min was given during the first postoperative days, whenever the patient was supine.
The patients were mobilized out of bed as soon as possible after surgery during each 8-hour daytime shift, on the day of amputation or afterward. Physiotherapy was started on postoperative day 1 (weekends included) and continued for 2–5 days during weekdays (for most patients, on a daily basis) until discharge. The program concentrated on patients regaining their independence in basic amputee activities and improving their balance (Kristensen at al. Citation2014). The weekly multidisciplinary meeting included an amputation surgeon, nurses from the amputation unit, physiotherapists and occupational therapists from the amputation unit, and a nurse coordinator who liaised between the hospital and the community.
National registry data from Hvidovre Hospital and other hospitals in Denmark
The Charlson comorbidity index (Charlson et al. Citation1994), classified as 0, 1, 2 or 3, and the mortality in Denmark for those admitted to Danish hospitals from January 1, 2009 through December 31, 2009, and from June 1, 2010 through May 31, 2011 were collected from National Statistics Denmark. We included patients registered with 1 of the following “first amputation” surgical procedures (with NOMESCO procedure codes in brackets): transtibial (TTA) [KNGQ09, KNGQ19, KNGQ99]; and transfemoral (TFA) [KNFQ09, KNFQ19, KNFQ99]. Patients with a traumatic amputation, those without a Danish personal identification number, and those younger than 18 years of age were excluded. To identify the first TTA or TFA amputation, we defined the first amputation procedure as the index amputation. Each patient was linked to the registry by their unique personal identification number.
Study hospital variables
The primary outcome, time to death in days from the index amputation, was obtained from the Danish Civil Registration System between January 1, 2009 and May 31, 2012. Explanatory variables were: (1) age, (2) sex, (3) residential status (dichotomized as own home or nursing home), (4) pre-amputation ambulatory status (outdoor walking ability (with assistive devices allowed) vs. 24-hour wheelchair use or combined with indoor walking ability), (5) amputation related to diabetes or vascular disease (the latter included 3 amputations caused by an infection), (6) American Society of Anesthesiologists score (ASA 1–4), (7) the index amputation level (TTA, TFA, or bilateral transtibial or higher level), (8) revision or re-amputation within 30 days, and (9) the amputation level after the second operation.
Statistics
Patient characteristics from the current 2-year study (intervention group) were compared with those for a major LEA from the 2009 study (Kristensen et al. Citation2012) using chi-square tests for sex, ASA scores, residential status, cause of amputation, and index amputation level. Student’s t-test was used for age (normal distribution, as indicated by inspection of Q-Q plots, and with homogeneity of variances verified by Levene’s test (p = 0.6) for the 2 groups). Cox proportional harzards models with 95% confidence intervals (CIs), adjusted for the above-mentioned variables, were constructed to examine the relationship between the 2 groups and the 30-day and 1-year mortality post amputation. Examination of the graphs of log-minus-log against log of survival time in the Cox models showed parallel curves for the 2 groups, which indicated that the proportional hazards assumption held. Corresponding Cox models were made to examine factors associated with mortality for the intervention group. Kaplan-Meier graphs, for illustratation of the 30-day and 1-year post-amputation survival rates, were generated for the 2 groups. Corresponding graphs for the intervention group 30 days post amputation for subgroups, were derived for age groups, ASA score groups, residential status groups, and the index amputation level groups. Differences between patient characteristics and deaths in the intervention group were analyzed using chi-square tests or Fisher’s exact test (if less than 5 cases). Data are presented as mean (SD) if they were normally distributed (based on Q-Q plots), as median with (25–75% quartiles) if they were not normally distributed, or as number (percentage) if categorical. The level of significance was set at p < 0.05. SPSS version 19.0 and GraphPad software were used for the statistical analyses.
Ethics
The study was approved by the local ethics committee and registered with the regional data protection agency (entry no. 01975 HVH-2012-053). The scientific board of Statistics Denmark approved the collection of mortality data and Charlson comorbidity index data from National Statistics Denmark (project 704122).
Results
The patient characteristics in the intervention group were comparable to those in the study control group from 2009 (), and the Charlson comorbidity indices were similar to those from other hospitals in Denmark (). Compared to the control group, the 30-day and 1-year post-amputation mortality rates for the intervention group were reduced by 52% (adjusted HR =0.48, CI: 0.25–0.91) and by 46% (adjusted HR =0.54, CI: 0.35–0.86), respectively (). A Mantel-Cox log-rank test also showed differences in the 30-day and 1-year post-amputation survival distribution: x2(1) = 8.9 (p = 0.003) and x2(1) = 10 (p = 0.002), respectively. Correspondingly, the 30-day and 1-year post-amputation survival times were longer for the intervention group, with a mean of 27 (95% CI: 26–29) days as opposed to 23 (CI: 20–26) days for 30-day survival and a mean of 275 (CI: 246–295) days as opposed to 186 (95% CI: 144–229) days for 1-year survival. The reduction in mortality rates was verified with the national registry data for the study hospital and other national control groups (). Patients in the intervention group had their index amputation at a median of 2 (1–4) days after admission and they were discharged after a mean of 23 (SD 14) days after surgery, as opposed to a median of 2 (1.0–4.5) days and a mean of 28 (SD 22) days after surgery in the control group.
Figure 2. Kaplan-Meier graphs of 30-day (left panel) and 1-year (right panel) post-amputation survival of the control and intervention groups.
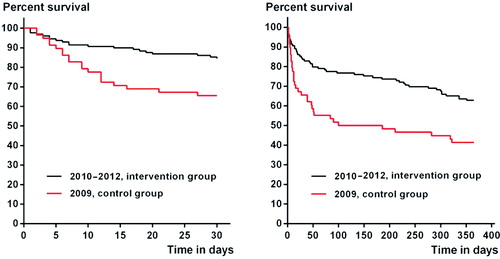
Table 1. Characteristics of control and intervention groups at Hvidovre Hospital. Values are mean (SD) for age; otherwise, number (%)
Table 2. Charlson comorbidity index from the national registry in Denmark. Values are number (%)
Table 3. Mortality at Hvidovre Hospital and other hospitals in Denmark (DK). Values are number (%)
Factors influencing mortality rates in the intervention group
19 patients (15%) died in hospital; the 30-day and 1-year post amputation mortality rates () were 16% and 37%, respectively, and were associated with age, residential status, pre-amputation ambulatory status, ASA score, and the index amputation level in univariable analysis. The 30-day post-amputation survival rates can also be seen in Kaplan-Meier survival graphs for age, residential status, ASA score, and index amputation status ().
Figure 3. Kaplan-Meier graphs of 30-day survival according to age group (panel A), residential status (B), American Society of Anesthesiologists score (C), and index amputation level (D).
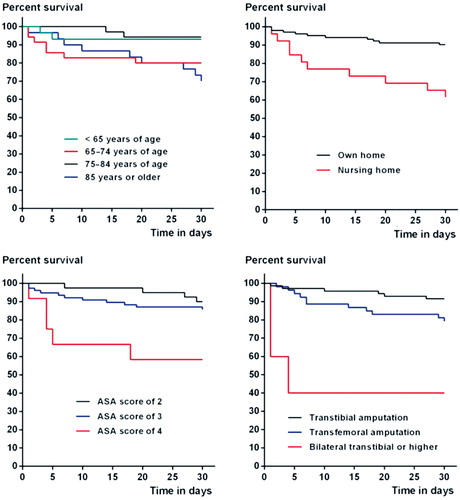
Table 4. Characteristics and mortality for the intervention group. Values are number (%)
Adjusted Cox regression analysis revealed that the 30-day post-amputation mortality in the intervention group was associated with nursing home status (HR =2.9, CI: 1.1–7.6) and an index bilateral transtibial or higher amputation status (HR =9.9, CI: 2.0–50). Correspondingly, a bilateral transtibial or higher amputation (HR =4.6, CI: 1.5–15) and an ASA score of 4 (HR =2.8, CI: 0.03–7.9) were statistically significantly associated with deaths that occurred within 1 year of the amputation.
Patients admitted from a nursing home were generally older (p ≤ 0.009) than those living in their own home (with a mean age of 81 (SD 9.2) years vs. 72 (SD 12.0) years), were more likely to use a wheelchair (69% vs. 18%), were more often amputated at a higher level (73% vs. 40%), and stayed in the ward for less time following their index amputation (median of 8 (5–19) days vs. 21 (17–27) days).
Fulfillment of standards
Audits of the treatment standards that were implemented during the 2-year period revealed that not all standards were followed. For example, the standard for fluid supplementation stated that 1,000 mL should be administered intravenously on postoperative days 1 and 2. However, in some cases fluid supplementation was only given at postoperative day 1.
Discussion
We found that it is possible to reduce mortality rates following major non-traumatic LEA by implementing an enhanced treatment and recovery program in the same acute orthopedic ward. The national registry data confirmed this reduction, although minor differences in mortality rates were seen. One explanation for this observation is that the national registry data only included patients with a “first” major amputation.
Our intervention and control groups had a national registry Charlson comorbidity index comparable to concurrent national groups, and they were approximately age-matched to a number of other amputee series (Dillingham and Pezzin Citation2008, Remes et al. Citation2008, Johannesson et al. Citation2010, Fortington et al. Citation2013). As expected, those who were 85 years of age or older in our intervention group had the highest death rate, which is consistent with the results of an earlier Dutch study (Fortington et al. Citation2013). In contrast, those in the 75- to 84-year age group survived more often than those in the older group and those aged 65–74 years in both studies. Thus, the 65- to 74-year age group appears to be a high-risk group that may require special attention in the perioperative period. Importantly, the differences in mortality rates observed among the different age groups in the intervention group might explain why age was not an independent risk factor when entered as a continuous variable in the multivariable Cox models. That is, older age is commonly associated with increased mortality rates following LEA (Pohjolainen and Alaranta Citation1998, Feinglass et al. Citation2001, Kristensen et al. Citation2012, Shah et al. Citation2013, Wiessman et al. Citation2015).
The higher mortality rates associated with lower health (high ASA scores) in the intervention group were to be expected, and this was in agreement with our previous findings (Kristensen et al. Citation2012) and with the results of studies from the UK (Campbell et al. Citation2001, Scott et al. Citation2014).
Also, the higher mortality rates observed for patients living in a nursing home were to be expected, because these patients are frail and in poor health. Also, the higher rates in patients with a bilateral transtibial (or higher) amputation following the index amputation suggest that these patients have severe illness, and therefore higher mortality rates. However, we cannot exclude the possibility that the shorter hospital stay for patients from nursing homes (compared to patients living in their own home before admission) influenced their mortality rates. Also, we did see a tendency of higher mortality rates in patients with an index TFA amputation, as reported in other studies (Pohjolainen and Alaranta Citation1998, Feinglass et al. Citation2001, Stone et al. Citation2006, Remes et al. Citation2008, Moxey et al. Citation2010, Scott et al. Citation2014,). This tendency remained for the 1-year mortality following the high number of 30-day re-amputations in the intervention group (the TTA/TFA ratio went from 1.3 to 0.80 (bilateral transtibial and higher amputations excluded)). However, a second amputation within 30 days was not associated with increased mortality rates in the intervention group; nor was a previous ipsilateral or contralateral amputation.
In summary, the increased focus on—and enhanced treatment of—the intervention group reduced mortality within the first year to the level seen concurrently in national hospitals and other comparable cohorts (Remes et al. Citation2008, Fortington et al. Citation2013). Further reduction in mortality rates in the last year of the study (with 30-day mortality of 12.7%) was seen in the intervention group. The latter mortality rate, compared to 34.5% in the historical control group, was also comparable to other cohorts with unusually low 30-day mortality rates following LEA in the UK, the USA, and Australia (Feinglass et al. Citation2001, Lim et al. Citation2006, Scott et al. Citation2014). This rate is similar to that reported for patients with hip fracture (Nordstrom et al. Citation2015). Still, the mortality rates following non-traumatic LEA and hip fracture are still considerably higher than is seen in older patients after knee replacement (Maempel et al. Citation2015).
Strengths and weaknesses
One strength of the present study was that the patient characteristics from the previous study (Kristensen et al. Citation2012) and in the current intervention cohort from the same setting were comparable. An additional strength was also that deaths were verified by the national civil registry. One weakness of our study was that we did not evaluate the influence of other factors on mortality rates in the intervention group (e.g. the cognitive status of patients (with no data available) and perioperative events). However, this was not the purpose of the present study, as these data were not included in the previous study (Kristensen et al. Citation2012) or were not available from the national registry. Another weakness was that the national registry was not searched for the comorbidity and deaths that occurred within the last year of this study. Thus, we cannot be certain that the decrease in deaths in the last intervention year was related to the enhanced treatment of patients in the study unit, or whether there were fewer deaths overall that year. Other weaknesses were the non-randomized design, that the optimized program was not followed completely for all patients, and that we were unable to identify the elements in the program that reduced mortality. It is noteworthy that these patients were treated in the same unit, which had dedicated staff with expertise in treating similar frail patients. However, a randomized design was considered unethical in view of the very high mortality rates in the previous study, and this is supported by the convincing results of the present study.
To summarize, we found that treating patients in the same acute orthopedic ward with increased attention and implementation of an enhanced multidisciplinary program markedly reduced the 30-day and 1-year post-amputation mortality rates of patients with a major non-traumatic LEA. We recommend that the program should be evaluated further to assess the influence of perioperative factors and to gain more knowledge with a view to achieving optimal treatment of these high-risk patients.
GH, MTK, and PSJ (national registry data only) collected the materials. MTK analyzed data, wrote the first draft, and handled the revisions. GH, MK, PSJ, and PG contributed to interpretation of the results and preparation of the manuscript.
We thank the staff of the multidisciplinary team for participating in this project, and for their contributions to implementation of the enhanced program for amputee patients at the orthopedic ward.
- Campbell W B, Marriott S, Eve R, Mapson E, Sexton S, Thompson J F. Factors influencing the early outcome of major lower limb amputation for vascular disease. Ann R Coll Surg Engl 2001; 83(5): 309–14.
- Charlson M, Szatrowski T P, Peterson J, Gold J. Validation of a combined comorbidity index. J Clin Epidemiol 1994; 47(11): 1245–51.
- Dillingham T R, Pezzin L E. Rehabilitation setting and associated mortality and medical stability among persons with amputations. Arch Phys Med Rehabil 2008; 89(6): 1038–1045.
- Feinglass J, Pearce W H, Martin G J, Gibbs J, Cowper D, Sorensen M, Henderson W G, Daley J, Khuri S. Postoperative and late survival outcomes after major amputation: findings from the Department of Veterans Affairs National Surgical Quality Improvement Program. Surgery 2001; 130(1): 21–9.
- Fortington L V, Geertzen J H, van Netten J J, Postema K, Rommers G M, Dijkstra P U. Short and long term mortality rates after a lower limb amputation. Eur J Vasc Endovasc Surg 2013; 46(1): 124–31.
- Johannesson A, Larsson G U, Oberg T. From major amputation to prosthetic outcome: a prospective study of 190 patients in a defined population. Prosthet Orthot Int 2004; 28(1): 9–21.
- Johannesson A, Larsson G U, Ramstrand N, Lauge-Pedersen H, Wagner P, Atroshi I. Outcomes of a standardized surgical and rehabilitation program in transtibial amputation for peripheral vascular disease: a prospective cohort study. Am J Phys Med Rehabil 2010; 89(4): 293–303.
- Kehlet H. Fast-track surgery-an update on physiological care principles to enhance recovery. Langenbecks Arch Surg 2011; 396(5): 585–90.
- Kristensen M T, Foss N B, Ekdahl C, Kehlet H. Prefracture functional level evaluated by the New Mobility Score predicts in-hospital outcome after hip fracture surgery. Acta Orthop 2010; 81(3): 296–302.
- Kristensen M T, Holm G, Kirketerp-Moller K, Krasheninnikoff M, Gebuhr P. Very low survival rates after non-traumatic lower limb amputation in a consecutive series: what to do? Interact Cardiovasc Thorac Surg 2012; 14(5): 543–7.
- Kristensen M T, Nielsen A O, Topp U M, Jakobsen B, Nielsen K J, Juul-Larsen H G, Jakobsen T L. Number of test trials needed for performance stability and interrater reliability of the one leg stand test in patients with a major non-traumatic lower limb amputation. Gait Posture 2014; 39(1): 424–9.
- Lim T S, Finlayson A, Thorpe J M, Sieunarine K, Mwipatayi B P, Brady A, Abbas M, Angel D. Outcomes of a contemporary amputation series. ANZ J Surg 2006; 76(5): 300–5.
- Maempel J F, Riddoch F, Calleja N, Brenkel I J. Longer hospital stay, more complications, and increased mortality but substantially improved function after knee replacement in older patients. Acta Orthop 2015; 86(4): 451–6.
- Moxey P W, Hofman D, Hinchliffe R J, Jones K, Thompson M M, Holt P J. Epidemiological study of lower limb amputation in England between 2003 and 2008. Br J Surg 2010; 97(9): 1348–53.
- Nordstrom P, Gustafson Y, Michaelsson K, Nordstrom A. Length of hospital stay after hip fracture and short term risk of death after discharge: a total cohort study in Sweden. BMJ 2015; 350: h696.
- Pohjolainen T, Alaranta H. Ten-year survival of Finnish lower limb amputees. Prosthet Orthot Int 1998; 22(1): 10–6.
- Remes L, Isoaho R, Vahlberg T, Hiekkanen H, Korhonen K, Viitanen M, Rautava P. Major lower extremity amputation in elderly patients with peripheral arterial disease: incidence and survival rates. Aging Clin Exp Res 2008; 20(5): 385–393.
- Scott S W, Bowrey S, Clarke D, Choke E, Bown M J, Thompson J P. Factors influencing short- and long-term mortality after lower limb amputation. Anaesthesia 2014; 69(3): 249–58.
- Shah S K, Bena J F, Allemang M T, Kelso R, Clair D G, Vargas L, Kashyap V S. Lower extremity amputations: factors associated with mortality or contralateral amputation. Vasc Endovascular Surg 2013; 47(8): 608–13.
- Stone P A, Flaherty S K, Aburahma A F, Hass S M, Jackson J M, Hayes J D, Hofeldt M J, Hager C S, Elmore M S. Factors affecting perioperative mortality and wound-related complications following major lower extremity amputations. Ann Vasc Surg 2006; 20(2): 209–16.
- Wiessman M P, Liberty I F, Segev R W, Katz T, Abu T M, Novack V. Clinical characteristics and survival of patients with diabetes mellitus following non-traumatic lower extremity amputation. Isr Med Assoc J 2015; 17(3): 145–9.