Abstract
The World Health Organization (WHO) criteria, which include percent motility and sperm concentration, are the only criteria for evaluating sperm quality and conception ability. However, these criteria are insufficient to evaluate the possibility of natural pregnancy. Thus, an index that can directly evaluate the possibility of a natural pregnancy is necessary. A new sperm energy theory without approximation was developed to assess the possibility of natural pregnancy based on mechanical sperm energy. Sperm motility parameters were measured using computer-assisted sperm analysis (CASA) in 129 ejaculated semen samples from 50 men in couples diagnosed with infertility, in which no abnormalities were found in women (sterile group), and 157 ejaculated semen samples from 57 men who had already fathered children in natural pregnancies (control group). A total of 129 subjects were selected from the control group and classified as the fertile group in order of the sample measurement date. The sperm energy index (SEI) and mean sperm energy index (MEI) were accurately obtained according to the methods described by the new sperm energy theory. SEI reflects total mechanical energy of the sperm in a visual field during CASA measurements. MEI reflects the mean mechanical energy of one sperm in a measurement field. All subjects with (MEI)/(SEI) > 2 were assigned to the sterile group. The larger the SEI, the higher was the probability of predicting fertile subjects. The probability of predicting fertile subjects was approximately 60% with a SEI of > 0.5, 70% with a SEI of > 1, 80% with a SEI of > 3, and 90% with a SEI of > 6 in cases where (MEI)/(SEI) is < 2. The data support the view that this novel method can be used to estimate the possibility of a natural pregnancy.
Introduction
The only criteria available to evaluate sperm quality and conception ability are the WHO criteria of semen analysis [Gottardo and Kliesch Citation2011], which includes percent motility and sperm concentration. However, these criteria are insufficient to evaluate the possibility of natural pregnancy. Thus, formulation of an index that can directly evaluate the possibility of pregnancy is desirable. Research on such an index has continued since an analysis of sperm curvilinear velocity and linearity in semen was reported in fertile men and patients with unexplained infertility using computer-assisted sperm analysis (CASA) [Vantman et al. Citation1989]. The sperm energy theory [Isobe Citation2008] states that the mechanical sperm energy distribution can be approximated by a Poisson distribution from which the approximate mechanical sperm energy can be obtained. Mechanical sperm energy calculated using CASA has been used to assess fertility [Isobe Citation2009]. However, the difference between the actual energy distribution and the theoretical energy distribution cannot be neglected in subjects with a low sperm count (number of motile sperm in a measurement field using CASA). This is because in the sperm energy theory the Poisson distribution is based on the assumption that the total energy quantum in a measurement field is infinite. In this study, a new sperm energy theory without approximation was developed. Mechanical sperm energy was calculated using the new theory to assess the possibility of natural pregnancy.
Results
Mechanical energy of one sperm can be expressed as K × square of the amplitude of lateral head displacement (ALH). The sperm energy index (SEI) [Isobe Citation2009], which reflects the total mechanical energy of the sperm in a CASA visual field, is defined by nKλ/102, and the mean sperm energy index (MEI) [ Isobe Citation2009], which reflects the mean mechanical energy of one sperm in a measurement field, is defined by Kλ. λ is the mean value of the square of measured ALH obtained for the total sperm count in a single field, and n is the number of measured motile sperm that could be traced completely from the start to end of the measurements in a single visual field. The Isobe coefficient (K value) is the slope of the regression line (Equation (2.9)) of a scatter diagram of Isobe plot based on the new sperm energy theory using the least squares method. In this study, SEI and MEI were obtained according to the methods described by the new sperm energy theory.
New sperm energy theory
According to the quantum theory, the energy that a material possesses is not a continuous value, but rather is given by a form in which a fundamental quantity, called an energy quantum is multiplied by a natural number. Conferring r energy quanta to a population of n sperm in a closed system may give us the energy possessed by a sperm population existing in a constant volume medium. First, if one energy quantum is placed in a closed system, the probability that any one sperm will receive that energy quantum is 1/n. If a total of r energy quanta are placed in the closed system one by one, the probability that any specific sperm will have x energy quanta in the end follows the binomial distribution given below:
Where, x! is a factorial of x.
Because there is an equal chance of this occurring for all sperms within the system, when a total of r energy quanta are placed into the system, P(x) in Equation (1.1) expresses the proportion in which sperm that have obtained x energy quanta exist. Equation (1.1) can be transformed as follows:
If Stirling's formula is used, Equation (1.2) becomes the following:
According to the sperm spring theory [Isobe Citation2007], if we consider ALH to be A for a sperm population in a closed system, the amplitude of the waveform of the sperm tail to be B, and the forward velocity to be V, then the following relational expression is formed (Isobe's Law). Here, a and b are constants.
The kinetic energy contained in a single sperm is then given by the following:
Where, m is the mass of a single sperm, and and
are constants determined by each sperm. The following relationship exists between A and B:
Because the experimental value b is very small compared with a, Equation (2.1) can be approximated as , and the kinetic energy possessed by a single sperm can be approximated with the following formula
If the energy in 1 energy quantum is taken to be E0, the following relational expression holds for sperm with x energy quanta that have head displacement of amplitude A. can be rewritten as k.
Replacement with (2.3) gives
(2.4)
Supposing that the sperm population in the closed system possesses a characteristic K value (Isobe coefficient), the mechanical energy of a sperm with displacement of amplitude A is expressed as .
If the head displacement for each sperm is , the total energy r × E0 for all sperm in the system is expressed by the following equation:
When the mean of is taken to be λ, the following relationship exists between the head displacement for each sperm and λ.
By substituting Equation (2.6) into Equation (2.5), the following equation is obtained.
Accordingly, the total energy for all sperm in the system is expressed as .
Substituting Equations (2.4) and (2.7) into Equation (1.3) and replacing with ,
yields the following function:
C is a constant that fulfills , x takes a natural number, whereas the value of t is a rational number. Equation (2.8) is a continuous function for the variable t, and P(t) expresses the existing probability density of sperm.
By expressing Equation (2.8) as its logarithm, the following is obtained;
The value of K can be obtained as the slope of the linear regression using the least square method plotting on the x axis and
on the y axis (Isobe plot).
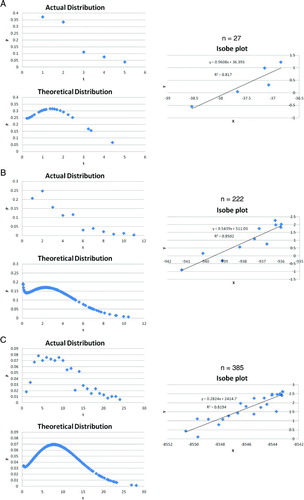
The panes of A – C show Isobe plots and scatter diagrams of an actual sperm distribution and the theoretical distribution calculated based on the new sperm energy theory for representative samples. The x and y are Isobe plot variables in the new sperm energy theory. The slope of the regression line in the Isobe plot equals the Isobe coefficient (K). The curves of the actual and theoretical distribution are plotted respectively with the actual ratio of the existing sperm number or theoretical existing probability density (P) on the vertical axis, and the square of ALH (t) on the horizontal axis. A theoretical distribution chart can be obtained using λ, n, and the Isobe coefficient.
Figure 1. Examples of the actual distribution and theoretical distribution of sperm energy. X and Y are Isobe plot variables defined from the new sperm energy theory scatter diagrams of an actual sperm distribution are compared to the theoretical distribution calculated based on the new sperm energy theory. The slope of the regression line in the Isobe plot equals the Isobe coefficient (K value). The actual and theoretical distribution curves are respectively plotted with the actual ratio of the existing sperm number, or the theoretical existing probability density (= P) on the vertical axis, and with the square of the amplitude of lateral head displacement (ALH) (=t) on the horizontal axis. A theoretical distribution chart was obtained using the Isobe coefficient. The correctness of the hypothesis (new sperm energy theory) is demonstrated by the perfect agreement between the actual and theoretical distributions.
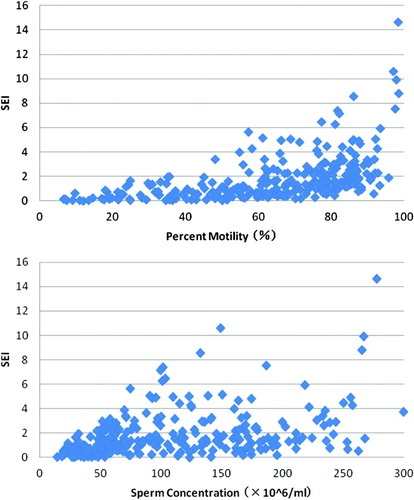
The relationships between SEI and percent motility/sperm concentration for all samples are shown in . SEI was positively correlated with both sperm concentration and percent motility.
Figure 2. Relationship between sperm concentration/percent motility and the sperm energy index calculated based on the new sperm energy theory. The mechanical energy of a single sperm can be expressed as K × the square of the amplitude of lateral head displacement (ALH). SEI and MEI are defined as below. SEI indicates the total mechanical energy of the sperm existing in a visual field of a CASA measurement, and MEI indicates the mean mechanical energy of one sperm existing in a measurement field: SEI = nKλ/100; MEI = Kλ. Where, λ is the mean value of the square of measured ALH obtained for the total sperm count in a single measurement field, and n is the number of measured motile sperm that could be traced completely from the start to end of the measurements in a single visual field. The Isobe coefficient (K value) is obtained as the slope of the regression line (Eq.(2.9)) of an Isobe plot scatter diagram based on the new sperm energy theory using the least squares method. SEI was positively correlated with both sperm concentration and percent motility.
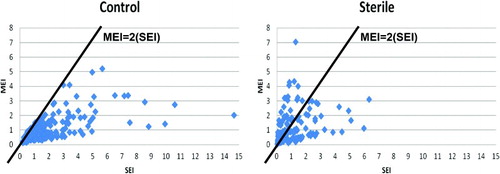
is a scatter diagram with MEI plotted on the vertical axis, and SEI on the horizontal axis for the sterile and control groups. All subjects with (MEI)/(SEI) > 2 were in the sterile group. The maximum (MEI)/(SEI) value for the control group subjects was 1.85.
Figure 3. Sperm energy index in the control and sterile groups. A scatter diagram with MEI plotted on the vertical axis and SEI on the horizontal axis in the sterile and control groups. All subjects with (MEI)/(SEI) > 2 were in the sterile group. The MEI-SEI ratio is in inverse proportion to motile sperm concentration. The ratio of subjects who fulfilled the criteria of (MEI)/(SEI) > 2 against the total number of subjects in the sterile group was 43.4% (56/129). The MEI-SEI ratio can be criteria for estimating necessity of treatment.
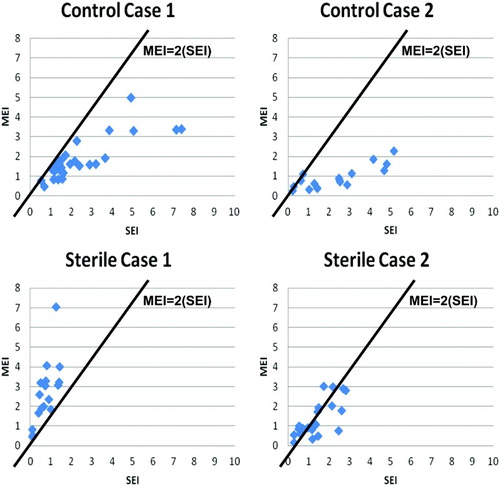
shows the scatter diagrams plotted with the SEI-MEI data of semen samples collected on different days and times from two representative subjects each from the control and sterile groups. As shown in , even within the same subject, variability in the semen parameters were observed depending on the day, but the findings did not fulfill (MEI)/(SEI) > 2 in either of the two representative cases (control cases 1 and 2) from the control group. Samples from two representative cases (sterile cases 1 and 2) in the sterile group fulfilled the criteria of (MEI)/(SEI) > 2.
Figure 4. Variability in the sperm energy index on different days and times from the same subjects. Scatter diagrams plotted with SEI/MEI data of semen samples collected on different days and times from two representative subjects each from the control and sterile groups. The findings showed that (MEI)/(SEI) >2 was not seen in either of the two representative cases (control cases 1 and 2) from the control group. Some samples obtained from two representative cases (sterile cases 1 and 2) in the sterile group fulfilled the criteria of (MEI)/(SEI) > 2.
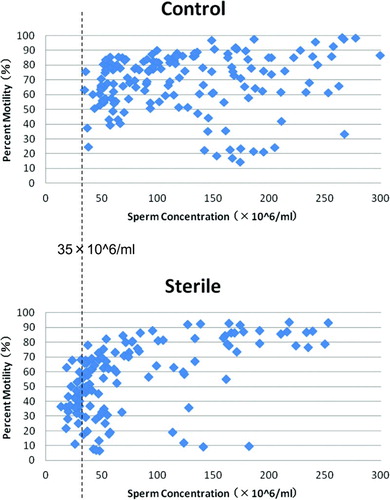
is a scatter diagram with percent motility plotted on the vertical axis and sperm concentration on the horizontal axis. The top pane is a plot of the control group, and the bottom pane is a plot of the sterile group. In this case natural pregnancy was only achieved when the sperm concentration was greater than 35 × 106/ml.
Figure 5. Percent motility and sperm concentration in the control and sterile groups. A scatter diagram with percent motility plotted on the vertical axis and sperm concentration on the horizontal axis. The top pane is a plot of the control group, and the bottom pane is a plot of the sterile group. None of the subjects produced natural pregnancy when sperm concentration was less than 35 × 106/ml. The ratio of subjects with sperm concentrations < 20 × 106 /ml against the total number of subjects in the sterile group was 3.9% (5/129). The ratio of subjects with percent motility > 50% in the fertile group against the total number of subjects in both the fertile and sterile groups was 58.29% (109/187). The ratio of subjects with sperm concentration > 20 × 106 /ml in the fertile group against the total number of subjects in both the fertile and sterile groups was 50.99% (129/253).
shows the relationship in cases where (MEI)/(SEI) was <2 between SEI and the probability of predicting fertile subjects. There was a tendency for predicting more fertile subjects with a larger SEI.
Table 1. Relationship between the SEI and the probability of predicting fertile subjects.
Discussion
The method proposed in this study has been found to be valuable to predict the possibility of a natural pregnancy. and indicate that a natural pregnancy cannot be anticipated if (MEI)/(SEI) >2. As SEI and MEI are defined the ratio of MEI-SEI is inversely proportional to the motile sperm concentration. The ratio of subjects who fulfilled the criteria of (MEI)/(SEI) >2 compared to the total number of subjects in the sterile group was 43.4% (56/129). Larger SEIs indicated higher natural pregnancy rates () in cases where (MEI)/(SEI) was < 2. The probability of predicting fertile subjects was approximately 60% with a SEI of > 0.5, 70% with a SEI of >1, 80% with a SEI of > 3, and 90% with a SEI of > 6. Therefore, the MEI-SEI ratio was useful for estimating treatment necessity. Furthermore, SEI can be used as an index to anticipate natural pregnancy in cases where (MEI)/(SEI) is < 2. The MEI-SEI ratio used as a cut-off value and the probability of predicting fertile subjects using the SEI may be revised later with changes in the sampling method or in future larger-scale studies.
The ratio of subjects with sperm concentration less than 20 × 106/ml compared to the total number of subjects in the sterile group was 3.9% (5/129). The ratio of subjects with percent motility > 50% in the fertile group compared to the total number of subjects in both the fertile and sterile groups was 58.29% (109/187). The ratio of subjects with a sperm concentration >20 × 106/ml in the fertile group compared to the total number of subjects in both the fertile and sterile groups was 50.99% (129/253).
All 5 subjects with sperm concentrations less than 20 × 106/ml fulfilled the criteria of (MEI)/(SEI) > 2. In contrast, five of 56 subjects with (MEI)/(SEI) > 2 had sperm concentrations less than 20 × 106/ml. The ratios for detecting infertile samples were significantly different between the WHO concentration/motility criteria and the new method (z = 1.995 > 1.96). The sample population detected by the WHO concentration/motility criteria included the sample population detected by the new sperm energy method. The probability of predicting fertile subjects was higher with a SEI of > 0.4 than with a percent motility of > 50%. It was higher with a SEI of > 0.05 than with a sperm concentration > 20 × 106/ml when the ratio of subjects in the fertile group against the total number of subjects in both the fertile and sterile groups was compared. Therefore, the Bell-net method described in this manuscript is more sensitive for detecting infertile subjects, and is more sensitive for predicting fertile subjects than the WHO concentration/motility criteria of semen analysis with a SEI of > 0.05. The Bell-net method affords a useful novel approach for estimating the possibility of a natural pregnancy.
As shown in Figure1, there is significant statistical agreement between the actual and theoretical distributions described by the new sperm energy theory. The standard error (SE) between the actual ratio of the existing sperm number and the theoretical existing probability density was obtained. The SEs in Figure1A - C was 0.051, 0.034, and 0.011, respectively. The mechanical sperm energy values obtained by the new sperm energy theory were accurate. A sperm motion law predicted from the sperm spring theory [Isobe Citation2007] is described by the following:
Where, V is VCL, A is ALH, f is BCF, and a, b, c are constants unique to each semen sample. The first sperm motion law formula described specifically for each semen sample is the sperm equation. According to the sperm equation, VCL increases with ALH. Because sperm energy is proportional to the square of ALH, SEI becomes larger as VCL increases. Reports [Fetterolf and Rogers Citation1990; King et al. Citation2000; Kathiravan et al. Citation2007] that fertilization capability increases as VCL or percent motility become larger are supported by the results shown in and above. Just before fertilization sperm become hyperactivated vigorously moving as if jumping [Yanagimachi Citation1970; Burkman Citation1984]. Hyperactivation involves major bending of the midpiece and large amplitude of head movement. Hyperactivation has also been observed using CASA [Ishijima et al. Citation2002, Hoshi et al. Citation1988]. ALH and VCL are high and LIN is low in hyperactivated sperm during CASA measurements [Cancel et al. 2000; Schmidt and Kamp Citation2004]. According to the sperm curvature theory [Isobe and Matsuura Citation2008], the following relationship holds between VCL and LIN, and there is a tendency for VCL to become larger as LIN gets smaller:
Where, V is VCL, L is LIN, and k is a constant. This demonstrates a phenomenon in which high ALH, high VCL, and low LIN imply a high energy state. Accordingly, hyperactivation can be explained as simply a high energy state.
Sperm that are capacitated have acquired fertilizing capacity [Austin Citation1951; Chang Citation1951] and can undergo the acrosome reaction [Dan Citation1952] and penetrate the zona pellucida of the oocyte. By applying the Bell-net method to experimental data and considering capacitation, we look forward to another means of assessing of the possibility of natural pregnancy. There are some reports that the artificial neural network (ANN) system is efficient for predicting in vitro fertilization (IVF) outcome [Siristatidis et al. Citation2011; Uyar et al. Citation2009; Kaufmann et al. Citation1997]. Combining the Bell-net method to an ova/sperm mixture and the ANN system may help predict the outcome of IVF more accurately.
Subjects and Methods
Sperm motility parameters were measured using CASA in 129 ejaculated semen samples from 50 men in couples diagnosed with infertility, in which no abnormal findings were present in screening tests for the woman (sterile group), and 157 ejaculated semen samples from 57 men who had already fathered children in natural pregnancies (control group). A total of 129 subjects were selected from the control group and classified as the fertile group in order of the sample measurement date. The screening tests for women were measurements of baseline values of hormones (FSH, LH, E2, P, PRL) on days (d) 5–7 of the menstrual cycle, hysterosalpingography, measurements of hormone (E2, P) values in the mid luteal phase, and ultrasonography diagnosis of the uterus and adnexa. A couple who has not been pregnant in spite of more than 2 years of unprotected intercourse was considered infertile. The patient samples used in this study were obtained with informed consent, and the procedures were approved by the local institutional review board.
The abstinence period before sperm collection was generally put at 3 d. One drop (5 µl) of freshly ejaculated semen was placed in a Makler chamber immediately after liquidation [Makler Citation1980] without any treatment. Sperm motility parameters were measured using CASA. The reason a Makler chamber was used in this experiments is that sperm motility parameters obtained in CASA are reported [Isobe Citation2009] to be most accurate in a Makler chamber, based on the results of measurements using a Makler chamber (depth 10 µm) and three kinds of disposable chamber with different depths (12 µm, 20 µm, 100 µm). The CASA used in this experiment was a Sperm Motility Analysis System (SMAS; DITECT Co., Tokyo, Japan). Parameters that can be measured by SMAS are straight-line velocity (VSL, μm/s), curvilinear velocity (VCL, μm/s), amplitude of lateral head displacement (ALH, μm), beat-cross frequency (BCF, Hz), and linearity (LIN). Continuous measurements of 5 visual fields are possible and the raw data for individual sperm can be processed using Excel (Microsoft, USA) by SMAS. Continuous measurements of 5 visual fields were used to get an actual sperm existing distribution curve that was as accurate as possible. In addition, 5 visual fields were chosen so as to lessen human errors in measurements. Four edges of the grid and the center of the grid were chosen as measurements fields. In the case of measurements at the edges, measurement was done including one scale of the grid (length: 10 µm) in a visual field. The SEI was calculated using EXEL data.
A regression line was calculated using the least square method, and a correlation coefficient was determined. The actual and theoretical distribution curves plotted were compared using the standard error. A simple integer nearest to the actual maximum value was selected as the cut-off value to estimate the possibility of a natural pregnancy. This was because the cut-off values obtained in this study were provisional and to be modified by large-scale studies in the future. The effective ratio for detecting infertile subjects was compared between the new method and the WHO concentration/motility criteria using the ratio test (z-test). The probability of predicting fertile subjects in the fertile group was calculated using the SEI.
Declaration of interest: The author reports no declarations of interest.
Abbreviations
| CASA: | = | computer-assisted sperm analysis |
| VSL: | = | straight-line velocity |
| VCL: | = | curvilinear velocity |
| ALH: | = | amplitude of lateral head displacement |
| BCF: | = | beat-cross frequency |
| LIN: | = | linearity |
| SEI: | = | sperm energy index |
| MEI: | = | mean sperm energy index |
| SMAS: | = | sperm motility analysis system. |
References
- Austin, C.R. (1951) Observations on the penetration of the sperm into the mammalian egg. Aust J Sci Res Ser B 4:581–596.
- Burkman, L.J. (1984) Characterization of hyperactivated motility by human spermatozoa during capacitation: comparison of fertile and oligozoospermic sperm populations. Arch Androl 13:153–165.
- Cancel, A.M., Lobdell, D., Mendola, P. and Perreault, S.D. (2000) Objective evaluation of hyperactivated motility in rat spermatozoa using computer-assisted sperm analysis. Hum Reprod 15:1322–1328.
- Chang, M.C. (1951) Fertilizing capacity of spermatozoa deposited into fallopian tubes. Nature 168:697–698.
- Dan, J.C. (1952) Studies on the Acrosome I Reaction to egg water and other stimuli. Biol Bull 103:54–66.
- Fetterolf, P.M. and Rogers, B.J. (1990) Prediction of human sperm penetrating ability using computerized motion parameters. Mol Reprod Dev 27:326–331.
- Gottardo, F. and Kliesch, S. (2011) Semen analysis: spermiogram according to WHO 2010 criteria. Urologe 50:101–108.
- Hoshi, K., Yanagida, K., Aita, T., Yoshimatsu, N. and Sato, A. (1988) Changes in the motility pattern of human spermatozoa during in vitro incubation. Tohoku J Exp Med 154:47–56.
- Ishijima, S., Baba, S.A., Mohri, H. and Suarez, S.S. (2002) Quantitative analysis of flagellar movement in hyperactivated and acrosome-reacted golden hamster spermatozoa. Mol Reprod Deve 61:376–384.
- Isobe, T. (2007) Mathematical Analysis of Sperm Motility. Japanese J Fertil Implant 24:6–15.
- Isobe, T. (2008) Mathematical Analysis of Sperm Energy Distribution. Japanese J Fertil Implant 25:12–18.
- Isobe, T. (2009) Assessment of fertility by sperm mechanical energy using computer-assisted sperm analysis system. Reprod Med and Biol 8:25–31.
- Isobe, T. and Matsuura D. (2008) Examination of Sperm Curvature using CASA. Japanese J Fertil Implant 25:6–11.
- Kathiravan, P., Kalatharan, J., Edwin, M.J. and Veerapandian, C. (2007) Computer automated motion analysis of crossbred bull spermatozoa and its relationship with in vitro fertility in zona-free hamster oocytes. Anim Reprod Sci Epub 2007 Jan 7.
- Kaufmann, S.J., Eastaugh, J.L., Snowden, S., Smye, S.W. and Sharma, V. (1997) The application of neural networks in predicting the outcome of in-vitro fertilization. Hum Reprod 12:1454–1457.
- King, L.M., Holsberger, D.R. and Donoghue, A.M. (2000) Correlation of CASA velocity and linearity parameters with sperm mobility phenotype in turkeys. J Androl 21:65–71.
- Makler, A. (1980) The improved ten-micrometer chamber for rapid sperm count and motility evaluation. Fertil Steril 33:337–338.
- Schmidt, H. and Kamp, G. (2004) Induced hyperactivity in boar spermatozoa and its evaluation by computer-assisted sperm analysis. Reproduction 128:171–179.
- Siristatidis, C., Pouliakis, A., Chrelias, C. and Kassanos, D. (2011) Artificial intelligence in IVF: a need. Syst Biol Reprod Med 57:179–185.
- Uyar, A., Bener, A., Ciray, H. and Bahceci, M. (2009) A frequency based encoding technique for transformation of categorical variables in mixed IVF dataset. Conf Proc IEEE Eng Med Biol Soc 2009:6214–6217.
- Vantman, D., Bands, S.M., Koukoulis, G., Dennison, L. and Sherins, R.J. (1989) Assessment of sperm motion characteristics from fertile and infertile men using a fully automated computer assisted semen analyzer. Fertil Steril 51:156–161.
- Yanagimachi, R. (1970) The movement of golden hamster spermatozoa before and after capacitation. J Reprod Fertil 23:193–196.