Abstract
The objective of this study was to develop a methodology that permits the detection and separation of apoptotic cells in human testicular tissue and their subsequent cytogenetic analysis by fluorescence in situ hybridization (FISH). The sequential methodology consisted of five steps: 1) enzymatic disaggregation of testicular tissue, 2) specific staining of apoptotic cells, 3) cell sorting by flow cytometry, 4) cell fixation, and 5) FISH. Enzymatic disaggregation yielded cell counts that ranged from 1.7x10⁵ to 5x10⁶ cells, and viability values greater than 72%. The apoptotic (mean ± SD: 22% ± 5.3%) and viable (45.5% ± 7.3%) populations were identified and selected by flow cytometry and demonstrated purity values ranging between 62% and 100%. The paraformaldehyde fixation of the selected fractions resulted in cell loss values of less than 10%. The application of three treatments before FISH (membrane permeabilization, elimination of cytoplasmic components, and re-fixation of the sample) resulted in hybridization frequencies of greater than 98%. In both selected fractions, cells of all spermatogenic stages and Sertoli cells were identified. The methodology developed has enabled the preparation of a cellular suspension with optimal viability and counting, the efficient selection of the apoptotic population, and its analysis by cytogenetic techniques. The application of this methodology in testicular cells should help establish whether there is a direct relationship between chromosome anomalies and apoptosis.
Introduction
Apoptosis is a process of programmed cell death associated with normal tissue development, differentiation, and remodeling. The integrity and correct functioning of the tissues depends on a delicate balance between the apoptotic process and cell division. One of the tissues where apoptosis is particularly significant is testicular tissue. It is estimated that up to 75% of germ cells are eliminated during the spermatogenic process via apoptosis (reviewed by [Shaha et al. Citation2010]). In the immature testicle of prepubertal individuals, a massive wave of apoptosis of spermatogonium and primary spermatocytes has been described, due to the absence of adequate levels of gonadotropin (reviewed by [Shaha et al. Citation2010]). During adult life, the apoptotic process responds to hormonal changes [Sinha Hikim et al. Citation1997], to maintain the ratio between Sertoli cells and germ cells (reviewed by [Shaha et al. Citation2010]) and to activate checkpoints monitoring the correct development of spermatogenesis (reviewed by [Morelli and Cohen Citation2005]). The pachytene checkpoint prevents the progression beyond prophase until DSB repair and homolog synapsis are completed [Li et al. Citation2009]. The spindle assembly checkpoint controls the correct positioning and orientation of the chromosomes on the metaphase plate (reviewed by [Vogt et al. Citation2008]). Additionally, there has been speculation concerning a further checkpoint during spermiogenesis, induced exclusively by the lack of specific genes in the early stages (until step VII) of spermatid development [Yan Citation2009].
A range of techniques has been described that facilitate the identification of apoptotic cells [Huerta et al. Citation2007]. The initial stages can be detected by immunofluorescence with Annexin V, a molecule that specifically binds to translocated Phosphatidylserine (PS) from the inner to the outer leaflet of the plasma membrane at the beginning of the process [Schutters and Reutelingsperger Citation2010]. The combined staining by Annexin V conjugated with fluorescein (FITC) and propidium iodide enables the differentiation of apoptotic and necrotic cells (with specific labeling) from those which are viable (without labeling) [Vermes et al. Citation1995]. Apoptotic cells can also be identified with immunocytochemical techniques focused on the activity of caspases (for example, caspases 3 and 7) [Said et al. Citation2004], which are key proteins involved in cell death signaling cascades. Other techniques are designed to detect the final steps of apoptosis, when DNA fragmentation appears, such as ssDNA staining [Frankfurt et al. Citation1996] or the TUNEL assay [Gavrieli et al. Citation1992]. The latter detects exposed 3'-hydroxyl DNA ends produced by the CAD-specific DNase (caspase-activated DNase).
In infertile patients, an increased incidence of chromosome anomalies [Carrell Citation2008; Sarrate et al. Citation2010], and parallel elevated percentages of apoptosis in spermatozoa have been described [Tesarik et al. Citation1998; Carrell et al. Citation2003; Chen et al. Citation2006]. The chromosome anomalies are related to synapsis abnormalities, and recombination and segregation in germ cells [Topping et al. Citation2006]. It has been stated that these abnormalities can be recognized by meiotic checkpoints, which stop the process in order to repair the abnormality [Li et al. Citation2009] or eliminate the affected cells via apoptosis [Hunt Citation2006; Hamer et al. Citation2008]. Regardless, cells may also escape these checkpoints, leading to an increased risk of aneuploidy [Sun et al. Citation2008]. Although a large number of studies have been undertaken in this field, none have focused on evaluating whether a direct relationship exists between the presence of the apoptotic process and chromosome abnormalities.
In somatic cells, a negative effect of aneuploidy over cell proliferation has been observed [Hernando Citation2008]. Aneuploidy produces alterations in gene expression triggering cell removal through apoptosis [Fang and Zhang Citation2011]. However, clear differences are observed depending on the chromosome and the cell type involved [Williams et al. Citation2008]. One example is the neural tissue characterized by a high frequency of aneuploid neuroblasts and neurons that contribute to neuronal signaling networks [Compton Citation2011].
In the germ cells, the mechanism for detecting and removing aneuploid cells has yet to be described. The development of methodologies combining the analysis of apoptosis and chromosome content in the same cells will clarify to what extent cells bearing chromosomal abnormalities retain their viability. In this paper, we present a novel sequential methodology concerning apoptotic cell detection and separation in human testicular tissue, and its further cytogenetic analysis by FISH.
Results
The enzymatic disaggregation of testicular tissue yielded cell counts between 1.7x10⁵ and 5x10⁶ cells () and showed percentages of viability greater than 72%. Microscopic evaluation of AV-FITC and PI specific labeling allowed apoptotic, necrotic, and viable populations to be identified (). The mean values (± SD) obtained were 19.4% ± 12.1% for the apoptotic population, 22% ± 17.5% for the necrotic population, and 58.4% ± 14.9% for the viable population ().
Figure 1. Types of annexin V-FITC and propidium iodide staining. Annexin V-FITC and propidium iodide staining enables the identification of apoptotic, necrotic, and viable populations. Their mechanism of action is highlighted. Scale bar represents 10 µm.
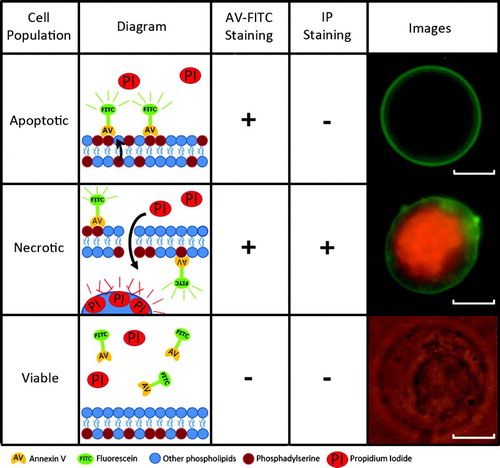
Table 1. Results from enzymatic disaggregation and specific apoptotic-/necrotic-staining observed in 13 of 17 patients with optimized protocol. (Four samples were used for the optimization.)
During definition of the sorting parameters, the wide range of cell sizes and testicular cell complexities were also considered. This required the adjustment of the forward/side scatter (FS/SS) selecting polygon (R1; A), in order to include all cell types while discarding fragments and aggregates. Moreover, it has to be taken into account that, despite the fact that the annexin V-phosphatidylserine bond is a strong calcium-dependent union, the standard sheath and sample pressure of 50 PSI weakened this bond. Hence, it was necessary to lower the pressure to 10 PSI to preserve the staining. This change in pressure caused the frequency of drop breakage to vary, and thus a bigger tip had to be used (70 µm instead of 30 µm) to ensure the presence of a single cell per drop. These conditions enabled apoptotic cell percentages (mean ± SD) of 22% ± 5.3% to be obtained (), in agreement with those previously evaluated by fluorescence microscopy (19.4% ± 12.1%). The purity of the selected fractions with the optimized protocol was verified. They ranged between 62% and 77% for the apoptotic fraction, and between 74% and 100% for the viable fraction ().The use of cytocentrifugation to spread the selected fractions, and their subsequent fixation with paraformaldehyde, resulted in cell loss values under 10%.
Figure 2. Flow cytometry separation of cells. A) Forward Scatter (FS) / Side Scatter (SS) window. Polygon R1 selects cells from the whole population in order to discard cell fragments (left) and aggregates (right). The subsequent graphs relate to polygon R1. B1) Non-stained control, whole population without labeling. B2) PI single-stained control, with the necrotic population in red and the non-stained population in blue. B3) FITC single-stained control, with the AV-FITC stained population in green and the non-stained population in blue. C) Study population (Annexin V-FITC plus propidium iodide). Apoptotic (R2 in green), viable (R3 in blue), and necrotic (R4 in red) populations are clearly identified. The selected populations correspond to the green (R2) and blue (R3) polygons in C.
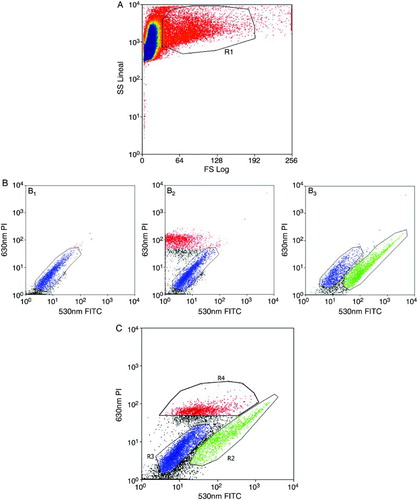
Table 2. Flow cytometry results obtained from 3 out of 14 patients with optimized parameters. (Eleven samples were used for the optimization.)
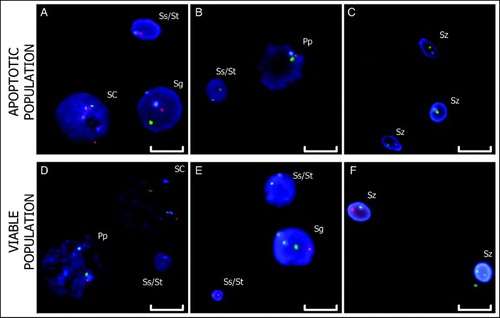
The treatments performed on the samples before FISH (membrane permeabilization, elimination of cytoplasmic components, and re-fixation of the sample) yielded hybridizations without background upon which specific signals were observed (). The hybridizations in the apoptotic fraction, and also in the viable fraction, included cells of all spermatogenic stages and Sertoli cells (), in addition to hybridization efficiencies greater than 98%.
Figure 3. Triple-color FISH. The hybridization of centromeric probes for chromosomes X (green), Y (red), and 18 (blue) to apoptotic and viable cell nuclei are shown. Images A – C are from the apoptotic fraction. Images D – F are from the viable fraction. Scale bar represents 10 µm. (SC: Sertoli Cells; Sg: Spermatogonium; Pp: Prophase; Ss: Secondary Spermatocyte; St: Spermatid; Sz: Spermatozoon).
Discussion
Accounting for the need to obtain a cell suspension with good viability and high count, we decided to use enzymatic disaggregation. This is a widely-used methodology in the disaggregation of testicular tissue, which is believed to improve the recovery of spermatozoa after testicular sperm extraction (TESE) [Crabbe et al. Citation1998; Brook et al. Citation2001]. Additionally, its efficiency in obtaining germ cells (secondary spermatocytes and spermatids), for fertility recovery through germ cell transplantation in oncological patients, has been demonstrated [Ogawa et al. Citation2000; Schlatt Citation2002]. Thus, the enzymatic method results in a higher proportion of vital cells, less debris, and fewer residual tissue pieces than in mechanical mincing methods. In this study, enzymatic disaggregation of testicular material was conducted using collagenase IA and hyaluronidase. Collagenase IA acts upon collagen type I, a principal structural component of tissues with fibrous support. Hyaluronidase deconstructs one component of the glycosaminoglycans of the extracellular matrix. In addition, other enzymes, such as DNase, and trypsin, along with EDTA helped disaggregate the tissue. This combination not only enabled the elimination of intercellular and cell-matrix bonds, but also assured a broad cell liberation (mean of 1.9x10⁶ cells) of all spermatogenic stages and Sertoli cells.
Apoptotic- and necrotic-specific staining with the annexin V/PI assay is sensitive and easy to perform [Vermes et al. Citation1995], and is also the most appropriate for identifying the three cell populations (apoptotic, necrotic, and viable) with a single staining. Moreover, it enabled the selection of apoptotic and viable fractions by flow cytometry, and the subsequent study of chromosomal anomalies without damaging the integrity of either the cell or the nucleus.
Flow cytometry is an automated and rapid technique for routine analyses [Brugnon et al. Citation2009]. However, it utilizes fluorescence intensity values on a logarithmic scale to assess staining, and scatter values to determine cell size and complexity. Thus, the cut-off point for selection had to be determined from the flow cytometry controls coupled with study sample fluorescence profiles and the percentages of each population previously ascertained by microscopy. The optimization of the variables determined the correct selection of apoptotic and viable populations. Purity evaluations of the sorted fractions validated the implemented modifications.
The percentage of apoptosis in the samples did not exceed 48%, and was frequently significantly lower. Consequently, the selected fractions had a reduced number of cells (ranging from 1.1x10⁵ to 9.3x10⁵ cells), which required a cell-fixation method that minimized cell loss. It was decided, therefore, to use paraformaldehyde as a fixative solution on slides previously extended with a cytocentrifuge. This methodology enabled the efficient fixation of small cell populations. Additionally, the use of the cytocentrifuge allowed the number of cells spread on the slides (in our samples 5x10⁴ cells in a 28 mm2 area) to be controlled. Consequently, we obtained preparations of similar quality regardless of the number of cells present in the initial population.
Paraformaldehyde fixes cells by reversible cross-linking primary amino groups in proteins with nearby nitrogen atoms of proteins or DNA, through a -CH2- linkage. The great stability of these links required the development of treatments, preceding the FISH protocol, to facilitate accessibility to the nucleus and eliminate cell remains (without these treatments the rates of hybridization do not reach the standards of our laboratory). The results obtained, in terms of signal quality and hybridization efficiency, validated the use of the sequential methodology in testicular biopsies.
The sequential methodology that was developed for obtaining optimal cell suspension, which enables the efficient flow-cytometry sorting of apoptotic and viable cells, enabling cytogenetic studies to be performed is summarized in . The methodology developed consists of five steps: 1) enzymatic disaggregation of testicular tissue, 2) specific staining of apoptotic cells, 3) cell sorting by flow cytometry, 4) cell fixation, and 5) FISH (). The application of this protocol to testicular tissue should provide new insights with respect to the correlation between chromosome anomalies, apoptosis, and the progression of human spermatogenesis.
Figure 4. Scheme of the sequential methodology. The methodology developed consists of five steps: 1) enzymatic disaggregation of testicular tissue, 2) specific staining of apoptotic cells, 3) cell sorting by flow cytometry, 4) cell fixation, and 5) FISH (PI: propidium iodide; AV-FITC: Annexin V conjugated with FITC).
Materials and Methods
Biological samples
This study was undertaken on fragments of testicular biopsies, obtained for meiotic diagnostic studies, from 17 patients with normal karyotype, who had sought consultation for fertility problems. All of the individuals presented altered seminal parameters and no remarkable diseases. Samples were obtained under local anaesthetic, according to the surgical protocol of the clinic, and were then delivered to our laboratory in phosphate-buffered saline (PBS) in crushed ice. The protocol was approved by the ethics committee of the collaborating centre, and the patients gave their informed consent with regard to participation in the study.
Enzymatic disaggregation of testicular tissue
The optimal protocol for disaggregation was based upon the methodology described by Brook et al. [2001]. In brief, testicular biopsies were cut into fragments of roughly 3 mm3 and were incubated in agitation for 30 min at 35oC with 3 ml of RPMI 1640 medium with L-glutamine (Gibco, Invitrogen; Paisley, UK) supplemented with collagenase IA (1 mg/ml; Sigma-Aldrich GmbH; Steinheim, Germany). Separation of the seminiferous tubules from adherent interstitial tissue was assisted by repeated aspiration with a Pasteur pipette. After 5 min sedimentation, the supernatant was stored at 4oC, and the sediment was incubated in agitation with 3 ml of RPMI medium supplemented with sodium pyruvate (0.2 mM; Sigma-Aldrich), EDTA (2 mM; Fluka Chemie GmbH; Switzerland), DNase I (0.4 µg/ml; Roche Diagnostics GmbH; Mannheim, Germany), hyaluronidase type IV (16 µg/ml; Sigma-Aldrich), and trypsin (6 µg/ml; Gibco) for 20 min at 35oC. The remaining lumps were again pipetted to liberate the cells from the seminiferous tubules. Enzymatic digestion was halted by adding 3 ml of RPMI medium supplemented with 10% Fetal Bovine Serum (FBS; PAA Laboratories GmbH; Pasching, Austria) and the sample was centrifuged at 500 × g for 5 min at 4oC. The pellet was resuspended with 3 ml of RPMI medium with 10% FBS, and the first disaggregation supernatant was added prior to a further centrifugation. Finally, the pellet was resuspended with 3 ml of RPMI medium with 10% FBS. Sedimentation was allowed for 5 min, before the supernatant (containing the cell suspension) was recovered. The sediment with tubule fragments was then discarded. The viability of the cell suspension was evaluated using 4% trypan blue solution (Sigma-Aldrich).
Specific staining of apoptotic cells
The specific staining of cell suspensions was performed with Annexin V (AV) conjugated with Fluorescein (FITC) and propidium iodide (PI) (Annexin-V-FLUOS Staining Kit; Roche Diagnostics GmbH). The cell suspension was divided into four fractions. Three 200 µl fractions were used to perform the flow cytometry controls (non-stained, AV-FITC single-stained, and PI single-stained). The remaining fraction (study sample) was used for the identification of apoptotic, necrotic, and viable cells and subsequent cell sorting.
The four cell suspensions were centrifuged at 500 × g for 5 min. Pellets were resuspended with PBS (Sigma-Aldrich) and incubated for a minimum of 15 min with the corresponding combinations: the study sample with AV-FITC, PI, and buffer; the non-stained control with buffer only; the AV-FITC single-stained control with AV-FITC and buffer; and the PI single-stained control with PI and buffer. Two microliters of AV-FITC and PI solutions, and 200 µl of buffer, were added per 106 cells. Five microliters of the study sample were spread on a slide for microscope evaluation of apoptotic, necrotic, and viable cells.
Evaluations were performed using an Olympus BX-60 fluorescence microscope (Olympus Barcelona; Spain) equipped with a multi-band pass filter and specific filters for FITC and Cy3. Observation of the cells by fluorescence combined with bright light enabled the identification of apoptotic (AV-FITC [+] / PI [-]), necrotic (AV-FITC [+] / PI [+]), and viable cells (AV-FITC [-] / PI [-]) (). One hundred cells from the study samples were analyzed to differentiate the three populations. The results were used to corroborate the population proportions observed with the flow cytometer.
Cell sorting by flow cytometry
The four cell suspensions were filtered using 70 µm nytral mesh (Sefar Maissa; Cardedeu, Spain) to remove aggregates before being processed by the flow cytometer. Flow cytometry experiments were carried out using a MoFlo flow cytometer (DakoCytomation; Fort Collins, Colorado, USA). Excitation of the sample was done using a Coherent Enterprise II argon-ion laser. Excitation with the blue laser line (488 nm) yielded forward scatter (FS) and side scatter (SS), the green line (530 nm) yielded fluorescence from FITC, and the red line (630 nm) yielded fluorescence from PI. Optical alignment was based on an optimized signal from 10 µm fluorescent beads (Flow-Check; Coulter Corporation; Miami, Florida, USA).
Non-stained and single-stained samples used as controls determined the position in the graph of each cell population (). A 70 µm tip and 10 PSI sheath and sample pressure, were mandatory. According to the scatter and green/red fluorescence profiles, single live cell and apoptotic cell populations were selected (). Sorted cells were relabeled with AV-FITC/PI staining and microscopically reanalyzed to check sorting purity prior to fixation.
Cell fixation
Sorted fractions were centrifuged at 500 × g for 5 min, and the pellets were incubated in hypotonic solution (KCl 0.075M; Fluka Chemie GmbH) at a cell count of 1.25x10⁵ cells/ml for 25 min at 37oC. Then 200 µl/ml of Carnoy fixative were added drop by drop in agitation. Five hundred microliters of each suspension were loaded into the funnel of the cytocentrifuge (Cytospin 3; Shandon Scientific Limited; England) with a slide annexed, and centrifuged at 200 × g for 5 min to achieve the spread. The sample slides were air-dried in a horizontal position. The samples were incubated for 10 min in 4% paraformaldehyde solution in PBS, pH 7.4 (Sigma-Aldrich). Finally, two washes were carried out with 2 × SSC (Abbott Molecular; Abbot Park, IL, USA) for 3 min, before dehydration with an ethanol series (70%, 90%, and 100%, each for 2 min).
Fluorescent in situ hybridization (FISH)
Prior to FISH, three treatments were performed: 1) membrane permeabilization of fixed cells was accomplished through 2 x SSC/0.5% triton X-100 (Sigma-Aldrich) incubation for 10 min, followed by dehydration with an ethanol series (70%, 90%, and 100%, each for 2 min); 2) elimination of cytoplasmic components was achieved by incubation with RNase I (1 µg/ml; Sigma-Aldrich) for 30 min at 37oC in a humidity chamber, and with pepsin (50 µg/ml; Sigma-Aldrich) for 5 min at 37oC; and 3) re-fixation of the sample with 1% formaldehyde solution in PBS (Sigma-Aldrich) for 2 min.
Triple-color FISH was performed using centromeric DNA probes for chromosomes X, Y, and 18 (CEP X, Spectrum Green; CEP Y, Spectrum Orange; CEP 18, Spectrum Aqua) according to the manufacturer's instructions (AneuVysion Assay Kit; Abbott Molecular). All evaluations were undertaken using an Olympus BX-60 fluorescent microscope equipped with specific filters for FITC, Cy3, and Aqua, and a multiband pass filter (DAPI/FITC/Texas Red).
If spermatozoa were observed during sample evaluation, a decondensation treatment with DTT (Roche Diagnostics GmbH) 5 mM (1 h at 37oC) was performed on another slide. The hybridization was carried out with the same probes.
The chromosomal constitution of pre- and post-reductional germ cells, Sertoli cells, meiotic figures, and spermatozoa was evaluated. FISH analysis was performed, combining the analysis of nuclear and chromosomal morphology with the evaluation of hybridization signals. Criteria used for cell identification were established according to the nuclear and chromosomal morphology described below. Interphase germ cells (pre- and post-reductional cells) were identified by their round nucleus and de-condensed chromatin. Cell size varied according to cell type. Sertoli cells exhibited a characteristic morphology, clearly distinct from interphase germ cells, characterized by a large fusiform nucleus with a prominent nucleolus and a diffuse chromatin. Meiotic figures were identified according to the characteristics of prophase I, metaphase I or metaphase II stages. Spermatozoa presented an oval nucleus, and the presence of a tail.
FISH signal evaluation of interphase germ cells, spermatozoa, and Sertoli cells, employed a strict scoring criteria for signal analysis. Signals had to be of equal size and intensity, and the distance had to be at least the same as the diameter of the signal. Overlapping nuclei were discarded from the analysis. Specifically, interphase cells (pre- and post-reductional cells) were classified according to the number of sex chromosome and chromosome 18 (ploidy control) hybridization signals. In contrast, dynamics and chromosome morphology were specifically considered in the evaluation of hybridization signals in different meiotic figures. In leptotene/zygotene staged cells, the absence of pairing was identified by the presence of independent hybridization signals. In pachytene and metaphase I cells, the presence of co-located sex chromosome-specific centromeric signals constituting the sex vesicle (pachytene) or the XY bivalent (metaphase I), and a single centromeric signal for chromosome 18 (assuming pairing), was considered to be normal in 46,XY cells. Normal metaphase II exhibited one signal for the sex chromosomes and another for chromosome 18.
Abbreviations
| AV: | = | annexin V |
| CAD: | = | caspase-activated DNase |
| DAPI: | = | 4',6-diamidino-2-phenylindole |
| DNase: | = | desoxyribonuclease |
| DTT: | = | dithiothreitol |
| EDTA: | = | ethylenediaminetetraacetic acid |
| FBS: | = | fetal bovine serum |
| FISH: | = | fluorescence in situ hybridization |
| FITC: | = | fluorescein isothiocyanate |
| FS: | = | forward scatter |
| PBS: | = | phosphate-buffered saline |
| PI: | = | propidium iodide |
| Pp: | = | prophase |
| PS: | = | phosphatidylserine |
| PSI: | = | pounds per square inch |
| RNase: | = | ribonuclease |
| RPMI: | = | Roswell Park Memorial Institute medium |
| SC: | = | Sertoli cells |
| SD: | = | standard deviation |
| Sg: | = | spermatogonium |
| Ss: | = | secondary spermatocyte |
| SS: | = | side scatter |
| SSC: | = | saline sodium citrate |
| St: | = | spermatid |
| Sz: | = | spermatozoon. |
| TESE: | = | testicular sperm extraction |
| TUNEL: | = | terminal deoxynucleotidyl transferase dUTP nick end labeling |
Acknowledgments
The authors wish to thank M. Terradas Ph.D. (Unitat d'Antropologia Biològica, Universitat Autònoma de Barcelona, Bellaterra, Spain) for her help with the Cytospin protocol, and S. Egozcue and S. Marina (Instituto de Reproducción CEFER, Barcelona, Spain) for providing the biological samples. Cell sorting experiments were conducted according to the instructions of the Unitat de Citometria de Flux (Centres Científics i Tecnològics de la Universitat de Barcelona, Barcelona, Spain). This manuscript has been proofread by Proof-Reading-Service.org.
Declaration of interest: This work was supported by Projects CF-180034 (Universitat Autònoma de Barcelona) and SGR2009-282 (Generalitat de Catalunya). LGQ is the recipient of a grant from the Universitat Autònoma de Barcelona (project CF-180034).
The authors alone are responsible for the content and writing of the paper.
Author contributions: Conceived and designed the experiments: FV,JB. Performed the experiments: LGQ,ZS. Analyzed the data: LGQ,ZS. Wrote the manuscript: LGQ,FV,JB. Final approval of the manuscript: LGQ,ZS,FV,JB.
References
- Brook, P.F., Radford, J.A., Shalet, S.M., Joyce, A.D. and Gosden, R.G. (2001) Isolation of germ cells from human testicular tissue for low temperature storage and autotransplantation. Fertil Steril 75:269–274.
- Brugnon, F., Ouchchane, L., Verheyen, G., Communal, Y., Van der Elst, J., Tournaye, H., (2009) Fluorescence microscopy and flow cytometry in measuring activated caspases in human spermatozoa. Int J Androl 32:265–273.
- Carrell, D.T. (2008) The clinical implementation of sperm chromosome aneuploidy testing: pitfalls and promises. J Androl 29:124–133.
- Carrell, D.T., Wilcox, A.L., Lowy, L., Peterson, C.M., Jones, K.P., Erickson, L., (2003) Elevated sperm chromosome aneuploidy and apoptosis in patients with unexplained recurrent pregnancy loss. Obstet Gynecol 101:1229–1235.
- Chen, Z., Hauser, R., Trbovich, A.M., Shifren, J.L., Dorer, D.J., Godfrey-Bailey, L., (2006) The relationship between human semen characteristics and sperm apoptosis: a pilot study. J Androl 27:112–120.
- Compton, D.A. (2011) Mechanisms of aneuploidy. Curr Opin Cell Biol 23:109–113.
- Crabbe, E., Verheyen, G., Silber, S., Tournaye, H., Van de Velde, H., Goossens, A., (1998) Enzymatic digestion of testicular tissue may rescue the intracytoplasmic sperm injection cycle in some patients with non-obstructive azoospermia. Hum Reprod 13:2791–2796.
- Fang, X. and Zhang, P. (2011) Aneuploidy and tumorigenesis. Semin Cell Dev Biol 22:595–601.
- Frankfurt, O.S., Robb, J.A., Sugarbaker, E.V. and Villa, L. (1996) Monoclonal antibody to single-stranded DNA is a specific and sensitive cellular marker of apoptosis. Exp Cell Res 226:387–397.
- Gavrieli, Y., Sherman, Y. and Ben-Sasson, S.A. (1992) Identification of programmed cell death in situ via specific labeling of nuclear DNA fragmentation. J Cell Biol 119:493–501.
- Hamer, G., Novak, I., Kouznetsova, A. and Hoog, C. (2008) Disruption of pairing and synapsis of chromosomes causes stage-specific apoptosis of male meiotic cells. Theriogenology 69:333–339.
- Hernando, E. (2008) Cancer. Aneuploidy advantages? Science 322:692–693.
- Huerta, S., Goulet, E.J., Huerta-Yepez, S. and Livingston, E.H. (2007) Screening and detection of apoptosis. J Surg Res 139:143–156.
- Hunt, P.A. (2006) Meiosis in mammals: recombination, non-disjunction and the environment. Biochem Soc Trans 34:574–577.
- Li, X.C., Barringer, B.C. and Barbash, D.A. (2009) The pachytene checkpoint and its relationship to evolutionary patterns of polyploidization and hybrid sterility. Heredity 102:24–30.
- Morelli, M.A. and Cohen, P.E. (2005) Not all germ cells are created equal: aspects of sexual dimorphism in mammalian meiosis. Reproduction 130:761–781.
- Ogawa, T., Dobrinski, I., Avarbock, M.R. and Brinster, R.L. (2000) Transplantation of male germ line stem cells restores fertility in infertile mice. Nat Med 6:29–34.
- Said, T.M., Paasch, U., Glander, H.J. and Agarwal, A. (2004) Role of caspases in male infertility. Hum Reprod Update 10:39–51.
- Sarrate, Z., Vidal, F. and Blanco, J. (2010) Role of sperm fluorescent in situ hybridization studies in infertile patients: indications, study approach, and clinical relevance. Fertil Steril 93:1892–1902.
- Schlatt, S. (2002) Germ cell transplantation. Mol Cell Endocrinol 186:163–167.
- Schutters, K. and Reutelingsperger, C. (2010) Phosphatidylserine targeting for diagnosis and treatment of human diseases. Apoptosis 15:1072–1082.
- Shaha, C., Tripathi, R. and Mishra, D.P. (2010) Male germ cell apoptosis: regulation and biology. Philos Trans R Soc Lond B Biol Sci 365:1501–1515.
- Sinha Hikim, A.P., Rajavashisth, T.B., Sinha Hikim, I., Lue, Y., Bonavera, J.J., Leung, A., (1997) Significance of apoptosis in the temporal and stage-specific loss of germ cells in the adult rat after gonadotropin deprivation. Biol Reprod 57:1193–1201.
- Sun, F., Mikhaail-Philips, M., Oliver-Bonet, M., Ko, E., Rademaker, A., Turek, P., (2008) Reduced meiotic recombination on the XY bivalent is correlated with an increased incidence of sex chromosome aneuploidy in men with non-obstructive azoospermia. Mol Hum Reprod 14:399–404.
- Tesarik, J., Greco, E., Cohen-Bacrie, P. and Mendoza, C. (1998) Germ cell apoptosis in men with complete and incomplete spermiogenesis failure. Mol Hum Reprod 4:757–762.
- Topping, D., Brown, P., Judis, L., Schwartz, S., Seftel, A., Thomas, A., (2006) Synaptic defects at meiosis I and non-obstructive azoospermia. Hum Reprod 21:3171–3177.
- Vermes, I., Haanen, C., Steffens-Nakken, H. and Reutelingsperger, C. (1995) A novel assay for apoptosis. Flow cytometric detection of phosphatidylserine expression on early apoptotic cells using fluorescein labelled Annexin V. J Immunol Methods 184:39–51.
- Vogt, E., Kirsch-Volders, M., Parry, J. and Eichenlaub-Ritter, U. (2008) Spindle formation, chromosome segregation and the spindle checkpoint in mammalian oocytes and susceptibility to meiotic error. Mutat Res 651:14–29.
- Williams, B.R., Prabhu, V.R., Hunter, K.E., Glazier, C.M., Whittaker, C.A., Housman, D.E., (2008) Aneuploidy affects proliferation and spontaneous immortalization in mammalian cells. Science 322:703–709.
- Yan, W. (2009) Male infertility caused by spermiogenic defects: lessons from gene knockouts. Mol Cell Endocrinol 306:24–32.