
Abstract
The multi-factorial nature of adverse reproductive effects mediated by endocrine disrupting compounds (or EDCs) makes understanding the mechanistic basis of reproductive dysfunction a highly pertinent area of research. As a consequence, a main motivator for continued research is to integrate ‘multi-leveled’ complexity (i.e., from genes to phenotype) using mathematical methods capable of encapsulating properties of physiological relevance. In this study, an in silico stoichiometric model of piscine steroidogenesis was augmented with a ‘biomass’ reaction associating the underlying stoichiometry of steroidogenesis with a reaction representative of gonad growth. The ability of the in silico model to predict perturbed steroidogenesis and subsequent effects on gonad growth was tested by exposing reproductively active male and female fathead minnows (Pimephales promelas) to 88 ng/L of the synthetic estrogen, 17α-ethynylestradiol (EE2). The in silico model was parameterized (or constrained) with experimentally quantified concentrations of selected steroid hormones (using mass spectrometry) and fold changes in gene expression (using RT-qPCR) for selected steroidogenic enzyme genes, in gonads of male and female fish. Once constrained, the optimization framework of flux balance analysis (FBA) was used to calculate an optimal flux through the biomass reaction (analogous to gonad growth) and associated steroidogenic flux distributions required to generate biomass. FBA successfully predicted effects of EE2 exposure on fathead minnow gonad growth (%gonadosomatic index or %GSI) and perturbed production of steroid hormones. Specifically, FBA accurately predicted no effects of exposure on male %GSI and a significant reduction for female %GSI. Furthermore, in silico simulations accurately identified disrupted reaction fluxes catalyzing productions of androgens (in male fish) and progestogens (in female fish), an observation which agreed with in vivo experimentation. The analyses presented is the first-ever to successfully associate underlying flux properties of the steroidogenic network with gonad growth in fish, an approach which can incorporate in silico predictions with toxicological risk assessments.
Introduction
In an era of ‘Systems Toxicology’ there is increasing requirement to integrate knowledge of perturbed molecular initiating events with adverse phenotypic and population-level outcomes [Ankley et al. Citation2010; Garcia-Reyero and Perkins Citation2011; Hartung Citation2009; Kavlock et al. Citation2008; Miracle and Ankley Citation2005; Sturla et al. Citation2014]. With such high expectations, the traditional use of apical endpoints in toxicological studies such as growth (or morphometric indices), survival, and reproduction are expected to provide limited insights into mechanisms of toxicity [Volz et al. Citation2011]. Such concern is especially warranted for the testing of endocrine disrupting compounds (or EDCs) whose multifactorial disruptions (i.e., via interactions with various receptor and enzyme systems) manifest as adverse reproductive and health effects [Guillette and Iguchi Citation2012; Sanderson Citation2006; Schug et al. Citation2011; Sonnenschein and Soto Citation1998; Tabb and Blumberg Citation2006].
In order to address this challenge, novel mathematical and computational methods have been proposed to model various biochemical and signaling systems as networks of interconnected components. Presented in this form, sophisticated clustering and multivariate statistical techniques have been used to ‘map’ differential transcriptomic, proteomic, and metabolomic changes onto generalized (or canonical) biological pathways. Such bioinformatics approaches have enabled biomarker identification, hypotheses generation, and further targeted experimentation to elucidate contaminant-induced adverse mechanisms of actions [Griffitt et al. Citation2009; Jimenez-Marin et al. Citation2009; Miller et al. Citation2012; Villeneuve et al. Citation2012; Waagmeester et al. Citation2008; Watanabe et al. Citation2011; Williams et al. Citation2011]. Within such an ‘in silico’ framework it is expected that graph-theoretic or network approaches will help anchor initiating events at the molecular level to adverse outcomes at the phenotypic and even ecosystem levels [Ankley, et al. Citation2010; Kramer et al. Citation2011; Villeneuve and Garcia-Reyero Citation2011].
Towards this end, the stoichiometric representation of metabolic systems allows for a succinct mathematical description of metabolite mass balances (i.e., consumption/production) in interconnected reaction pathways or networks. The application of optimization techniques (such as linear programming) to stoichiometric representations of metabolic networks allows computation of the greatest (or smallest) possible value of a system variable (or objective function) subject to inequality constraints [Bonarius et al. Citation1997; Savinell and Palsson Citation1992]. Specifically, the optimization technique of flux balance analysis (or FBA) has been successfully used to define optimal reaction flux distributions (i.e., metabolic pathways and associated flux values) through a biochemical network that maximize a stated objective function, such as metabolite and/or biomass production (analogous to growth) [Feist and Palsson Citation2010; Orth et al. Citation2010].
Taken together, the invariance of reaction stoichiometry can be bounded by experimentally determined inequality constraints which serve to limit allowable solutions of the system under study. As a consequence, optimal solutions are context-dependent and can represent healthy versus stressed system-states. For a metabolic system, inequality constraints can include experimentally quantified metabolite uptake/production rates, metabolite composition per unit cell/tissue mass, and/or scaling of reaction min/max flux ranges (using kinetic Vmax values or enzyme gene-expression fold changes). In particular, such constraints-based FBA has been successfully used to predict optimal metabolite productions and growth rates in wild-type or engineered microorganisms [Fong et al. Citation2005; Fong and Palsson Citation2004; Ibarra et al. Citation2002; Varma and Palsson Citation1994; Yim et al. Citation2011]. The dependence of an FBA calculated optimal solution on network stoichiometry and inequality constraints lends to toxicological assessments as contaminant-perturbed constraints, such as altered metabolite productions, tissue metabolite levels, and gene-expression changes can alter feasible and optimal solutions of the system under study. Hence, FBA can provide a unified mathematical framework to explore optimal function(s) of metabolic networks and allow computation of integrated metabolic-phenotypes (i.e., association of underlying genomic/biochemical machinery with biomass generation or growth).
In this paper, we tested the ability of constraints-based FBA to predict perturbed gonad growth (analogous to biomass production) and associated optimal steroidogenic flux distributions in sexually mature male and female fathead minnows (Pimephales promelas) exposed to the potent synthetic estrogen, 17α-ethynylestradiol (or EE2). Gonad growth was chosen as an objective function as it typified an apical endpoint commonly used in toxicological assessments and is representative of organism growth and reproductive viability. Sexually mature and reproductively active male and female fathead minnows were exposed to 100 ng/L EE2 for ten days. Although the exposure concentration selected was above levels commonly detected in the aquatic environment (i.e., up to 10 ng/L), it was within range shown to significantly impact reproduction and gonad growth in fish (∼1 to 100 ng/L) [Hoffmann et al. Citation2006; Santos et al. Citation2010; Scholz and Gutzeit Citation2000]. A previously developed stoichiometric model of piscine steroidogenesis [Hala et al. Citation2010, Citation2012] was expanded upon and augmented with a pseudo ‘biomass reaction’ detailing the concentrations of experimentally determined steroid hormone metabolites (using mass spectrometry) comprising per unit gonad weight (as fmol/mg tissue) of male and female fish. The biomass reaction was used as a qualitative indicator of gonad growth as it constrained the ‘demand’ or consumption of the selected steroid hormones present in gonad tissue to generate per unit (or milligram) biomass of the gonad tissue. In addition, a subset of steroidogenic reaction flux-constraints (as min/max bounds) were also re-constrained or scaled using experimentally quantified gene expression changes (using RT-qPCR) for the respective steroidogenic enzyme genes. FBA was used to calculate optimal flux through the biomass reaction and associated steroidogenic reactions (or flux distributions) required to generate optimal biomass. Finally, in silico predictions were compared and contrasted with in vivo experimentation to identify diagnostic biomarkers representative of contaminant insult.
Results and Discussion
In vivo effects of exposure
Water chemistry
EE2 concentration in replicate exposure aquaria was quantified using LC-ESI + MS/MS on Days 3 (96 ± 3.8 ng/L), 7 (103 ± 2.1 ng/L), and 10 (64 ± 3.8 ng/L) of exposure (mean ± standard error of mean). The mean total EE2 concentration for the entire 10 day exposure duration was 88 ± 7.8 ng/L, with EE2 not detected in solvent control tanks (0.0042% dimethylformamide (DMF)). Additionally, temperature (24 ± 0.1°C), dissolved oxygen (7.6 ± 0.2 mg/L), and pH (8.1 ± 0.1) as measured on Days 2, 4, and 9 of exposure were within expected ranges.
Effects on survival and fecundity
The 88 ng/L EE2 exposure group exhibited mortality of three female and three male fathead minnows. Mortality was split between each replicate tank with two males and one female perishing in one replicate tank, and two females and one male fish perishing in the other. No mortalities were observed in the solvent control group. EE2 caused cessation in spawning after 3 days of exposure (Supplement 1). Despite continued spawning in the solvent control group, no statistically significant differences were evident between the solvent control and 88 ng/L EE2 exposed group (two-way ANOVA, p ≥ 0.05). The cessation of spawning observed in our study agreed with adverse reproductive effects reported in other cyprinid species exposed to EE2. For example, Nash et al. [Citation2004] showed decreased fecundity in adult zebrafish (Danio rerio) exposed to 50 ng/L EE2 for up to 10 days, whereas Seki et al. [Citation2002] showed decreased reproduction for Japanese medaka (Oryzias latipes) exposed to 488 ng/L EE2 for up to 21 days.
Effects on morphometric indices
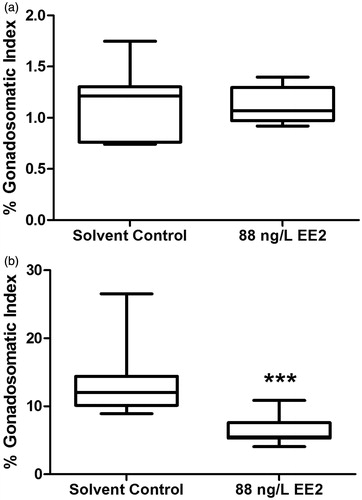
EE2 exposure caused a significant increase in the percent hepatosomatic index (%HSI) of both male (Mann Whitney test, p ≤ 0.05) and female (unpaired t-test, p ≤ 0.05) fish relative to solvent control (Supplement 2). Furthermore, EE2 exposure had no effects on male percent gonadosomatic index (%GSI) (Mann Whitney test, p ≥ 0.05), but significantly lowered female %GSI by approximately 50% relative to solvent control (Mann Whitney test, p ≤ 0.05) (). The effects on %HSI and %GSI were consistent with the etiology of EE2’s disruptive effects. Hoffmann et al. [Citation2006] have shown an almost 66% reduction in GSI for female zebrafish exposed to 98 ng/L EE2 (7 day exposure), whereas Van den Belt et al. [Citation2004] showed ∼<50% reduction in GSI for female zebrafish exposed to 8.6 ng/L EE2 (or 0.029 nM) for 3 weeks. In contrast to a reduction of %GSI (for females only), EE2 exposure significantly enhanced %HSI for both male and female fathead minnows in our study. An increase in HSI is consistent with other reported studies, as Kaptaner et al. [Citation2009] report significantly elevated HSI for male and female Lake Van fish (Chalcalburnus tarichi) exposed to 100 ng/L EE2 (32 day exposure), and Andersson [Citation2007] showed significantly elevated HSI for male three-spined sticklebacks (Gasterosteus aculeatus) exposed to 200 and 500 ng/L EE2 (21 day exposure). The increase in HSI is symptomatic of enhanced synthesis and accumulation of vitellogenin (pre-cursor to the egg yolk protein) and/or increase in liver peroxisome proliferation [Sumpter and Jobling Citation1995; Zha et al. Citation2007].
Figure 1. Effects of exposure to 88 ng/L EE2 on in vivo male (A), and female (B) percentage gonadosomatic index (%GSI). EE2: 17α-ethynylestradiol; ***significant difference at p ≤ 0.001.
Effects on steroidogenesis
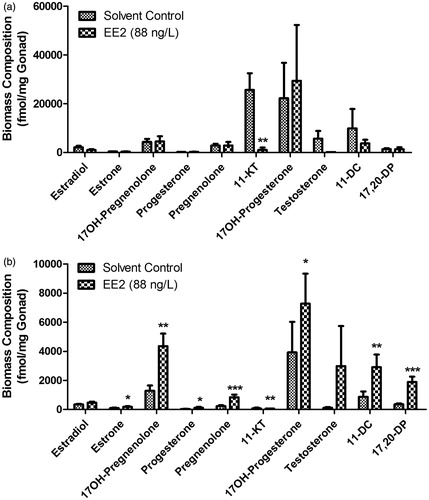
Ex vivo steroid hormone production was quantified for 2, 8, 12, and 24 hours of gonad tissue incubation with levels of hormones showing overall increases in production over time along with treatment-specific affects also being evident (Supplement 3). When represented as rate of production per hour, male fathead minnows showed a statistically significant decrease for 11-ketotestosterone (11-KT) production (Mann-Whitney test, p ≤ 0.05), whereas females showed a statistically significant increase for 17α-hydroxypregnenolone and 17α,20β-dihydroxypregnenone production (Mann-Whitney test, p ≤ 0.05) (Supplement 4). In agreement with ex vivo effects on 11-ketotestosterone in male fathead minnows, testis concentration of 11-ketotestosterone was also significantly lowered (Mann-Whitney test, p ≤ 0.05) (). Steroid hormone levels in ovaries showed significantly elevated production for all progestogens including: 17α-hydroxypregnenolone, progesterone, pregnenolone, 17α-hydroxyprogesterone, and 17α,20β-dihydroxypregnenone (Mann-Whitney test, p ≤ 0.05). Additionally, estrone, 11-ketotestosterone, and 11-deoxycortisol levels were also significantly elevated in females (Mann-Whitney test, p ≤ 0.05) (). The fmol/mg steroid hormone concentrations in gonad tissues from each male and female fish were used to construct the in silico biomass reaction which constrained steroid metabolite demand to produce per unit (mg) gonad biomass.
Figure 2. Effects of exposure to 88 ng/L EE2 on concentrations of steroid hormones in male (A) and female (B) gonad tissue. EE2: 17α-ethynylestradiol; Metabolite Key: 17OH-Pregnenolone: 17α-hydroxypregnenolone; 11-KT: 11-ketotestosterone; 17OH-Progesterone: 17α-hydroxyprogesterone; 11-DC: 11-deoxycortisol; 17,20-DP: 17α,20β-dihydroxypregnenone. *, **, *** significant differences at p < 0.05, p < 0.01, p < 0.001, respectively.
In humans, EE2 is used as a potent synthetic estrogen in oral contraceptives to inhibit gonadotropin production (specifically of follicle-stimulating hormone (FSH) [Goldzieher et al. Citation1975; Moutos et al. Citation1995]. The mechanism of such inhibition is purported to be via the activation of the estrogen receptor (ER) signaling pathways in the hypothalamus, which in turn trigger feedback-inhibition of gonadotropin release [Herbison and Pape Citation2001; Petersen et al. Citation2003; Wintermantel et al. Citation2006]. As a consequence, EE2 acts as a potent inducer of ER expression [Bhattacharya et al. Citation1997], with the propensity to bind and activate various human ER isoforms such as ERα and ERβ [Zhu et al. Citation2006]. EE2 affinity for ERs also lends to promiscuity of binding to ERs in other vertebrate species, such as rats and fish [Blair et al. Citation2000; Le Guevel and Pakdel Citation2001]. Particularly, EE2 exhibits high relative binding affinity to fathead minnow ERs (166% relative to the endogenous estrogen, 17β-estradiol) [Denny et al. Citation2005]. In our study, the binding of EE2 with ERs in hepatic tissue was indicated by the significant induction of vitellogenin (vtg) gene expression in the liver of male fish (Supplement 5). Vtg (egg yolk protein precursor) induction in male fish is a reliable biomarker of exposure to estrogenic compounds as expression of the vtg gene is under the control of ER activation by estrogens [Brian et al. Citation2007; Filby et al. Citation2007; Nagahama Citation1994; Sumpter and Jobling Citation1995].
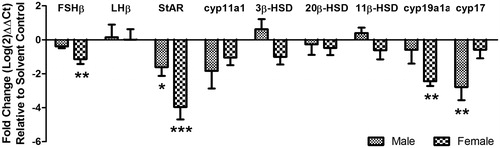
In our study, EE2 exposure was shown to lower FSHβ expression in the brain of exposed male (non-significant decrease) and female (significant decrease) fathead minnows, with no effects on luteinizing hormone (LH)β expression observed for either sex (). The specific mechanism of such inhibition cannot be hypothesized from the data presented, however direct modulation of gonadotropin releasing hormone (GnRH) neurons by ER activation may be plausible [Navas et al. Citation1995]. Furthermore, negative feedback inhibition of gonadotropin (FSH and LH) synthesis and release via activations of ERs localized on gamma-aminobutyric acid (GABA) or Kisspeptin neurons cannot be discounted. The synthesis of GABA (neurotransmitter) and Kisspeptins (neuropeptides) by specialized neurons innervating the hypothalamus are capable of stimulating FSH and LH release [Zohar et al. Citation2010]. For example, Kisspeptin receptor expression (kiss1r) has been shown to correlate with gonadotropin releasing hormone isoform (gnrh3) expression during reproductive development in both male and female fathead minnows [Filby et al. Citation2008]. The induction of kiss1r expression (by administering a mammalian analogue of kisspeptin) correlated with estrogen receptor (esr1) and androgen receptor (ar) gene expressions, strongly implicate a functional association between steroid hormone receptors and a putative modulator (kiss1r) of gonadotropin production [Filby et al. Citation2008].
Figure 3. Effects of EE2 exposure on fold changes in gene expression (relative to solvent control) for gonadotropins (FSHβ and LHβ) in the brain, cholesterol import protein (StAR) along with steroidogenic enzyme (cyp11a1, 3β-HSD, 20β-HSD, 11β-HSD, cyp19a1a, and cyp17) gene expressions in gonads of male and female fish. EE2: 17α-ethynylestradiol; *, **, *** significant differences at p ≤ 0.05, p ≤ 0.01, p ≤ 0.001, respectively.
Evidence of EE2’s propensity to inhibit gonadotropin production in fish is provided from studies with female coho salmon (Oncorhynchus kisutch) and male gilthead seabream (Sparus aurata). Harding et al. [Citation2013] performed RNA-seq analysis on pituitary glands from sub-adult female coho salmon exposed to ∼18 ng/L EE2 for 6 weeks and showed significant induction of pituitary LHβ to contrast with significant inhibition of FSHβ expression. The same study also showed induction of GnRH receptor (GNRHR1) expression after 6 weeks of exposure and identified circadian rhythm signaling (amongst other metabolic pathways) to also be affected. Harding et al. [Citation2013] proposed the possibility of perturbed circadian signaling to disrupt GnRH activity and in turn differentially modulate gonadotropin productions. Cabas et al. [Citation2013] showed transient effects of dietary EE2 exposure (5 µg EE2/gram diet) in maturing male gilthead seabream (Sparus aurata) dosed for 7 and 28 days respectively. The authors showed significantly suppressed LH receptor expressions in gonad tissue of mature (or spermatogenic) males after 7 days of dosing, and significantly increased FSH receptor expression after 28 days of dosing [Cabas et al. Citation2013].
In synchronous or seasonal spawning fish (such as salmonids), surges of gonadotropin levels drive distinctive phases of reproductive development and maturation. For example, gamete development or proliferation is under the control of FSH surge and concomitant production of androgen (testosterone and 11-ketotestosterone) and estrogen (17β-estradiol and estrone) steroid hormones; whereas the shorter period of gamete final maturation (prior to spawning) is characterized by elevated LH levels and associated increase in production of progestogens (such as the maturation inducing hormone (MIH), 17α,20β-dihydroxypregnenone) [Estay et al. Citation2012; Kime Citation1993; Omura and Morohashi Citation1995; Sampath Kumar et al. Citation2000; Yaron and Levavi-Sivan Citation2011]. Such distinctive surges of gonadotropin and accompanying steroid hormone productions are not clearly distinguishable in asynchronous (or fractional) spawning fish, such as fathead minnows. In male fathead minnows, Villeneuve et al. [Citation2007] have shown significantly decreased pituitary FSHβ levels to be contrasted with increasing LHβ expression with advancing stages of gonad development (although LHβ increase was not statistically significant). In the same study, no clear cycling was discernable for FSHβ and LHβ expression during ovarian development in female fathead minnows [Villeneuve et al. Citation2007]. In addition, any cycling of FSHβ and LHβ was also not evident in pre-spawn versus post-spawn male and female fish, although significantly elevated LHβ expression was evident in female fathead minnows relative to males during the pre-spawn phase [Villeneuve et al. Citation2007]. Despite the lack of distinctive cycling for gonadotropins in reproductively active fathead minnows, clear correlation of changing GSI with plasma levels of 17β-estradiol has been demonstrated for female fathead minnows with days post spawn [Jensen et al. Citation2001].
EE2 is also capable of perturbing steroidogenic enzyme gene expression, for example Cabas et al. [Citation2013] showed significantly decreased expression for StAR, cyp11a1, and 3β-HSD; juxtaposed with significantly increased expression for cyp19a1a and 11β-HSD in mature male gilthead seabream (Sparus aurata) dosed with 5 µg/gram EE2 (via diet) for 7 and 28 days. Whereas Filby et al. [Citation2007] showed a significant down-regulation of StAR, cyp17, 11β-HSD, and 17β-HSD; along with increased cyp19a1a expression in male fathead minnows exposed to 10 ng/L EE2 for 21 days. In the same study, Filby et al. [Citation2007] also showed an increase in expression of cyp17 and 17β-HSD; contrasted with decreased expression of 11β-HSD (and no change in expression for StAR and cyp19a1a) for female fathead minnows. In contrast, our study showed consistent down-regulation in male and female fathead minnows for StAR (significant for both sexes), cyp11a1 (non-significant for both sexes), cyp19a1a (significant only for females), and cyp17 (significant only for males) (). A marginal (and non-significant) down-regulation was also seen for 20β-HSD in both male and female fish. Furthermore, possible sex-specific effects were also evident with increased (non-significant) expression of 3β-HSD and 11β-HSD in male fish, contrasted to decreased expression in females (also non-significant) ().
Mechanistically, it would appear intuitive to associate the observed changes in steroidogenic enzyme gene expression with down-regulation of FSHβ observed for both male and female fathead minnows (significant only for females). Gonadotropins are capable of activating adenylate cyclase (cAMP) pathways which phosphorylate and activate (via PKA/PKC signaling) various transcription factors (TFs) such as SF-1 and CBP/p300 complexes. In turn, activated TFs differentially regulate gene expression of various steroidogenic enzymes. Using such signal transduction cascades, FSH is expected to regulate StAR, cyp11a1, cyp17, and cyp19a1a expressions; whereas LH is postulated to regulate 20β-HSD expression [King and LaVoie Citation2012; Senthilkumaran et al. Citation2004; Sewer and Waterman Citation2001]. Another key mediator of steroid hormone production is the dual activity of cyp17 enzymes. For example, cAMP-dependent phosphorylation of serine/threonine residues on cyp17 promotes 17,20-lyase activity, which enhances the catalysis of progestogens to androgens via cleavage of c-17 and c-20 bonds on progestogens (i.e., 17α-hydroxypregnenolone → dehydroepiandrosterone (V46); and 17α-hydroxyprogesterone → androstenedione (V48)). Whereas, dephosphorylated cyp17 promotes 17α-hydroxylase activity to produce (via 17α-hydroxylation) precursor progestogens required for catalysis of maturation inducing hormones, such as 17α,20β-dihydroxypregnenone (i.e., progesterone → 17α-hydroxyprogesterone (V9)).
In our study, perturbed steroidogenic enzyme gene expression and subsequent effects on steroid hormone production (in gonad tissue and ex vivo produced hormones) lends credence to down-regulation of FSHβ as being a key causative factor. Specifically, the association of down-regulated FSHβ corresponding with the down-regulation of StAR, cyp11a1, and cyp19a1a supports the expectation that FSH is a key regulator of these genes. We can also postulate that suppression of FSH mediated cAMP signaling may account for the significantly lowered cyp17 expression and 17,20-lyase activity in male fathead minnows. Such suppression may also explain the lowered androgen production (testosterone and 11-ketotestosterone) evident for male fish. For females, a non-significant lowering of cyp17 activity may cause suppression of 17,20-lyase activity but leave 17α-hydroxylase activity un-modified (or even enhanced) as evidenced from significantly elevated progestogen production, especially as seen for elevated 17α-hydroxyprogesterone production in ovarian tissue. Additionally, the marginal (and non-significant) down-regulation of 20β-HSD observed for female fathead minnows was not sufficient to lower production of the maturation inducing hormone, 17α,20β-dihydroxypregnenone, whose levels were significantly elevated in gonad tissue and released ex vivo.
In summary, it may be postulated that down-regulation of FSHβ expression (under EE2 exposure) led to perturbed activation of steroidogenic enzyme gene expression. The overall, down-regulation of key steroidogenic enzyme genes disrupted androgen, progestogen, and corticoid production in male (11-ketotestosterone) and female (estrone, 17α-hydroxypregnenolone, progesterone, pregnenolone, 11-ketotestosterone, 17α-hydroxyprogesterone, 11-deoxycortisol, and 17α,20β-dihydroxypregnenone) gonad tissue of EE2 exposed fish. It is likely that disruptions of steroid hormone synthesis were contributing factors for the observed reproductive dysfunction of cessation in spawning. Based on our results, it would appear that steroid hormone production in female fish was more highly dysregulated, implicating effects on reproduction as being mediated mainly through females.
In silico predictions
FBA prediction of perturbed gonad growth
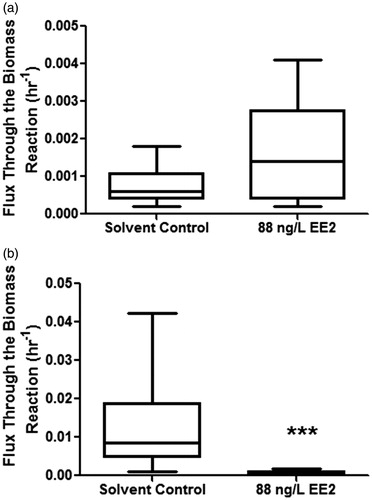
The biomass reaction acted as a qualitative indicator of steroid hormone contribution to gonad growth. In turn, simulation of optimal flux through the biomass reaction gave a representative measure of tissue growth (h−1). In agreement with in vivo experimentation, FBA accurately predicted a statistically significant decline of gonad growth for female fathead minnows (Mann Whitney test, p ≤ 0.05), whereas no effect was reported for males exposed to EE2 (Mann Whitney test, p ≥ 0.05) (). Furthermore, the in silico predicted biomass growth rate (h−1) was within a magnitude of gonad growth inferred in vivo. For example, Jensen et al. [Citation2001] reported GSI in reproductively active female fathead minnows to vary from approximately 8 dimensionless units (due to gonad mass being corrected for per unit body mass) on Day 0 post-spawn (or the day of spawning) to approximately 11 dimensionless units 48 hours after spawning (or Day 2 post-spawn). The increase in GSI on Day 2 post-spawn represented the highest (statistically significant) increase in GSI and provides an indicator of gonad growth in reproductively cycling females. The change (or difference) from Day 0 to Day 2 post-spawn represented as growth rate per hour (i.e., (11−8)/48 h) equated to a gonad growth (or biomass generation) rate of 0.063 h−1, a value which was within a magnitude of FBA predicted biomass generation for female fathead minnows in the solvent control group (0.012 ± 0.003 h−1, mean ± standard error of mean). In the same study, Jensen et al. [Citation2001] also showed male GSI to not change over a reproductive cycle, with an approximate GSI value of 1.3 dimensionless units over 48 hours post spawn to equate to a biomass generation rate of 0.027 h−1. However, the in silico predicted growth rate for solvent control males (in our study) was an order of magnitude lower (0.001 ± 0.0002 h−1, mean ± standard error of mean) than the in vivo calculated gonad growth rate for male fathead minnows calculated from Jensen et al. [Citation2001].
Figure 4. In silico flux balance analysis (FBA) predicted effects of exposure to 88 ng/L EE2 on gonad growth (as represented by the Biomass reaction) of male (A), and female (B) fathead minnows. EE2: 17α-ethynylestradiol; hr: hour; *** significant difference at p ≤ 0.001.
A key premise of the in silico biomass reaction was the expectation that steroid hormone production was associative with gonad growth. Thus far, there is a lack of clear information on whether concentrations of various steroid hormones correlate with changes in the GSI of fractional spawning fish species, such as the fathead minnow (Pimephales promelas). However for female fathead minnows, Jensen et al. [Citation2001] have shown that the plasma concentration 17β-estradiol correlates with changes in GSI over a spawning cycle (with no correlation shown for testosterone levels). In the same study, no correlations were evident between GSI and plasma 17β-estradiol or androgen concentrations (testosterone and 11-ketotestosterone) in male fish [Jensen, et al. Citation2001]. Furthermore, Villeneuve et al. [Citation2007] investigated whether steroidogenic enzyme gene expression correlated with GSI in male and female fathead minnows comprising different age groups of immature (3 months old), sexually differentiated (4 months old), and sexually mature fish (5 months old). The authors showed that expression of StAR and 3β-HSD increase with developmental stages for both male and female fish, with sex-specific increases in specific steroidogenic enzyme gene expression also evident for males (cyp11a, cyp17, 11β-HSD, and 20β-HSD) relative to females (cyp19a only). However, overall steroidogenic enzyme gene expression correlated poorly with GSI, which was speculated to be due to asynchronous spawning frequencies of fathead minnows and the presence of highly heterogeneous gamete developmental stages in the gonads of reproductively cycling male and female fish [Leino et al. Citation2005; Villeneuve, et al. Citation2007].
It can be hypothesized that regardless of the discrete dynamics of steroidogenic enzyme gene expression, steroid hormones produced during sexual development and gamete maturation may exhibit a more potent role towards determining gonad biomass change. Furthermore, the mitogenic or proliferative effects of steroid hormones on spermatogonial and oogonial proliferation can extend beyond the effects on gonad growth, to also include influences on whole-organism growth [Yaron and Levavi-Sivan Citation2011]. Specifically, Bhatta et al. [Citation2012] have shown gonadectomized Mozambique tilapia (Oreochromis mossambicus) to exhibit significantly lowered body weights as compared to sham operated fish. Plasma levels of 17β-estradiol and 11-ketotestosterone were also shown to be significantly decreased in gonadectomized male and female fish, with transplantation of gonads back into gonadectomized fish resulting in recovery of steroid hormone levels and body growth. The observed growth effects were postulated to be due to steroid hormone regulation of growth hormone (GH) synthesis and release as plasma levels of growth hormone was also significantly decreased in gonadectomized fish (although growth hormone gene expression in the pituitary did not change) [Bhatta, et al. Citation2012]. Additional evidence of the influence of steroid hormones on GH production is provided from studies with goldfish (Carassius auratus) and rainbow trout (Oncorhynchus mykiss). Zou et al. [Citation1997] showed 17β-estradiol exposure (implantation of silastic pellets containing 100 µg/gram 17β-estradiol for 5 days) to increase goldfish pituitary GH content by 170% and plasma GH levels by 350%. Significantly elevated GH levels in plasma of female rainbow trout have also been shown to correlate with steroid hormones (17β-estradiol and testosterone) and gonad development [Holloway et al. Citation1999].
In our study, the idealized biomass reaction stoichiometrically associated cholesterol uptake to the production of steroid hormones (in gonads) were ultimately consumed in a reaction representative of biomass generation (or gonad growth). It is unclear which particular steroid hormone or combination of hormones was the key driver for FBA prediction. The in silico model incorporated information on steroid hormone levels in gonad tissue along with gene expression fold changes (as min/max bounds) of steroidogenic enzyme activities. As the interrelation of all constraints contributed to the FBA calculated optimal flux value through the biomass reaction, it is difficult to isolate a specific constraint as being the main driver for FBA prediction. In order to preclude the possibility of a ‘false positive’ result under EE2 exposure, we also tested the predictive ability of FBA to compute biomass generation in adult female fathead minnows exposed to a synthetic progestin (norethindrone) and endogenous progestogen (progesterone). Adult female fathead minnows (not reproductively active) were exposed under flow-through conditions for 14 days 168 ng/L norethindrone and 34 ng/L progesterone [Petersen et al. Citation2015]. As per the analyses presented in this study, steroid hormone concentrations quantified in gonad tissue along with gene expression changes for key steroidogenic enzyme genes were used as constraints to construct in silico stoichiometric models of steroidogenesis for each fish. In vivo exposure of female fathead minnows to either compound exhibited no effects on %GSI [Petersen et al. Citation2015]. Furthermore, quantification of steroid hormone levels in ovary tissue showed no significant differences between solvent control (0.0042% DMF) and either progestin (norethindrone or progesterone) (Supplement 6). Interestingly, FBA predicted flux through the biomass reaction agreed with in vivo observations, with no statistically significant differences in flux through the biomass reaction (h−1) computed for either progestin (Supplement 7). The supplemental analysis highlighted FBA’s ability to predict lack of changes in gonad growth under exposure conditions that do not impact %GSI.
FBA prediction of optimal flux distributions
Subsequent to simulation of effects on gonad growth, optimal steroidogenic flux distributions generating the computed biomass were also identified. Analysis of optimal fluxes revealed that approximately 26% of steroidogenic reactions were used to generate biomass (or gonad growth) (Supplement 8; Worksheet#5 Optimal Fluxes). This percentage use of the network was lower than expected (especially as the in silico model comprised 124 enzyme-catalyzed reactions) and highlighted the possibility that gonad growth is under control of a select few ‘routes’ of steroidogenic fluxes (see Supplement 9 for pathway maps of optimal fluxes). Analysis of optimal fluxes for male fathead minnows showed significantly lowered values for reactions catalyzing androgen production (V73 (cyp11b): testosterone → 11β-hydroxytestosterone; and V74 (11β-HSD): 11β-hydroxytestosterone → 11-ketotestosterone), and a 17β-estradiol conjugation reaction (V124 (sulfotransferase): 17β-estradiol → 17β-estradiol-sulfate) (). A lowered flux through androgen synthesis pathways was reflected in the low testes levels for 11-ketotestosterone (significantly lowered) and testosterone (non-significantly lowered) measured in vivo (). Significantly lowered flux through a sulfotransferase reaction producing 17β-estradiol-sulfate was surprising and possibly due to the lowered availability of 17β-estradiol (non-significant) due to a lowered production of pre-cursor substrates, such as testosterone.
Figure 5. In silico flux balance analysis (FBA) predicted optimal fluxes required for gonad growth (or optimal biomass production) in male (A), and female (B) fathead minnows exposed to the solvent control and 88 ng/L 17α-ethynylestradiol (EE2). hr: hour; *, **, *** significant differences at p ≤ 0.05, p ≤ 0.01, p ≤ 0.001, respectively.
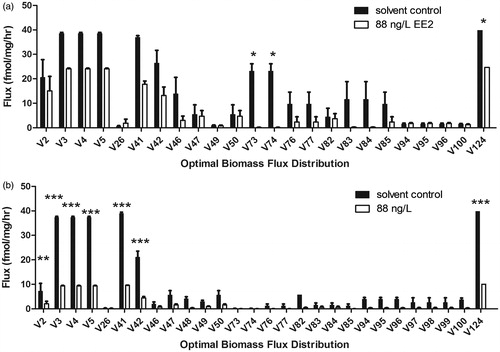
Analysis of optimal fluxes for female fathead minnows showed significantly lowered values for steroidogenic reactions catalyzing production of prgenenolone (V2 (cyp11a1): cholesterol → prgenenolone), 20α-hydroxycholesterol (V3 (cyp11a1): cholesterol → 20α-hydroxycholesterol), 17α,20α-dihydroxycholesterol (V4 (cyp17) 20α-hydroxycholesterol → 17α,20α-dihydroxycholesterol), 17α-hydroxypregnenolone (V5 (cyp11a1): 17α,20α-dihydroxycholesterol → 17α-hydroxypregnenolone; and V41 (cyp17): pregnenolone → 20α-hydroxycholesterol), 17α-hydroxyprogesterone (V42 (3β-HSD): 17α-hydroxypregnenolone → 17α-hydroxyprogesterone), and 17β-estradiol-sulfate (V124 (sulfotransferase): 17β-estradiol → 17β-estradiol-sulfate) (). The discrepancy between the in silico predicted decrease for fluxes producing progestogens and experimentally (in vivo) quantified increase of ovary progestogen concentrations is likely due to the speculated increase of 17α-hydroxylase activity in vivo. For example, FSH mediated activation of cyp17 17,20-lyase activity can enhance progestogen to androgen conversion. However, in our study the observed down-regulation of FSHβ (significant for females) may implicate the maintenance of cyp17 17α-hydroxylase activity and increased production of progestogens. The min/max flux constraints applied to cyp17 enzyme activity in the in silico model was irrespective of such differential 17,20-lyase versus 17α-hydroxylase activities of cyp17, hence the model was unable to predict the mismatch of increased progestogen production (in vivo) versus the in silico predicted lowered flux through progestogen synthesis pathways. Furthermore, for EE2 exposed females the decrease in cyp17 gene expression was less than 1 fold relative to solvent control females. As a consequence, the max (or upper) bound for cyp17 catalyzed reactions was un-modified for EE2 exposed females, further contributing to the discrepancy between in silico prediction and in vivo experimentation. Additionally, progestogen production (i.e., for pregnenolone, 17α-hydroxypregnenolone, and 17α-hydroxyprogesterone) in the in silico model was also catalyzed via cyp11a1 and 3β-HSD catalyzed reactions, whose reaction constraints (min/max flux bounds) were minimized relative to solvent control due to >1 fold down-regulation of their respective gene expressions (). However, the magnitude down regulation for cyp11a1 (4.4% relative to solvent control) and 3β-HSD (0.25% relative to solvent control) may be considered minimal (Supplement 8; Worksheet#3 Rxn Bounds). It is likely that the higher magnitude of flux minimization applied to StAR (cholesterol import reaction: EX_M1) for exposed females (75% reduction relative to solvent control) as compared to exposed males (38% reduction relative to solvent control) likely contributed to low substrate availability for subsequent ‘down-stream’ reactions (such as those catalyzed by cyp11a, cyp17, and 3β-HSD), hence explaining lowered flux capacities for these enzymes in both male and female fathead minnows (significantly lowered in females) (Supplement 8; Worksheet#3 Rxn Bounds). Despite the mismatch between in silico prediction of lowered progestogen production versus in vivo quantified increased progestogen production, computational analysis accurately predicted deleterious effects of EE2 exposure on progestogen synthesis pathways.
Artificial centering hit-and-run (ACHR) analysis of network-wide effects
ACHR sampling of reaction flux spaces allowed assessment of altered network-wide flux distributions between solvent control and EE2 exposed groups. Such un-biased analyses precluded definition of an objective function and allowed assessment of the candidate functional state of the entire steroid network. Principal component analysis (PCA) of ACHR sampled points identified characteristic groupings with solvent control exposed male and female fish comprising a single grouped cluster, and EE2 exposed males and females exhibiting distinctive grouping, respectively (). PCA analysis indicated distinctive steroidogenic effects between EE2 exposed male and female fish. Comparison of perturbed correlation coefficients between highly correlated reactions (i.e., r2 ≥ 0.9 or r2 ≥ −0.9) for EE2 exposed fish relative to solvent control indicated that exposed male fish exhibited a higher frequency of perturbation (or loss of correlated reactions relative to solvent control males) across a wide range of steroidogenic reactions (). In contrast, EE2 exposed females appeared to exhibit lower perturbations (). Highly correlated reactions tend to correspond with functional modules which may be representative of a networks functional state, for example Hala et al. [Citation2010] have shown highly correlated reactions in the piscine steroidogenic network to correspond with reaction co-sets that produce physiologically relevant steroid hormones.
Figure 6. Principal component analysis of ACHR sampled reaction fluxes for solvent control and 88 ng/L 17α-ethynylestradiol (EE2) exposed male and female fathead minnows. Each point represents an individual fish from either treatment group. ACHR: artificial centering hit-and-run.
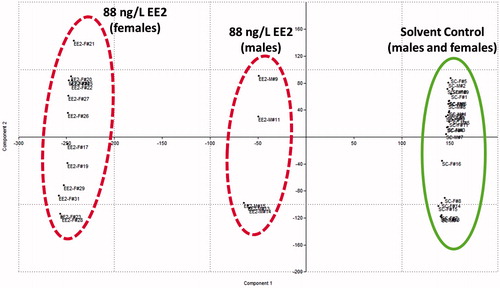
Figure 7. Analysis of the loss of highly correlated reactions in male and female fish exposed to 88 ng/L 17α-ethynylestradiol (EE2) (relative to solvent control). The number of mismatches per reaction refers to the total number of reactions in EE2 exposed male and female fish that lost highly correlated correlation coefficients (i.e., r2 ≥ 0.9 or r2 ≥ −0.9) with other steroidogenic enzyme catalyzed reactions in the steroid network.
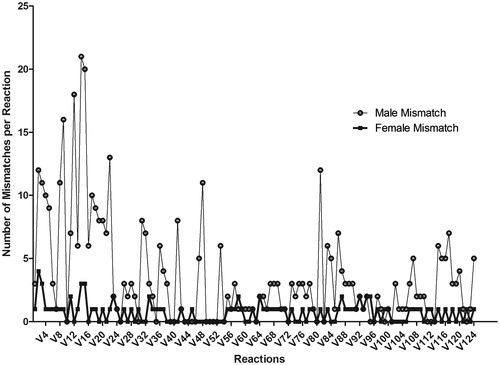
In male fish, of the total number of mismatched reactions (97) those catalyzing androgen production constituted the highest proportion (34%), followed by reactions producing progestogens (28%), corticosteroids (19%), estrogens (16%), and cholesterol-derivatives (3%) (Supplement 8; Worksheet#7 Male Corr. Coeff.). In female fish, fewer reactions were mismatched (74), however equivalent numbers of reactions catalyzing androgens (31%) and progestogens (31%) were mismatched, followed by estrogen (19%), corticosteroid (15%), and cholesterol-derivative (4%) synthesis reactions (Supplement 8; Worksheet#8 Female Corr. Coeff.). The consistently high mismatch for androgen and progestogen synthesis reactions identifies these steroids as being diagnostically disrupted on exposure to EE2. There is agreement of this in silico prediction with in vivo experimentation as androgen levels in male testes, and progestogen levels in female ovaries were the most highly perturbed (). Furthermore, it would appear that there is a higher degree of flux re-distribution in exposed males due to a larger proportion of mismatched reactions relative to exposed females. Whether such flux distribution reflects a higher compensatory response relative to females, is unclear. However, one could speculate that females are more susceptible to the effects of EE2 as they were not capable of ‘managing’ widespread flux redistributions in their steroid network and hence ‘succumbed’ more readily to the stressor. However, to truly qualify such a statement would require a time-series sampling regimen to isolate and identify discrete-dynamics of changing network usage on exposure to EE2. It might also be that females were attenuated at a more rapid rate than exposed males, and that sampling at the end of a 10 day exposure duration precluded analysis of large-scale network-wide flux redistributions in females. However, either case may lead to the same conclusion that females may be more susceptible to the effects of EE2 than males.
The in silico constraints-based FBA presented in this manuscript ‘anchored’ the underlying stoichiometry of steroidogenesis with a biomass reaction representative of gonad growth. Using targeted biomarker information from in vivo experimentation, FBA accurately predicted effects of EE2 exposure on fathead minnow gonad growth (or %GSI) and productions of androgen (in male fish) and progestogen (in female fish) steroid hormones. The good agreement between in vivo experimentation and in silico prediction highlighted the efficacy of FBA to integrate low-dimensional experimental data (i.e., quantification of ∼20 key biomarkers) with a high-dimensional stoichiometric network model comprising 199 reactions.
There are however limitations to the model as presented, for example (at present) the in silico model cannot account for contributions of various cell types towards producing steroid hormones in gonad tissues of male (i.e., from leydig and sertoli cells) and female (granulosa and thecal cells) fish. However, as overall tissue steroidogenesis was being simulated, the model did not have to discretize between steroid hormone productions from specialized cell types in gonad tissue. The stoichiometric model encapsulated the entire topology of steroid hormone metabolism and its association with gonad growth (using the Biomass reaction) and did not require cell-specific distinctions to be made. However, despite this simplification, the model cannot extend its stoichiometric architecture to simulate effects on reproduction itself, as fecundity is also a consequence of complex interactions between behavioral and pheromonal cues (and not only the production of steroid hormones), which at present are under-investigated and under-quantified. Extending beyond the existing network framework may lead to a higher degree of uncertainty as it would require associating stoichiometric mass-balances with an objective function (or outcome) that may involve constraints beyond the models predictive capabilities. In our manuscript, the morphometric index of percentage GSI was used to represent gonad growth and by extension, reproductive capability. A way forwards to quantitatively associate in silico prediction of altered %GSI with reproduction would be to generate a standard curve of predicted %GSI change (x-axis) plotted versus experimentally quantified changes in fecundity (i.e., number of eggs spawned/female/day) (y-axis). The generation of such a curve, whether linear or non-linear, would be invaluable for risk assessment and extend the capabilities of the in silico model.
Within a predictive toxicology paradigm, the in silico model presented may ‘refine’ the use of animal models by enabling a more mechanistic assessment of contaminant (or stressor) impact on steroidogenic network function and associated phenotype (or gonad growth). The relevance of this approach may be that given limited biomarker information, i.e., quantification of selected steroid hormones and fold changes in gene-expression for a subset of steroidogenic enzyme genes, diagnostic changes in network function can be simulated or predicted. It is uncertain if there are a minimal number of constraints that would need to be quantified for the model to still retain its predictive capabilities. Such an investigation may allow the acquisition of a minimal set of ‘key’ biomarkers that may be non-destructively sampled (such as levels of steroids in blood plasma) and be used as constraints in the biomass reaction. There may be some validity to such an approach as in our study there was overall good association of steroid hormones produced ex vivo with those quantified in vivo (in gonad tissue), however whether such an association would hold true for steroids in circulation (i.e., in blood plasma) is not known and is open to investigation. In applying the model to a wider context, one could envision its use in assessing the impacts of various stressor scenarios (not only contaminant-induced) by the non-destructive sampling of a few selected ‘key’ biomarkers that may act as effective constraints allowing the model to still retain its predictive power. Such an approach could have a remarkable impact on the ecotoxicological assessments of susceptible species inhabiting stressed ecosystems. Furthermore, model expansion to include and associate steroidogenesis with other ‘core’ metabolic pathways of glycolysis, TCA cycle, gluconeogenesis, and fatty acid β-oxidation will allow construction of a whole-organism biomass reaction and enable assessments of EDC impacts on organism growth and survival.
Methods
In vivo methods
Fish culture
Adult (≥5 months old) male and female fathead minnows (Pimephales promelas) were purchased from a commercial aquaculture supplier (Osage Catfisheries, MO, USA). On arrival, male and female fish were maintained in separate holding tanks for up to 7 d under flow-through conditions (with gentle aeration) at 25 ± 2°C and a 16 h light: 8 h darkness photoperiod. Fish were fed once per d with tetramin flake food (Pentair Aquatic Ecosystems, FL, USA, Cat.# 16106) and brine shrimp flake food (Pentair Aquatic Ecosystems, Cat.# ZBF5).
In vivo exposure
The fish short-term reproduction assay detailed by Ankley et al. [Citation2001] and the OECD 229 protocol titled Fish Short Term Reproduction Assay [OECD Citation2012] was adapted to use 4 male and 8 female fish per replicate tank for each treatment group (i.e., solvent control and 100 ng/L EE2). In total each treatment group comprised 8 males and 16 female fathead minnows, split evenly between two replicate tanks per treatment group. Fecundity, as number of eggs spawned per tank was continuously monitored during a 7 d pre-exposure period followed by a 10 d exposure period. Each tank (containing 18 liters of test solution) contained four PVC tiles (5–10 cms in length) to act as substrate for the deposition of eggs released by spawning fish.
Reproductively active male and female fathead minnows were exposed to a solvent control (0.0042% DMF) and a nominal concentration of 100 ng/L EE2 (Sigma Aldrich, MO, USA, Cat.# E4876-1 G). A 10 mg/mL (10,000 mg/L) EE2 stock (in ethanol) was diluted 1:4167 with N,N-dimethylformamide (DMF) to yield a 2.40 mg/L dosing stock. Subsequently, the dosing stock was diluted 1:24,000 with dechlorinated water (Denton City) to yield a final nominal concentration of 100 ng/L EE2. The 2.40 mg/L EE2 dosing stock was delivered using an infusion pump (Harvard Apparatus® PHD 2000) at a flow rate of 5 µl/min, whereas dilution water was delivered at a flow rate of 120 mL/min using a peristaltic pump (Masterflex® L/S model 07519-15). Both solutions were mixed in a 2 liter glass mixing chamber using a magnetic stir bar. Solvent control was delivered in a similar manner with final DMF concentration of 0.0042%. The 120 mL/min flow rate was split between two replicate tanks per treatment at an approximate flow rate of 60 mL/min per tank, yielding ∼5 volume turnovers per tank per d.
Water chemistry
LC-ESI+-MS/MS was used to detect EE2 in exposure aquaria. A seven-point mixed standard curve for EE2 and the internal standard, d3-17β-estradiol, was prepared by diluting (1:2) a 20 ng/mL stock of EE2 to 0.313 ng/mL, while maintaining internal standard (d3-17β-estradiol) at 5 ng/mL. Prior to analysis, both analytes were derivatized with 1:1 of 1 mg/mL dansyl chloride (in acetone) and 100 mM sodium bicarbonate (as described by [Nelson et al. Citation2004]). Briefly, samples were derivatized by incubation in an oven at 60°C for 3 min. Derivatized analytes were recovered by liquid:liquid extraction into 1:1 hexane:ethyl acetate with the recovered solvent dried under nitrogen and residue reconstituted in methanol prior to mass spectrometric analysis. Chromatographic separation was performed using a Waters™ 2695 separations module fitted with a Waters™ Sunfire C18 column (2.1x50 mm, 3.5 µm particle size). Mass spectrometric analysis was performed using a Micromass Quattro Ultima™ triple-quadrupole mass spectrometer. Multiple reaction monitoring (MRM) was performed for precursor > product ions of m/z 530 > 171 and 509 > 170 (±1 atomic mass unit) for dansyl chloride derivatized EE2 and d3-17β-estradiol, respectively.
Exposure aquaria were sampled on Days 3, 7, and 10 of exposure with 10 mLs water from each replicate tank spiked with 0.02 mL of 25 ng/mL internal standard (d3-17β-estradiol) and liquid/liquid extracted using 10 mL of 1:1 (v/v) hexane:ethyl acetate. The solvent layer was recovered and dried under a gentle stream of nitrogen with residue reconstituted into 1 mL of methanol. The recovered residue was dried under nitrogen and derivatized with dansyl chloride and finally reconstituted to 0.1 mL with methanol prior to mass spectrometric analysis. The final reconstitution step resulted in x100 concentration factor for EE2, yielding a theoretical nominal concentration of 10 µg/L, whereas d3-17β-estradiol was diluted 1:5 to yield a final concentration of 5 ng/mL.
Tissue sampling
At the end of exposure, fish were terminally anesthetized with 250 mg/L Ethyl 3-aminobenzoate methanesulfonate salt (MS222) (Sigma-Aldrich, Cat.# A5040-100G) with pH stabilized to 7.8 using 1 M sodium bicarbonate. For each fish, whole body wet weight was recorded. Liver and gonad tissues were subsequently excised and weighed for determination of hepatosomatic and gonadosomatic indices (using formula: (tissue weight/(whole body weight – tissue weight)) * 100) [Harries et al. Citation2000]. Additionally, from excised gonads, small segment of tissue were sectioned and incubated with 1 mL of Medium 199 (Sigma-Aldrich, Cat.# M3769) for determination of ex vivo produced steroid hormones (as described in Ex vivo gonad tissue culture). The remainder of gonad tissue was split between preservation at −80°C for analysis of steroid hormone ‘biomass’ composition and storage in RNAlater (Life Technologies, NY, USA, Cat.# AM7020) for RT-qPCR analysis of selected steroidogenic enzyme gene expressions. Liver and brain from each fish was also placed in RNAlater for RT-qPCR analysis of gonadotropin and vitellogenin gene expression. A detailed description of ex vivo gonad culture is described in Supplement 10.
Extraction of steroid hormones from gonads
Male and female gonad tissues frozen at −80°C were thawed on ice and weighed to obtain tissue wet weights. Each gonad tissue was placed in a 5 mL tube (VWR, PA, USA, Cat.# 16465-262). Glass beads (BioSpec Products, Bartlesville, OK, USA, Cat.# 11079110) were added to each 5 mL tube (up to ∼2 mL mark) followed by 4 mLs of 1:1 (v/v) hexane:ethyl acetate. Each tube was spiked with 20 µL of a mixed stock of internal standards (0.05 µg/mL d9-progesterone, 0.05 µg/mL d3-17α-hydroxypregnenolone; and 0.025 µg/mL d3-17β-estradiol) and gonad tissue was homogenized for 3 min using a Mini-Beadbeater (BioSpec Products). Homogenized samples were transferred to 20 mL borosilicate glass tubes (Fisher Scientific, PA, USA, Cat.# 14-957-76C) and 3 mL of Milli-Q water was added to each tube to allow phase separation of solvent and tissue debris. Homogenized samples were centrifuged at 2,500 rpm for 20 min after which the top solvent layer was recovered into 20 mL borosilicate glass vials (VWR, Cat.# 66022-065) and dried under a gentle stream of nitrogen. Dried residue was subsequently reconstituted with 1.5 mL of 1:1 (v/v) hexane:ethyl acetate and transferred to 2 mL glass amber vials (Fisher Scientific, Cat.# 03-391-9). Samples were dried under nitrogen with residue reconstituted with 100 µL acetonitrile and transferred to a 200 µL glass insert (Fisher Scientific, Cat.# C4012465). Each glass insert was placed into a 2 mL glass amber vial and frozen at −20°C for 2 h. The inclusion of this freezing step facilitated precipitation of aqueous debris and lipids [Hong et al. Citation2004]. From each insert, two 40 µL aliquots were removed and placed into two separate amber vials for derivatization with either 2-hydrazinopyridine or dansyl chloride to enable mass spectrometric quantification of steroid hormones. The 2-hydrazinopyridine derivatization involved drying the 40 µL aliquot under nitrogen, reconstitution of dried residue with 100 µL of 100 µg/mL 2-hydrazinopyridine and 250 µg/mL trifluoroacetic acid. Samples were derivatized by sonication at 42 KHz for 15 min. Subsequently, samples were dried under nitrogen and reconstituted with 40 µL methanol. Dansyl chloride derivatization is described in Water chemistry above.
Steroid hormone quantification using mass spectrometry
LC-ESI+-MS/MS was used to quantify steroid hormones produced from ex vivo culture of gonad tissue, and gonad tissue concentration of steroid hormones for compilation of the biomass reaction. Methods detailing mass spectrometric conditions used for detection of 2-hydrazinopyridine and dansyl chloride derivatized steroid hormones are described elsewhere [Hala et al. Citation2011, Citation2012]. For the 2-hydrazinopyridine derivatization method, a mixed standard curve was prepared by dilution from 40 ng/mL to 0.078 ng/mL for selected progestogen (17α-hydroxyprogesterone, 17α-hydroxypregnenolone, 17α,20β-dihydroxypregnenone, progesterone, and pregnenolone), androgen (testosterone and 11-ketotestosterone), and corticoid (11-deoxycortisol) steroid hormones, with 10 ng/mL d9-progesterone and d3-17α-hydroxypregnenolone used as internal standard. For the dansyl chloride derivatization method, a mixed standard from 40 ng/mL to 0.078 ng/mL was prepared for 17β-estradiol and estrone, with 5 ng/mL d3-17β-estradiol used as internal standard. Chromatographic and mass spectrometric conditions, along with MRM mass transitions for all derivatized steroid hormones are given in Supplement 11.
RT-qPCR analysis
Tissues (brain, gonad, and liver) stored in RNAlater were extracted for total RNA using the TRI Reagent Protocol (Sigma-Aldrich, Cat.# T9424). Upon extraction, RNA concentration and purity based on 260:280 (nucleic acid:protein) ratio was quantified using a TAKE3 multi-well plate with a BioTek Synergy-2 plate reader (Biotek, USA). Prior to performing a RT-qPCR assay, RNA was diluted to 40 ng/µL, with forward and reverse primers diluted to 10 µM. SYBR Green detection was used to quantify gene expression changes using the Qiagen Rotor-Gene SYBR Green RT-PCR kit (Qiagen, CA, USA, Cat.# 204074). One-step RT-qPCR reactions were performed in a 25 µL reaction mixture containing 12.5 µL SYBR Green, 0.25 µL RT mix, 2.5 µL of 10 µM forward primer, 2.5 µL of 10 µM reverse primer, 4.75 µL Rnase free water, and 2.5 µL template RNA. RT-qPCR was performed using a Corbett Life Science/Qiagen Rotor-Gene 6000. RNA was reverse-transcribed at 55°C for 10 min followed by 95°C for 5 min. PCR amplification was performed over 40 cycles of denaturation (95°C for 5 sec) and annealing/extension (60°C for 10 sec). Brain tissue was analyzed for FSH and LH β-subunit (FSHβ and LHβ) gene expressions; liver was analyzed for vitellogenin (vtg) gene expression; and gonads were analyzed for expressions of the mitochondrial cholesterol import protein (steroidogenic acute regulatory protein or StAR), and steroidogenic enzyme genes of cyp11a1, 3β-HSD, 20β-HSD, 11β-HSD, cyp19a1a, and cyp17. RT-qPCR data was normalized relative to the ribosomal reference gene rpl8 and quantified using the delta delta cycle threshold (ΔΔCt) method [Livak and Schmittgen Citation2001]. Primer sequences and associated qPCR efficiencies are listed in Supplement 12.
In silico methods
Stoichiometric model construction
The zebrafish steroid hormone biosynthesis pathway from the Kyoto Encyclopedia of Genes and Genomes (KEGG) database (dre00140) was used to obtain a detailed list of steroidogenic reactions. For each reaction, participating steroid metabolites were elementally mass-balanced using various cofactors or ‘currency metabolites’ such as NADP+/NADPH, NAD+/NADH, O2, H+, H2O, CO2, etc. (Supplement 8; worksheet#1 Reactions). In turn, mass-balanced steroidogenic reactions were mathematically represented as a m × n dimension stoichiometric matrix with 118 metabolites and cofactors comprising the ‘m × 1’ row vector; and a 199 steroidogenic and exchange (or transport) reactions comprising the ‘1 × n’ column vector. The metabolic conversion of each metabolite in the stoichiometric matrix was represented using negative (consumed) or positive (produced) integers. Additionally, exchange (or transport) reactions shuttling steroid metabolites and co-factors across the model boundary were represented as positive integers (uptake) or negative integers (excreted) (Supplement 8; worksheet#2 S-matrix). Of the total 199 reactions in the in silico steroidogenesis model, 107 reactions comprised steroidogenic reactions catalyzed by various cytochrome P450 (cyp450) and hydroxysteroid dehydrogenase (HSD) enzymes; 17 reactions comprised conjugation reactions mediated glucuronosyl-, sulfo-, or methyl-transferase enzymes; and the remaining 75 reactions comprised exchange (‘EX’) reactions shuttling steroid metabolites into/out across the model boundary (). Overall, the current in silico model gave approximately twice the coverage of steroidogenic reactions as in previously published models [Hala et al. Citation2010, Citation2012].
Table 1. Summary of steroidogenic, conjugation, and exchange reactions comprising the in silico steroid model.
Of the 75 exchange reactions, a single reaction comprised the ‘biomass reaction’ which detailed the coefficients of key steroid metabolites ‘consumed’ to produce per unit mass of gonad tissue. The biomass reaction constituted tissue concentrations (as femtomol/mg gonad) for progesterone, pregnenolone, 17α-hydroxyprogesterone, 17α-hydroxypregnenolone, 17α,20β-dihydroxypregnenone, 11-deoxycortisol, testosterone, 11-ketotestosterone, 17β-estradiol, and estrone (Supplement 8; worksheet#3 Biomass Composition). Steroid metabolite concentrations per unit gonad weight were quantified experimentally using LC-ESI + MS/MS as described in Extraction of steroid hormones from gonads and in Steroid hormone quantification using mass spectrometry.
FBA – model formulation
As a mathematical representation of the steroidogenic network, the stoichiometric matrix (or S-matrix) represented the invariant mapping (or linear transformation) of the dynamic mass balance of metabolites in the steroid network to a steady state assumption (i.e., ). Such transformation allowed the in silico model to be represented as a matrix-vector product (s · ν = 0) whose solution was the non-trivial set of coefficients for the 1 × n flux vector ‘ν’ [Schilling et al. Citation2000]. The solution to such a system resided within the null space spanned by non-negative basis vectors of the S-matrix which created a polyhedral ‘cone’ encompassing feasible solutions to the in silico steroid model [Schilling and Palsson Citation1998; Schilling et al. Citation1999]. The min/max constraints applied to each reaction in the model (or vector ‘ν’) served to bound the polyhedral cone, yielding a polyhedral polytope, whose ‘edges’ (or vertices) represented optimal (or maximal) solutions for selected network objective functions or system variables. In turn, an optimal solution was computed (for a stated objective function) by implementing the simplex algorithm which iteratively ‘searched’ along vertices of the polyhedral polytope until an optima was found (and not exceeded).
Hence, the in silico model was framed as a linear programming optimization problem as: Max ctν, subject to s · ν = 0 with inequality constraints on each network reaction of αi ≤ νi ≤ βi. The objective function was stated as the inner product of the 1 × n transpose of the cost vector (ct) and n × 1 vector of reaction fluxes (ν). Entries in the cost vector were all zeros except for a positive integer (1) representing the biomass (exchange) reaction (EX_Biomass) chosen as the objective function for optimization. Reaction constraints for each reaction in the model were set as: αi ≤ νi ≤ βi, where the maximal bound (βi) was set to an arbitrary value of a 1,000 fmol/mg/h, and the lower bound (αi) for non-reversible reactions set to zero. Transport (or exchange) reactions for metabolites (or cofactors) exported out of the model were represented as 1,000 fmol/mg/h, whereas metabolites (or cofactors) imported into the model were represented as −1,000 fmol/mg/h. Bounds on reversible reactions (especially for cofactors) were set to −1,000 (for αi) and 1,000 fmol/mg/h (for βi). In order to maintain metabolite mass-balances, exchange fluxes for individual steroid metabolites participating in the biomass reaction were nulled so as to allow a single output for these metabolites from the model (i.e., to produce biomass) and avoid imposition of competing export demands [Schilling et al. Citation2000].
Cholesterol uptake into the model (exchange reaction: EX_M1) was constrained as a reversible uptake reaction with reaction bounds set to −39.83 to +39.83 fmol/mg/h. The maximal upper bound for cholesterol uptake (39.83 fmol/mg/h) corresponded with that of 25-hydroxycholetsreol uptake into female fathead minnow ovary tissue as quantified by Breen et al. [Citation2007]. Both 25-hydroxycholesterol and cholesterol are metabolized identically by cyp11a1 (first enzyme catalyzed reaction in steroidogenesis) to yield stoichiometrically equivalent metabolites (such as pregnenolone, etc.), hence the uptake rate for 25-hydroxycholesterol was used as an analogous rate for cholesterol import into both male and female gonad tissue.
Additionally, reaction constraints (i.e., min/max or lower (αi)/upper (βi) bounds) of a subset of steroidogenic reactions for EE2 exposed male and female fish were re-scaled relative to the absolute difference of gene expression (fold) change relative to solvent control. The steroidogenic enzyme catalyzed reactions re-constrained only comprised 31% of total steroidogenic reactions (V1 to V124) (Supplement 8; Worksheet#3 Rxn Bounds). The absolute difference of fold change was used as a scaling factor by using it to either divide or multiply min/max constraints for a particular reaction depending on whether its expression change under EE2 exposure was either down-regulated or up-regulated. A nested conditional logic statement in Excel™ was used to re-scale reaction constraints relative to fold change in respective steroidogenic enzyme gene expression (Supplement 8; Worksheet#4 Rxn Bounds). For example, if expression fold change for a particular steroidogenic enzyme gene in EE2 exposed fish was <1 or >−1 fold, then the min/max constraint was unchanged as the magnitude fold change was considered to be marginal (i.e., within one-fold difference). However, if fold change for a gene was >1 or <−1, then the min/max constraint was either multiplied (due to expression up-regulation) or divided (due to expression down-regulation) by the absolute difference in fold change between the solvent control and EE2 exposed fish (Supplement 8; Worksheet#4 Rxn Bounds). As scaling factors for EE2 exposed fish were derived relative solvent control, min/max bounds for all fish in the solvent control group were not altered and left at the uniformly constrained bounds of −1,000/1,000 fmol/mg/h.
FBA – simulation of optimal gonad growth (or biomass production)
The imposition of gene-expression constraints and the biomass demand reaction led to the generation of a unique in silico model for each fish comprising the solvent control or EE2 exposed groups (Supplement 8; Worksheet#3 Biomass Composition). Whereas steroidogenic reaction stoichiometry was invariant (or unchanging), the constraints applied were variant (or unique) for each fish, in turn generating unique solution spaces symptomatic of the metabolic phenotype of a particular fish. FBA was used to simulate optimal flux through the biomass reaction (akin to gonad growth) along with associated optimal reaction flux distributions required to generate the computed biomass. FBA was performed for each fish (male and female) comprising the solvent control and EE2 exposed groups (Supplement 8; Worksheet#5 Optimal Fluxes). The biomass reaction was constrained as substrate (25-hydroxycholesterol) uptake rate (fmol/mg/h) producing biomass constituents (fmol/mg gonad tissue) per unit gonad (i.e., as substrate uptake/biomass composition: fmol/mg/h ÷ fmol/mg or fmol/mg/h * mg/fmol), yielding a tissue growth rate per unit time (h−1).
ACHR sampling of network-wide reaction solution-spaces
For each reaction in the in silico model, the range and distribution of flux values constrained by inequality constraints was sampled using a random-walk algorithm (ACHR) [Thiele et al. Citation2005]. ACHR sampled values for each reaction in the in silico model gave a network-wide representation of the ‘realizable’ flux capabilities of the network. ACHR analysis generated a set of 2,000 sample points (or flux values) for each reaction, which were averaged to yield representative mean flux values per reaction for each fish (Supplement 8; Worksheet#6 ACHR Data Points). The mean ACHR sampled flux values for each fish was analyzed using principal component analysis (PCA) to identify characteristic groupings amongst solvent control and EE2 exposed male and female fish. Correlation coefficients were also generated for mean ACHR sampled flux values for male and female fish in the solvent control and EE2 exposed groups. The presence of highly correlated reaction sets (r2 ≥ 0.9 or r2 ≥ −0.9) tend to correspond with functionally related reactions [Hala et al. Citation2010; Price et al. Citation2004]. Hence, correlation analysis was used to generate a single n × n correlation coefficient matrix for male and female fish exposed to solvent control and 88 ng/L EE2.
Finally, the absolute difference between two sets of correlation coefficients was calculated for highly correlated reactions, i.e., reactions with r2 ≥ 0.9 or r2 ≥ −0.9. The calculation of the so called ‘difference matrix’ allowed generation of a third n × n dimension matrix allowing assessment of which highly correlated reaction co-sets were altered on exposure to EE2 for both male (Supplement 8; Worksheet#7 Male Corr. Coeff.) and female fish (Supplement 8; Worksheet#8 Female Corr. Coeff.). Whereas FBA generated an optimal flux distribution for only a sub-set of steroidogenic reactions (i.e., those which maximized the value of a stated objective function, such as gonad growth), ACHR allowed assessment of the entire steady-state flux-space for the steroidogenic network, in turn helping to identify candidate (or diagnostic) network states representative of stressed etiology.
Statistical and computational analysis
All statistical analyses were performed using GraphPad Prism™ version 5 (GraphPad Software, La Jolla, CA, USA). For each fish, experimentally determined morphometric indices, steroid hormone levels, gene expression changes, and in silico predicted flux values were tested for normality using the Shapiro-Wilk’s test (normal distribution at p ≥ 0.05). Solvent control and EE2 exposed male and female fish were statistically compared using either the parametric un-paired t-test (if compliant with normal distribution) or non-parametric Mann-Whitney test (non-normal distribution). Two-way ANOVA was used to test for effects of EE2 exposure on FBA calculated optimal flux values in the in silico model (with treatment as main variable and reactions as covariate). PCA was performed and visualized using the PAST software (version 2.07; folk.uio.no/ohammer/past/) [Hammer et al. Citation2001]. The constraints-based reconstruction and analysis (COBRA) toolbox (version 2.0.5; opencobra.sourceforge.net) was used to perform all simulations with command lines invoked in MATLAB™ (version 2009a) [Becker et al. Citation2007; Schellenberger et al. Citation2011]. FBA was executed using the freely available linear programming solver, glpkmex (sourceforge.net). Correlational analysis of ACHR generated data was performed using Excel™.
| Abbreviations | ||
| ACHR | = | artificial centering hit-and-run |
| ar | = | androgen receptor |
| cAMP | = | adenylate cyclase |
| DMF | = | dimethylformamide |
| EDCs | = | endocrine disrupting compounds |
| EE2 | = | 17α-ethynylestradiol |
| ER | = | estrogen receptor |
| esr1 | = | estrogen receptor isoform |
| FBA | = | flux balance analysis |
| FSH | = | follicle-stimulating hormone |
| GABA | = | gamma-aminobutyric acid |
| GH | = | growth hormone |
| GnRH | = | gonadotropin releasing hormone |
| gnrh3 | = | gonadotropin releasing hormone isoform |
| GNRHR1 | = | GnRH receptor |
| %GSI | = | percent gonadosomatic index |
| %HSI | = | percent hepatosomatic index |
| kiss1r | = | Kisspeptin receptor expression |
| LH | = | luteinizing hormone |
| MRM | = | multiple reaction monitoring |
| PCA | = | principal component analysis |
| TFs | = | transcription factors |
| vtg | = | vitellogenin |
Supplementary materials available online
Supplementary Figures and Tables.
Supplementary material
Download Zip (2.8 MB)Declaration of interest
The authors report no declarations of interest.
Author contributions
Performed in vivo experimentation and sample analysis: DH, LHP; Performed in silico analyses and wrote the manuscript: DH; Provided support with RT-qPCR analysis: DM; Provided mentorship and funding for the study: DBH.
References
- Andersson, C. (2007) Evaluation of Biomarker Responses in Fish with Special Emphasis on Gill EROD Activity. Ph.D. dissertation, Uppsala University, Department of Physiology and Developmental Biology, Sweden. pp.1–60
- Ankley, G.T., Bennett, R.S., Erickson, R.J., Hoff, D.J., Hornung, M.W., Johnson, R.D., et al. (2010) Adverse outcome pathways: a conceptual framework to support ecotoxicology research and risk assessment. Environ Toxicol Chem 29:730–741
- Ankley, G.T., Jensen, K.M., Kahl, M.D., Korte, J.J. and Makynen, E.A. (2001) Description and evaluation of a short-term reproduction test with the fathead minnow (Pimephales promelas). Environ Toxicol Chem 20:1276–1290
- Becker, S.A., Feist, A.M., Mo, M.L., Hannum, G., Palsson, B.O. and Herrgard, M.J. (2007) Quantitative prediction of cellular metabolism with constraint-based models: the COBRA Toolbox. Nat Protoc 2:727–738
- Bhatta, S., Iwai, T., Miura, C., Higuchi, M., Shimizu-Yamaguchi, S., Fukada, H., et al. (2012) Gonads directly regulate growth in teleosts. Proc Natl Acad Sci U S A 109:11408–11412
- Bhattacharya, D., Redkar, A., Mittra, I., Sutaria, U. and MacRae, K.D. (1997) Oestrogen increases S-phase fraction and oestrogen and progesterone receptors in human cervical cancer in vivo. Br J Cancer 75:554–558
- Blair, R.M., Fang, H., Branham, W.S., Hass, B.S., Dial, S.L., Moland, C.L., et al. (2000) The estrogen receptor relative binding affinities of 188 natural and xenochemicals: structural diversity of ligands. Toxicol Sci 54:138–153
- Bonarius, H.P.J., Schmid, G. and Tramper, J. (1997) Flux analysis of underdetermined metabolic networks: the quest for the missing constraints. Trends in Biotechnology 15:308–314
- Breen, M.S., Villeneuve, D.L., Breen, M., Ankley, G.T. and Conolly, R.B. (2007) Mechanistic computational model of ovarian steroidogenesis to predict biochemical responses to endocrine active compounds. Ann Biomed Eng 35:970–981
- Brian, J.V., Harris, C.A., Scholze, M., Kortenkamp, A., Booy, P., Lamoree, M., et al. (2007) Evidence of estrogenic mixture effects on the reproductive performance of fish. Environ Sci Technol 41:337–344
- Cabas, I., Chaves-Pozo, E., Garcia-Alcazar, A., Meseguer, J., Mulero, V. and Garcia-Ayala, A. (2013) The effect of 17alpha-ethynylestradiol on steroidogenesis and gonadal cytokine gene expression is related to the reproductive stage in marine hermaphrodite fish. Mar Drugs 11:4973–4992
- Denny, J.S., Tapper, M.A., Schmieder, P.K., Hornung, M.W., Jensen, K.M., Ankley, G.T., et al. (2005) Comparison of relative binding affinities of endocrine active compounds to fathead minnow and rainbow trout estrogen receptors. Environ Toxicol Chem 24:2948–2953
- Estay, F., Colihueque, N. and Araneda, C. (2012) Comparison of oogenesis and sex steroid profiles between twice and once annually spawning of rainbow trout females (Oncorhynchus mykiss). Scientific World Journal 2012:1--7
- Feist, A.M. and Palsson, B.O. (2010) The biomass objective function. Curr Opin Microbiol 13:344–349
- Filby, A.L., Thorpe, K.L., Maack, G. and Tyler, C.R. (2007) Gene expression profiles revealing the mechanisms of anti-androgen- and estrogen-induced feminization in fish. Aquat Toxicol 81:219–231
- Filby, A.L., van Aerle, R., Duitman, J. and Tyler, C.R. (2008) The kisspeptin/gonadotropin-releasing hormone pathway and molecular signaling of puberty in fish. Biol Reprod 78:278–289
- Fong, S.S., Burgard, A.P., Herring, C.D., Knight, E.M., Blattner, F.R., Maranas, C.D., et al. (2005) In silico design and adaptive evolution of Escherichia coli for production of lactic acid. Biotechnol Bioeng 91:643–648
- Fong, S.S. and Palsson, B.O. (2004) Metabolic gene-deletion strains of Escherichia coli evolve to computationally predicted growth phenotypes. Nat Genet 36:1056–1058
- Garcia-Reyero, N. and Perkins, E.J. (2011) Systems biology: leading the revolution in ecotoxicology. Environ Toxicol Chem 30:265–273
- Goldzieher, J.W., de la Pena, A., Chenault, C.B. and Cervantes, A. (1975) Comparative studies of the ethynyl estrogens used in oral contraceptives. III. Effect on plasma gonadotropins. Am J Obstet Gynecol 122:625–636
- Griffitt, R.J., Hyndman, K., Denslow, N.D. and Barber, D.S. (2009) Comparison of molecular and histological changes in zebrafish gills exposed to metallic nanoparticles. Toxicol Sci 107:404–415
- Guillette, L.J., Jr. and Iguchi, T. (2012) Ecology. Life in a contaminated world. Science 337:1614–1615
- Hala, D., Amin, A., Mikler, A. and Huggett, D.B. (2010) A Constraint-Based Stoichiometric Model of the Steroidogenic Network of Zebrafish (Danio Rerio). Journal of Biological Systems 18:669–685
- Hala, D., Overturf, M.D., Petersen, L.H. and Huggett, D.B. (2011) Quantification of 2-hydrazinopyridine derivatized steroid hormones in fathead minnow (Pimephales promelas) blood plasma using LC-ESI+/MS/MS. J Chromatogr B Analyt Technol Biomed Life Sci 879:591–598
- Hala, D., Petersen, L.H., Martinovic, D. and Huggett, D.B. (2012) Constraints-based stoichiometric analysis of hypoxic stress on steroidogenesis in fathead minnows, Pimephales promelas. J Exp Biol 215:1753–1765
- Hammer, O., Harper, D. and Ryan, P. (2001) PAST: Paleontological Statistics Software Package for Education and Data Analysis. Palaeontologia Electronica 4:1–9
- Harding, L.B., Schultz, I.R., Goetz, G.W., Luckenbach, J.A., Young, G., Goetz, F.W., et al. (2013) High-throughput sequencing and pathway analysis reveal alteration of the pituitary transcriptome by 17alpha-ethynylestradiol (EE2) in female coho salmon, Oncorhynchus kisutch. Aquat Toxicol 142–143:146–163
- Harries, J.E., Runnalls, T., Hill, E., Harris, C.A., Maddix, S., Sumpter, J.P., et al. (2000) Development of a Reproductive Performance Test for Endocrine Disrupting Chemicals Using Pair-Breeding Fathead Minnows (Pimephales promelas). Environmental Science & Technology 34:3003–3011
- Hartung, T. (2009) Toxicology for the twenty-first century. Nature 460:208–212
- Herbison, A.E. and Pape, J.R. (2001) New evidence for estrogen receptors in gonadotropin-releasing hormone neurons. Front Neuroendocrinol 22:292–308
- Hoffmann, J.L., Torontali, S.P., Thomason, R.G., Lee, D.M., Brill, J.L., Price, B.B., et al. (2006) Hepatic gene expression profiling using Genechips in zebrafish exposed to 17alpha-ethynylestradiol. Aquat Toxicol 79:233–246
- Holloway, A.C., Sheridan, M.A., Van der Kraak, G. and Leatherland, J.F. (1999) Correlations of plasma growth hormone with somatostatin, gonadal steroid hormones and thyroid hormones in rainbow trout during sexual recrudescence. Comp Biochem Physiol B Biochem Mol Biol 123:251–260
- Hong, J., Kima, H.Y., Kim, D.G., Seo, J. and Kimb, K.J. (2004) Rapid determination of chlorinated pesticides in fish by freezing-lipid filtration, solid-phase extraction and gas chromatography-mass spectrometry. J Chromatogr A 4:1–2
- Ibarra, R.U., Edwards, J.S. and Palsson, B.O. (2002) Escherichia coli K-12 undergoes adaptive evolution to achieve in silico predicted optimal growth. Nature 420:186–189
- Jensen, K.M., Korte, J.J., Kahl, M.D., Pasha, M.S. and Ankley, G.T. (2001) Aspects of basic reproductive biology and endocrinology in the fathead minnow (Pimephales promelas). Comp Biochem Physiol C Toxicol Pharmacol 128:127–141
- Jimenez-Marin, A., Collado-Romero, M., Ramirez-Boo, M., Arce, C. and Garrido, J.J. (2009) Biological pathway analysis by ArrayUnlock and Ingenuity Pathway Analysis. BMC Proc 16:1753–6561
- Kaptaner, B., Kankaya, E. and Unal, G. (2009) Effects of 17α-Ethynylestradiol on Hepatosomatic Index, Plasma Vitellogenin Levels and Liver Glutathione-S-Transferase Activity in Lake Van Fish (Chalcalburnus tarichi Pallas, 1811). Fresenius Environmental Bulletin 18:2366–2372
- Kavlock, R.J., Ankley, G., Blancato, J., Breen, M., Conolly, R., Dix, D., et al. (2008) Computational toxicology–a state of the science mini review. Toxicol Sci 103:14–27
- Kime, D. (1993) ‘Classical’ and ‘non-classical’ reproductive steroids in fish. Reviews in Fish Biology and Fisheries 3:160–180
- King, S.R. and LaVoie, H.A. (2012) Gonadal transactivation of STARD1, CYP11A1 and HSD3B. Front Biosci 17:824–846
- Kramer, V.J., Etterson, M.A., Hecker, M., Murphy, C.A., Roesijadi, G., Spade, D.J., et al. (2011) Adverse outcome pathways and ecological risk assessment: bridging to population-level effects. Environ Toxicol Chem 30:64–76
- Le Guevel, R. and Pakdel, F. (2001) Assessment of oestrogenic potency of chemicals used as growth promoter by in-vitro methods. Hum Reprod 16:1030–1036
- Leino, R.L., Jensen, K.M. and Ankley, G.T. (2005) Gonadal histology and characteristic histopathology associated with endocrine disruption in the adult fathead minnow (Pimephales promelas). Environ Toxicol Pharmacol 19:85–98
- Livak, K.J. and Schmittgen, T.D. (2001) Analysis of relative gene expression data using real-time quantitative PCR and the 2(−Delta Delta C(T)) Method. Methods 25:402–408
- Miller, H.D., Clark, B.W., Hinton, D.E., Whitehead, A., Martin, S., Kwok, K.W., et al. (2012) Anchoring ethinylestradiol induced gene expression changes with testicular morphology and reproductive function in the medaka. PLoS One 7:e52479
- Miracle, A.L. and Ankley, G.T. (2005) Ecotoxicogenomics: linkages between exposure and effects in assessing risks of aquatic contaminants to fish. Reprod Toxicol 19:321–326
- Moutos, D., Smith, S. and Zacur, H. (1995) The effect of monophasic combinations of ethinyl estradiol and norethindrone on gonadotropins, androgens and sex hormone binding globulin: a randomized trial. Contraception 52:105–109
- Nagahama, Y. (1994) Endocrine regulation of gametogenesis in fish. Int J Dev Biol 38:217–229
- Nash, J.P., Kime, D.E., Van der Ven, L.T.M., Wester, P.W., Brion, F., Maack, G., et al. (2004) Long-Term Exposure to Environmental Concentrations of the Pharmaceutical Ethynylestradiol Causes Reproductive Failure in Fish. Environmental Health Perspectives 112:1725–1733
- Navas, J.M., Anglade, I., Bailhache, T., Pakdel, F., Breton, B., Jego, P., et al. (1995) Do gonadotrophin-releasing hormone neurons express estrogen receptors in the rainbow trout? A double immunohistochemical study. J Comp Neurol 363:461–474
- Nelson, R.E., Grebe, S.K., OKane, D.J. and Singh, R.J. (2004) Liquid chromatography-tandem mass spectrometry assay for simultaneous measurement of estradiol and estrone in human plasma. Clin Chem 50:373–384
- OECD (2012) Test No. 229: Fish Short Term Reproduction Assay, OECD Guidelines for the Testing of Chemicals, Section 2, OECD Publishing, Paris. DOI: http://dx.doi.org/10.1787/9789264185265-en
- Omura, T. and Morohashi, K. (1995) Gene regulation of steroidogenesis. J Steroid Biochem Mol Biol 53:19–25
- Orth, J.D., Thiele, I. and Palsson, B.O. (2010) What is flux balance analysis? Nat Biotechnol 28:245–248
- Petersen, L.H., Hala, D., Carty, D., Cantu, M., Martinovic, D. and Huggett, D.B. (2015) Effects of progesterone and norethindrone on female fathead minnow (Pimephales promelas) steroidogenesis. Environ Toxicol Chem 34:379–390
- Petersen, S.L., Ottem, E.N. and Carpenter, C.D. (2003) Direct and indirect regulation of gonadotropin-releasing hormone neurons by estradiol. Biol Reprod 69:1771–1778
- Price, N.D., Reed, J.L. and Palsson, B.O. (2004) Genome-scale models of microbial cells: evaluating the consequences of constraints. Nat Rev Microbiol 2:886–897
- Sampath Kumar, R., Ijiri, S. and Trant, J.M. (2000) Changes in the expression of genes encoding steroidogenic enzymes in the channel catfish (Ictalurus punctatus) ovary throughout a reproductive cycle. Biol Reprod 63:1676–1682
- Sanderson, J.T. (2006) The steroid hormone biosynthesis pathway as a target for endocrine-disrupting chemicals. Toxicol Sci 94:3–21
- Santos, L.H., Araujo, A.N., Fachini, A., Pena, A., Delerue-Matos, C. and Montenegro, M.C. (2010) Ecotoxicological aspects related to the presence of pharmaceuticals in the aquatic environment. J Hazard Mater 175:45–95
- Savinell, J.M. and Palsson, B.O. (1992) Network analysis of intermediary metabolism using linear optimization. I. Development of mathematical formalism. J Theor Biol 154:421–454
- Schellenberger, J., Que, R., Fleming, R.M., Thiele, I., Orth, J.D., Feist, A.M., et al. (2011) Quantitative prediction of cellular metabolism with constraint-based models: the COBRA Toolbox v2.0. Nat Protoc 6:1290–1307
- Schilling, C.H., Edwards, J.S., Letscher, D. and Palsson, B.O. (2000) Combining pathway analysis with flux balance analysis for the comprehensive study of metabolic systems. Biotechnol Bioeng 71:286–306
- Schilling, C.H. and Palsson, B.O. (1998) The underlying pathway structure of biochemical reaction networks. Proc Natl Acad Sci USA 95:4193–4198
- Schilling, C.H., Schuster, S., Palsson, B.O. and Heinrich, R. (1999) Metabolic pathway analysis: basic concepts and scientific applications in the post-genomic era. Biotechnol Prog 15:296–303
- Scholz, S. and Gutzeit, H.O. (2000) 17-alpha-ethinylestradiol affects reproduction, sexual differentiation and aromatase gene expression of the medaka (Oryzias latipes). Aquat Toxicol 50:363–373
- Schug, T.T., Janesick, A., Blumberg, B. and Heindel, J.J. (2011) Endocrine disrupting chemicals and disease susceptibility. J Steroid Biochem Mol Biol 127:204–215
- Seki, M., Yokota, H., Matsubara, H., Tsuruda, Y., Maeda, M., Tadokoro, H., et al. (2002) Effect of ethinylestradiol on the reproduction and induction of vitellogenin and testis-ova in medaka (Oryzias latipes). Environ Toxicol Chem 21:1692–1698
- Senthilkumaran, B., Yoshikuni, M. and Nagahama, Y. (2004) A shift in steroidogenesis occurring in ovarian follicles prior to oocyte maturation. Mol Cell Endocrinol 215:11–18
- Sewer, M.B. and Waterman, M.R. (2001) Insights into the transcriptional regulation of steroidogenic enzymes and StAR. Rev Endocr Metab Disord 2:269–274
- Sonnenschein, C. and Soto, A.M. (1998) An updated review of environmental estrogen and androgen mimics and antagonists. J Steroid Biochem Mol Biol 65:143–150
- Sturla, S.J., Boobis, A.R., FitzGerald, R.E., Hoeng, J., Kavlock, R.J., Schirmer, K., et al. (2014) Systems toxicology: from basic research to risk assessment. Chem Res Toxicol 27:314–329
- Sumpter, J.P. and Jobling, S. (1995) Vitellogenesis as a biomarker for estrogenic contamination of the aquatic environment. Environ Health Perspect 7:173–178
- Tabb, M.M. and Blumberg, B. (2006) New modes of action for endocrine-disrupting chemicals. Mol Endocrinol 20:475–482
- Thiele, I., Price, N.D., Vo, T.D. and Palsson, B.O. (2005) Candidate metabolic network states in human mitochondria. Impact of diabetes, ischemia, and diet. J Biol Chem 280:11683–11695
- Van den Belt, K., Berckmans, P., Vangenechten, C., Verheyen, R. and Witters, H. (2004) Comparative study on the in vitro/in vivo estrogenic potencies of 17beta-estradiol, estrone, 17alpha-ethynylestradiol and nonylphenol. Aquat Toxicol 66:183–195
- Varma, A. and Palsson, B.O. (1994) Metabolic Flux Balancing: Basic Concepts, Scientific and Practical Use. Nat Biotech 12:994–998
- Villeneuve, D.L., Blake, L.S., Brodin, J.D., Greene, K.J., Knoebl, I., Miracle, A.L., et al. (2007) Transcription of key genes regulating gonadal steroidogenesis in control and ketoconazole- or vinclozolin-exposed fathead minnows. Toxicol Sci 98:395–407
- Villeneuve, D.L. and Garcia-Reyero, N. (2011) Vision & strategy: Predictive ecotoxicology in the 21st century. Environ Toxicol Chem 30:1–8
- Villeneuve, D.L., Garcia-Reyero, N., Martinovic-Weigelt, D., Li, Z., Watanabe, K.H., Orlando, E.F., et al. (2012) A graphical systems model and tissue-specific functional gene sets to aid transcriptomic analysis of chemical impacts on the female teleost reproductive axis. Mutat Res 746:151–162
- Volz, D.C., Belanger, S., Embry, M., Padilla, S., Sanderson, H., Schirmer, K., et al. (2011) Adverse outcome pathways during early fish development: a conceptual framework for identification of chemical screening and prioritization strategies. Toxicol Sci 123:349–358
- Waagmeester, A.S., Kelder, T. and Evelo, C.T. (2008) The role of bioinformatics in pathway curation. Genes Nutr 3:139–142
- Watanabe, K.H., Andersen, M.E., Basu, N., Carvan, M.J., 3rd, Crofton, K.M., King, K.A., et al. (2011) Defining and modeling known adverse outcome pathways: Domoic acid and neuronal signaling as a case study. Environ Toxicol Chem 30:9–21
- Williams, T.D., Turan, N., Diab, A.M., Wu, H., Mackenzie, C., Bartie, K.L., et al. (2011) Towards a system level understanding of non-model organisms sampled from the environment: a network biology approach. PLoS Comput Biol 7:25
- Wintermantel, T.M., Campbell, R.E., Porteous, R., Bock, D., Grone, H.J., Todman, M.G., et al. (2006) Definition of estrogen receptor pathway critical for estrogen positive feedback to gonadotropin-releasing hormone neurons and fertility. Neuron 52:271–280
- Yaron, Z. and Levavi-Sivan, B. (2011) Endocrine Regulation of Fish Reproduction. Encyclopedia of Fish Physiology: From Genome to Environment 2:1500–1508
- Yim, H., Haselbeck, R., Niu, W., Pujol-Baxley, C., Burgard, A., Boldt, J., et al. (2011) Metabolic engineering of Escherichia coli for direct production of 1,4-butanediol. Nat Chem Biol 7:445–452
- Zha, J., Wang, Z., Wang, N. and Ingersoll, C. (2007) Histological alternation and vitellogenin induction in adult rare minnow (Gobiocypris rarus) after exposure to ethynylestradiol and nonylphenol. Chemosphere 66:488–495
- Zhu, B.T., Han, G.Z., Shim, J.Y., Wen, Y. and Jiang, X.R. (2006) Quantitative structure-activity relationship of various endogenous estrogen metabolites for human estrogen receptor alpha and beta subtypes: Insights into the structural determinants favoring a differential subtype binding. Endocrinology 147:4132–4150
- Zohar, Y., Munoz-Cueto, J.A., Elizur, A. and Kah, O. (2010) Neuroendocrinology of reproduction in teleost fish. Gen Comp Endocrinol 165:438–455
- Zou, J.J., Trudeau, V.L., Cui, Z., Brechin, J., Mackenzie, K., Zhu, Z., et al. (1997) Estradiol stimulates growth hormone production in female goldfish. Gen Comp Endocrinol 106:102–112