
Abstract
Changes in the uterus expression of carbonic anhydrase (CA) II, III, IX, XII, and XIII were investigated under the influence of sex-steroids in order to elucidate mechanisms underlying differential effects of these hormones on uterine pH. Uteri of ovariectomised rats receiving over three days either vehicle, estrogen, or progesterone or three days estrogen followed by three days either vehicle or progesterone were harvested. Messenger RNA (mRNA) and protein levels were quantified by real-time PCR and Western blotting, respectively. The distribution of CA isoenzymes proteins were examined by immunohistochemistry. The levels of CAII, III, XII, and XIII mRNAs and proteins were elevated while levels of CAIX mRNA and protein were reduced following progesterone-only and estrogen plus progesterone treatment, compared to the control and estrogen plus vehicle, respectively. Following estrogen treatment, expression of CAII, IX, XII, and CAXIII mRNAs and proteins were reduced, but remained at a level higher than control, except for CAIX, where its level was higher than the control and following progesterone treatment. Under progesterone-only and estrogen plus progesterone influences, high levels of CAII, III, XII, and XIII were observed in uterine lumenal and glandular epithelia and myometrium. However, a high level of CAIX was observed only under the influence of estrogen at the similar locations. In conclusion, high expression of CAII, III, XII, and XIII under the influence of progesterone and estrogen plus progesterone could result in the reduction of uterine tissue and fluid pH; however, the significance of high levels of CAIX expression under the influence of estrogen remains unclear.
Introduction
Carbonic anhydrase (CA) is a zinc containing metalloenzyme consisting of sixteen isoforms. It is responsible for reversible hydration of CO2 to H+ and [Aspatwar et al. Citation2014]. CA is expressed in many absorptive and secretory epithelia and participates in pH changes [Aspatwar et al. Citation2014]. This enzyme exists in many forms which include the membrane-bound CAIV, CAIX, and CAXII [Hynninen et al. Citation2004; Karhumaa et al. Citation2000; Zhu and Sly Citation1990] and cytosolic CAI, CAII, CAIII, CAVII, and CAXIII [Aliakbar et al. Citation1990a; Berg et al. Citation2004; Lehtonen et al. Citation2004]. The secretory CAVI has been identified in breast milk [Kivelä et al. Citation1999]. CA activity has been reported in the female reproductive tract, including fallopian tubes, uterus, ovaries, and cervical mucus [Chantler et al. Citation1977; Friedley and Rosen Citation1975; Lutwak-Mann Citation1955; Nicholls and Board Citation1967].
Expression of different isoenzymes for CA has also been reported along the female reproductive tract [Ge and Spicer Citation1988; Rosen et al. Citation2001]. CAII, XII, and XIII were found to be expressed in the mouse genital tract and ovaries while CAII was found to be expressed in the mouse oviductal epithelium [Ge and Spicer Citation1988]. CAXII was found to be expressed in the human [Karhumaa et al. Citation2000], mouse [Hynninen et al. Citation2004], and sheep [Hu and Spencer Citation2005] endometrium. CAXII was reported to be expressed in the human cervix, fallopian tubes, and ovaries [Ivanov et al. Citation2001]. CAXIII was reported to be expressed in the mouse uteri [Hynninen et al. Citation2004]. Expression of CAII was documented in the bovine [Nishita et al. Citation1990] and human [Aliakbar et al. Citation1990a; Aliakbar et al. Citation1990b] placenta and in the fetal villous endothelia [Aliakbar et al. Citation1990a; Aliakbar et al. Citation1990b; Kaufmann et al. Citation1994]. Additionally, membrane-bound CAIV was also reported to be expressed in the mouse placenta [Rosen et al. Citation2001].
Both expression and activity of uterine CA could be influenced by sex-steroids [Gholami et al. Citation2013; Lutwak-Mann Citation1955; Maren Citation1967; Nicholls and Board Citation1967; Pincus and Bialy Citation1963]. In humans, the levels of CAXII mRNA increase during the proliferative phase of the menstrual cycle [Ivanov et al. Citation2001]. In intact female rats, high expression of CAII and CAXII proteins were reported in the endometrium during the estrus phase of the oestrous cycle when estrogen levels predominate. High expression of CAXII was reported at the diestrus phase of the oestrous cycle when progesterone predominates [Gholami et al. Citation2013]. In ovariectomised rats receiving estrogen or progesterone treatment, high expression level of CAII and both CAII and CAXII were observed, respectively, in the epithelium lining the uterine lumen [Gholami et al. Citation2013].
Precise control of uterine fluid and tissue pH is important for multiple processes of reproduction. On one hand, an alkaline uterine fluid pH is essential for sperm transport and capacitation, fertilization, and development of early stage embryos [Liu et al. Citation2012]. On the other hand, an acidic uterine fluid pH is needed for the establishment of cellular communication and inflammatory milieu during post-implantation [Sun-Wada et al. Citation2000]. In order to achieve the desired pH, multiple membrane transporters are involved, which include the cystic fibrosis transmembrane regulator (CFTR), sodium bicarbonate cotransporter (SLC4A4), chloride-bicarbonate exchanger (SLC26A6) [Liu et al. Citation2012], and V-ATPase [Jaiswal et al. Citation2012]. The involvement of CA has also been proposed [Gholami et al. Citation2013; He et al. Citation2010].
So far, information with regard to expression of uterine CA isoenzymes were far from complete. The effect of sex-steroids on the expression of these isoenzymes has not been fully revealed. Apart from CAII and CAXII, the expression of CAIII, IX, and XIII which are also expressed in uterus [Hynninen et al. Citation2004; Karhumaa et al. Citation2000; Lehtonen et al. Citation2004] has never been studied. We hypothesized that uterine CA isoenzyme (II, III, IX, XII, and XIII) expression was influenced by sex-steroids to modulate uterine pH. We therefore investigated the level of expression of the different CA isoenzymes (CAII, III, IX, XII, and XIII) and their distribution pattern in the uterus under the influence of different female sex-steroids.
Results
Sex-steroid treatment and the expression of uterus CA isoenzyme mRNAs
Animals received the following treatments: three days either peanut oil (C-control), estradiol-17β (E), or progesterone (P) which was intended to investigate the effects of individual sex-steroids; and three day estradiol-17β plus three days progesterone (E + P) treatment which was intended to investigate the progesterone effect on estrogen-sensitized uteri which mimics the changes in sex hormone profiles throughout the reproductive cycle. A three day treatment with estradiol-17β plus three days peanut oil (E + V) acted as control (C) for the E + P group.
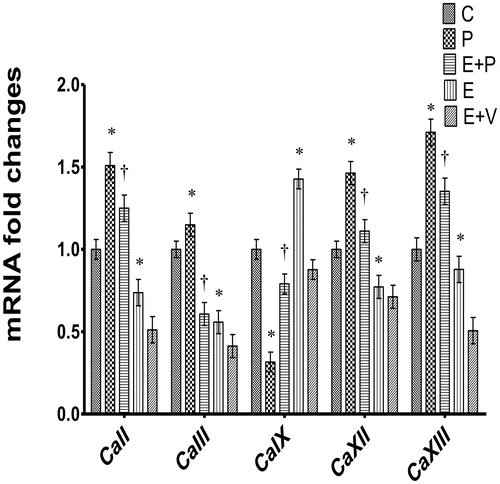
As shown in , the levels of CaII mRNA were highest in P-treated rats, approximately 1.5 fold higher than C. However, in E treated rats, the levels of CaII mRNA were significantly lower compared to C. In rats which received E + P treatment, the level of CaII mRNA was significantly higher compared to E + V (p < 0.05). Expression of CaIII mRNA was highest in the P-treated rats. In rats receiving E-only treatment, the level of CaIII mRNA was significantly lower compared to C. Meanwhile, in rats which received E + P treatment, the level of CaIII mRNA was significantly higher compared to E + V. In P-only treated rats, expression of CaIX mRNA was significantly lower compared to C (p < 0.05). However, in rats which received E-only treatment, the level of CaIX mRNA was markedly higher compared to C (approximately 1.45 fold). In E + P treated rats, the level of CaIX mRNA was significantly lower compared to E + V (p < 0.05). Expression level of CaXII mRNA was highest in P-only treated rats. In E-only treated rats, the levels of CaXII mRNA were lower compared to C and P. In E + P treated rats, the level of CaXII mRNA was higher than E + V. Expression of CaXIII mRNA was highest in P-only treated rats, approximately 1.75 fold higher than C. E-only treatment resulted in a lower level of CaXIII mRNA compared to C (p < 0.05). In rats receiving E + P treatment, CaXIII mRNA was approximately 2.7 folds higher compared to E + V.
Figure 1. Expression of uterine Ca isoenzymes mRNAs in uterus. y-axis represents mRNA fold changes which were measured relative to control and calculated with the 2−ΔΔCT method. x-axis represents different Ca isoenzymes mRNAs. Highest CaII, III, XII, and XIII levels were observed in progesterone-treated rats while highest CaIX levels were observed in estrogen-treated rats. All data were expressed as mean ± SEM from six independent observations. *p < 0.05 as compared to C, †p < 0.05 as compared to E + V. C: control, P: progesterone, E: estrogen, V: vehicle (control).
Expression and distribution of uterine CA isoenzyme proteins
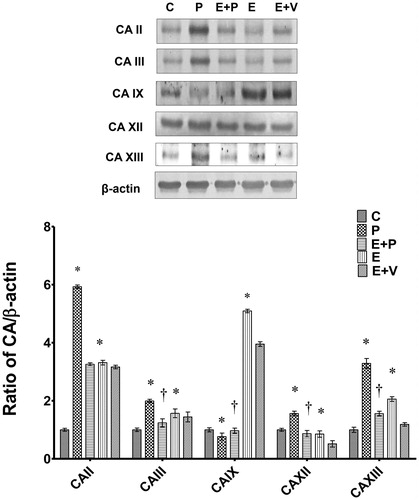
shows the levels of CA isoenzyme proteins in uterine tissue homogenates. Our findings indicated that the levels of CAII, III, XII, and XIII were highest in rats which received the P-only treatment. In these rats, levels of CAII were nearly 6-fold higher compared to C while the levels of CAXIII was approximately 3.5-fold higher compared to C. In addition, the levels of CAIII and XII were also significantly higher than C. However, CAIX protein levels were significantly lower compared to C. Meanwhile, in E-treated rats, the levels of CAII, III, and XIII were significantly higher compared to C, however lower than P. In these rats, the levels of CAIX and CAXII were significantly lower compared to C and P. In rats which received E + P treatment, levels of CAII protein were not significantly different compared to E + V. However, in these rats, a slight but significantly lower CAIII protein level was noted compared to E + V. In E + P treated rats, the levels of CAIX protein were lower compared to E + V. However, in these rats, the levels of CAXII and CAXIII were significantly higher compared to E + V.
Figure 2. Expression of uterine CA isoenzymes protein in uterus. Representative Western blot images of CA protein bands and the related bar graph showing ratio of CA isoenzymes proteins over β-actin. y-axis represents ratio of the intensity of CA isoenzymes protein bands over the intensity of β-actin protein bands while x-axis represents different CA isoenzymes proteins. The ratio for CA II, III, XII, and XIII over β-actin were highest in progesterone-treated rats while the ratio for CA IX over β-actin was highest in estrogen-treated rats. All data were expressed as mean ± SEM from four independent observations. *p < 0.05 compared to C, †p < 0.05 compared to E + V. C: control, P: progesterone, E: estrogen, V: vehicle (control). Molecular weight for CAII, III, IX, XII, and XIII are 29 kDa, 28 kDa, 58 kDa, 43 kDa, and 30 kDa, respectively.
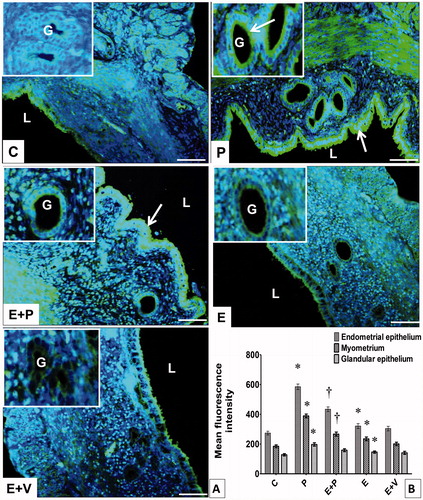
In comparison, summarizes the levels of CAII showing that they were highest in the lumenal and glandular epithelia of P-treated rats. In the lumenal epithelium the CAII protein was found at both apical and basolateral membranes. However, in the glandular epithelium, CAII protein was localized only at the apical membrane. In addition, high levels of CAII could also be seen in the myometrium. Levels of CAII in E-treated rats were slightly higher compared to C. In these rats, CAII protein was found to be distributed in the lumenal and glandular epithelia, mainly at the apical membrane. Low levels of CAII could be seen in the stroma and myometrium. Meanwhile, in rats receiving E + P treatment, high levels of CAII protein were observed in the lumenal and glandular epithelia, mainly at the apical membrane. This protein was also found in the myometrium. In these rats, the CAII protein level was significantly higher compared to E + V.
Figure 3. Distribution and expression levels of CAII in uterus. (A) CAII was distributed in different uterine compartments, i.e., epithelia and myometrium. Arrow pointing towards CAII distribution in the endometrial and glandular epithelia. L: lumen, G: gland, Scale bar = 100 μM. (B) Levels of CAII protein in different uterine compartments. Y-axis represents the mean fluorescence intensity while x-axis represents different groups of treatments. The highest fluorescence intensity for CAII was observed in epithelia and myometrium of progesterone-treated rats. All data were expressed as mean ± SEM from four independent observations. *p < 0.05 compared to C, †p < 0.05 compared to E + V. E: estrogen, P: progesterone, C: control, V: vehicle (control).
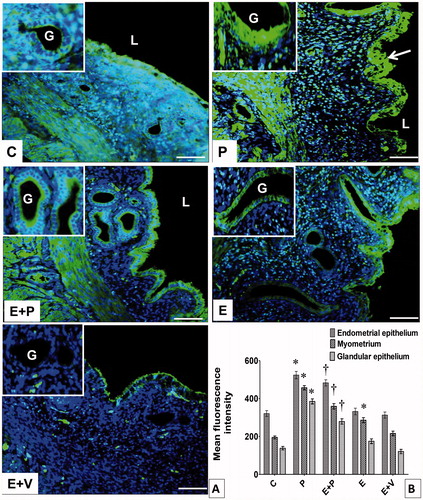
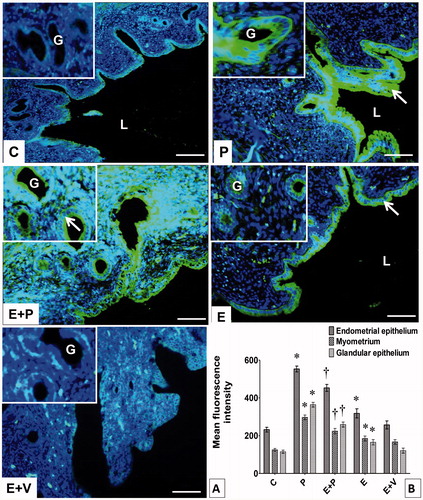
As shown in , CA III expression was highest in lumenal and glandular epithelia of rats receiving the P-only treatment. This protein was found to be distributed throughout the cells. In these rats, high levels of CAIII protein could also be seen in the myometrium. In rats which received E-only treatment, the levels of CAIII protein in the lumenal epithelium were not significantly different compared to C. In these rats, the level of CAIII protein in the myometrium was higher than C. Meanwhile, in rats which received E + P treatment, a higher level of CAIII protein could be seen in the lumenal and glandular epithelia and myometrium compared to E + V (p < 0.05). This protein was mainly distributed at the apical membrane.
Figure 4. Distribution and expression levels of CAIII in uterus. (A) CAIII was distributed in different uterine compartments. Arrow pointing towards CAIII distribution in endometrial epithelium. L: lumen, G: gland, Scale bar = 100 μM. (B) Levels of CAIII protein in different uterine compartments. Y-axis represents the mean fluorescence intensity while x-axis represents different groups of treatments. The highest fluorescence intensity for CAIII was observed in epithelia and myometrium of progesterone-treated rats. All data were expressed as mean ± SEM from four independent observations. *p < 0.05 compared to C, †p < 0.05 compared to E + V. E: estrogen, P: progesterone, C: control, V: vehicle (control).
shows that the level of CAIX was highest in rats receiving E-only treatment. In these rats, CAIX was highly expressed at the apical and basolateral membranes of lumenal and glandular epithelia. High expression levels were also seen in the myometrium. However, in rats which received P-only treatment, lower levels of CAIX protein could be seen in the lumenal epithelium compared to C (p < 0.05). In these rats, very low CAIX could be seen in the glands and myometrium. Meanwhile, in rats which received E + P treatment, the levels for CAIX protein in the lumenal and glandular epithelia and myometrium were significantly lower compared to E + V (p < 0.05). In the E + V treated rats, CAIX protein was found to be distributed at the apical and basolateral membranes of lumenal and glandular epithelia and myometrium. In contrast, as shown in , the highest level of CAXII could be seen in the lumenal and glandular epithelia of P-only treated rats, mainly at apical and basolateral membranes. Additionally, high levels of CAXII protein could also be observed in the myometrium. In rats which received E-only treatment, levels of CAXII protein in the lumenal epithelium was higher than C (p < 0.05), and was mainly distributed at the apical membrane. Meanwhile, in rats which received E + P treatment, higher expression level of CAXII protein could be seen in the lumenal and glandular epithelia compared to E + V, mainly at the apical membrane. In comparison as shown in , the highest level of CAXIII protein could be seen in rats which received P-only treatment. In these rats, CAXIII protein was distributed at apical and basolateral membranes of the lumenal and glandular epithelia. In rats which received E-only treatment, levels of CAXIII protein were higher than the control, and the protein was distributed mainly at apical and basolateral membranes of the lumenal and glandular epithelia. Meanwhile, in E + P treated rats, higher levels of CAXIII could be seen in the lumenal and glandular epithelia and myometrium compared to E + V, mainly at the apical and basolateral membranes (p < 0.05). Very low levels could be seen throughout the uterus following E + V treatment.
Figure 5. Distribution and expression levels of CAIX in uterus. (A) CAIX was distributed in different uterine compartments. Arrows point towards CAIX in endometrial epithelium. L: lumen, G: gland, Scale bar = 100 μM. (B) Levels of CAIX protein in different uterine compartments. Y-axis represents the mean fluorescence intensity while x-axis represents different groups of treatments. The highest fluorescence intensity for CAIX was observed in epithelia and myometrium of estrogen-treated rats. All data were expressed as mean ± SEM from four independent observations. *p < 0.05 compared to C, †p < 0.05 compared to E + V. E: estrogen, P: progesterone, C: control, V: vehicle (control).
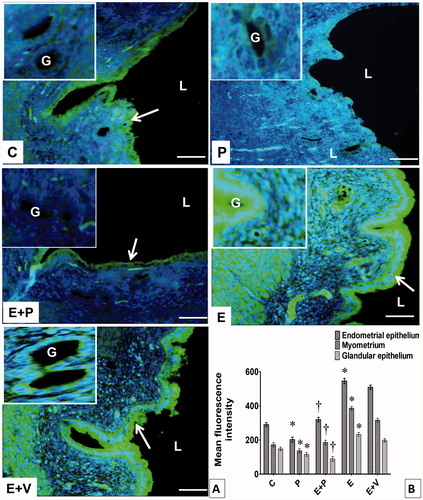
Figure 6. Distribution and expression levels of CAXII in uterus. (A) CAXII was distributed in different uterine compartments. Arrow pointing towards CAXII in endometrial epithelium. (B) Levels of CAXII protein in different uterine compartments. The highest fluorescence intensity for CAXII was observed in epithelia and myometrium of progesterone-treated rats. All data were expressed as mean ± SEM from four independent observations. *p < 0.05 compared to C, †p < 0.05 compared to E + V. E: estrogen, P: progesterone, C: control, V: vehicle (control), L: lumen, G: gland, Scale bar = 100 μM.
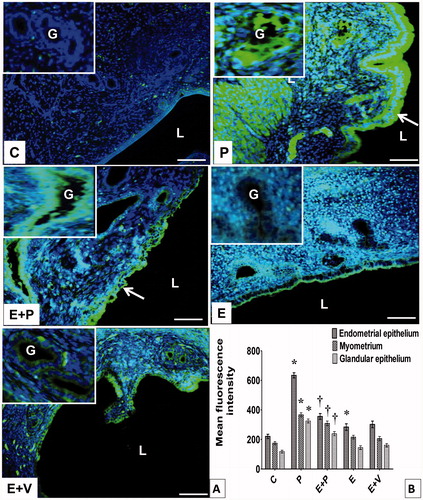
Figure 7. Distribution and expression levels of CAXIII in uterus. (A) CAXIII was distributed in different uterine compartments. Arrow pointing towards CAXIII in endometrial epithelium. L: lumen, G: gland, Scale bar = 100 μM. (B) Levels of CAXIII protein in different uterine compartments. The highest fluorescence intensity for CAXIII was observed in the epithelia and myometrium of progesterone-treated rats. All data were expressed as mean ± SEM from four independent observations *p < 0.05 compared to C, †p < 0.05 compared to E + V. E: estrogen, P: progesterone, C: control, V: vehicle (control).
Discussion
To the best of our knowledge, this study is the first to comprehensively investigate the differential effects of sex-steroids on CAII, III, IX, XII, and XIII expression in the uterus. Expression of CAII, III, XII, and XIII were enhanced by progesterone while expression of CAIX was enhanced by estrogen. Under the influence of estrogen, expression of CaII, III, XII, and XIII mRNAs were down-regulated. We have shown that sex-steroids could also affect the distribution of these isoenzyme in the uterus. Under the influence of progesterone, high expression of CAII, III, XII, and XIII were observed in the cytosol and at the apical and basolateral membranes of uterine lumenal and glandular epithelia. These patterns indicate that they might be involved in mediating uterine fluid pH reduction, as has been reported under this condition [Gholami et al. Citation2013]. Meanwhile, under the influence of progesterone, high levels of CAII, III, XII, and XIII in the myometrium indicates that they might also be involved in mediating the possible reduction in myometrial pH. The significance of this effect was however unknown. In comparison, under the influence of estrogen, low levels of CAII, III, XII, and XIII and high levels of CAIX in the uterine lumenal and glandular epithelia and myometrium indicates that these changes could produce the effects opposite from those observed under the progesterone influence.
Our findings support the observations that sex-steroids regulate expression of uterine CA isoenzymes. This is consistent with the previous reports in rats in which progesterone was found to induce uterine CAXII expression in the uterine lumenal and glandular epithelia [Gholami et al. Citation2013]. In addition to this, we have also found that progesterone could increase the expression of other CA isoenzymes including CAII, CAIII, and XIII except CAIX, which was down regulated by progesterone. We have shown that estrogen down-regulates expression of CAII and CAXII isoenzymes in rats in which this effect was opposite from the effect observed in mice. In the latter species, He et al. [Citation2010] reported that uterine CAII and CAXII were enhanced by estrogen, however no comparison with progesterone was made. These could also be related to species differences. This is supported by the studies of others in guinea pigs and rabbits where, in rabbits, progesterone increases uterine CA activity, while in guinea pig activity of this enzyme was enhanced by estrogen [Hodgen and Falk Citation1971].
We have shown that under the influence of progesterone, high levels of CAII were observed at apical and basolateral membranes of the uterine lumenal and glandular epithelia as well as in the cytosol. These findings were consistent with the finding in immature mice uteri [Hynninen et al. Citation2004]. Apically located CAII could participate in the formation of a transport metabolon in which CA could interact with other membrane transport proteins such as chloride/bicarbonate exchanger (SLC26A6) [Sterling et al. Citation2001] and sodium hydrogen exchanger (NHE) [Li et al. Citation2002]. These interactions could help to enhance the transport of ions e.g., and H+ across the apical membrane. In the uterus, the interaction of CAII and SLC26A6 could help to enhance
secretion [Chinigarzadeh et al. Citation2014; He et al. Citation2010] whereas CAII and NHE interaction [Gholami et al. Citation2013] could help to enhance H+ secretion into the uterine lumen. Our findings have shown that under progesterone, CAIII was highly expressed in the epithelia lining the uterine lumen. Uterine CAIII could be involved in maintaining pH homeostasis. This isoenzyme has been shown to be essential in maintaining pH homeostasis of the extracellular fluid in the skeletal muscle [Shang et al. Citation2009]. Additionally, under the influence of progesterone, enhanced expression of CAIII in the uterine lumenal epithelia might help to acidify the uterine fluid pH.
In contrast, expression of CAIX in the uterus was found to be up-regulated by estrogen. However, this isoenzyme was down-regulated by progesterone. The significance of these effects was unclear. However, there was a possibility that the changes observed under estrogen could contribute towards the alkaline pH of uterine fluid. In tumor cells for example, CAIX participates in the intracellular transport, which help to prevent the excessive acidification of intracellular fluid during hypoxia [Sedlakova et al. Citation2013]. Thus, a similar function could be predicted in the uterus.
which is transported into the cells across the basolateral membrane will then be extruded into the lumen via the apical
transporter such as CFTR [Chinigarzadeh et al. Citation2014]. Down-regulation of CAIX by progesterone could contribute towards the reduction in intracellular
influx that could contribute towards an acidic uterine fluid.
In this study, the level of CAXII in the uterine lumenal and glandular epithelia were found higher under the influence of progesterone, consistent with the previous findings [Gholami et al. Citation2013]. Meanwhile, CAXII expression was also noted to be high under the influence of estrogen; however, at the level lower compared to under the influence of progesterone. The findings that estrogen increases CAXII expression were consistent with the findings in mice [He et al. Citation2010] in which CAXII expression was reported to increase following estrogen treatment and at estrus stage of the oestrous cycle. Under both estrogen and progesterone, transmembrane CAXII could be involved in catalyzing the conversion of H+ and into CO2 and H2O. Once synthesized within the lumen, CO2 and H2O would then diffuse into the cells and will be re-converted into H+ and
via the action of intracellular CAII. On one hand, under progesterone, higher transmembrane CAXII expression will enhance this reaction thus leading to a higher generation of H+ which will then be extruded into the lumen. This will contribute towards the reduction in uterine fluid pH. On the other hand, under the influence of estrogen, a lesser amount of CAXII was noted when compared to that of progesterone treatment. This could result in a lesser amount of H+ being generated, contributing towards higher pH. Factors that determine the amount of H+ or
extruded into the lumen were unknown, however this could be influenced by the formation of transport metabolon under different sex-steroid influence. In this study, we have shown that under the influence of progesterone, expression of CAXIII in the uterus was also elevated. CAXIII, which was expressed in the cytosol might participate in the intracellular hydration of CO2 [Di Fiore et al. Citation2009]. In view that as CAXIII shares similar characteristic to CAII [Lehtonen et al. Citation2004], therefore expression of CAXIII in the endometrium could result in the generation of higher intracellular H+ that was necessary for the acidification of uterine fluid.
Expression of CA isoenzymes in rats pretreated with estrogen was greater compared to non-estrogen pretreated rats. The reasons were unknown, however lower levels in estrogen-pretreated compared to non-estrogen pretreated uteri could help to prevent excessive changes in the pH of the uterine fluid. Under the influence of progesterone, CA isoenzymes were also expressed at a high level in the stroma and myometrium. Increased stromal expression suggests that they could participate in progesterone-induced decidualization [Ogle et al. Citation1998]. Alternatively, increased expression of CA isoenzymes in the myometrium suggests that they could participate in regulating the myometrial pH which might affect contractile activities. Our findings that progesterone enhances expression of uterine CAII, III, XII, and XIII were parallel with the reports that functional activity of CA was elevated under progesterone influence. By using an in-vivo perfusion model, Gholami et al. [Citation2013] showed that decreased uterine fluid pH in ovariectomised rats following progesterone treatment could be inhibited by an inhibitor of CA, acetazolamide. However, changes in the pH under estrogen influcence were not inhibited by acetazolamide indicating that CA activity is not present in the uterine lumen. Studies in immature female rats further indicated that short and long-term treatment with estradiol resulted in a marked decrease in uterine CA activities [Bialy and Pincus Citation1962].
In conclusion, differential expression of CA isoenzymes in the uterus could explain differences in uterine pH as observed under different sex-steroids. The findings from this study justify the important role of CA isoenzymes as a uterine pH determinant. The decrease in tissue and fluid pH of the uterus could facilitate the implantation by stimulating the influx of macrophages and to develop an inflammatory milieu surrounding the implantation site [Jaiswal et al. Citation2012]. Alternatively, under the influence of estrogen the observed increase in uterine tissue and fluid pH could facilitate events that precede implantation. These may include sperm transport and capacitation [Liu et al. Citation2012]. In view of the important role of CA, dysregulation of uterine isoenzyme expression could result in multiple adverse consequences on reproductive processes which could potentially contribute towards infertility.
Materials and Methods
Animal preparation
Three month-old adult female Sprague-Dawley (SD) rats, weighing 225 ± 10 g were housed in a well-ventilated environment (12 h lights: 12 h dark, temperature 24 ± 2°C; 5 - 6 animals per cage). Animals were given rat chow diet (Harlan Teklad Global Diet, Harlan, Germany) and tap water ad libitum. All procedures were approved by the Institutional Animal Care and Use Committee (IACUC), University of Malaya. Estradiol-17β (estrogen), progesterone, and peanut oil were purchased from Sigma Aldrich Co (St. Louis, MO, USA). Bilateral ovariectomy was performed under isoflurane anesthesia. Drug treatment was started at least twenty-one days after ovariectomy, intended to eliminate variation in estrogen and progesterone levels. Prior to starting the treatment, levels of sex-steroids were measured by enzyme-linked immunoassay (ELISA) and were found to be low. Animals were divided into five groups with 6 rats per group which received the following drugs via subcutaneous injection behind the neck scruff: Group 1: 3 d peanut oil (vehicle) - control (C); Group 2: 3 d progesterone (4 mg/kg/d) (P); Group 3: 3 d estradiol 17β (0.8 × 10⁻⁴ mg/kg/d) followed by 3 d progesterone (4 mg/kg/d) (E + P); Group 4: 3 d estradiol-17β (0.8 × 10⁻⁴ mg/kg/d) (E); and Group 5: 3 d estradiol-17β (0.8 × 10⁻⁴ mg/kg/d) followed by 3 d vehicle (peanut oil) (E + V). In this study, doses of estrogen and progesterone were chosen based on doses previously reported to affect expression and functional activity of CA in uterus [Gholami et al. Citation2013].
mRNA expression analyses by real-time PCR
Collected tissues were rinsed with 0.1% phosphate buffer and kept in RNALater solution (Ambion, Austin, TX, USA) prior to RNA extraction. Total RNAs were extracted from rat uteri by using RNeasy plus Mini Kit (Qiagen, Hilden, Germany). Purity and concentration of RNA were assessed by 260/280 UV absorption ratios (Gene Quant 1300, UK). RNA integrity was confirmed by running the sample on agarose gel. RNA was reversely transcribed into cDNA by using high capacity RNA-to-cDNA kit (Applied Biosystems, Foster City, CA, USA). One step Real Time PCR was performed to evaluate gene expression with application of TaqMan®RNA-to-CT 2-Step Kit. The amplified region of cDNA was probed with fluorescence-labelled probe. TaqMan probe has sensitivity of 100% and specificity of 96.67% [Tsai et al. Citation2012] and was capable of detecting as low as 5–10 molecules. The assay used was TaqMan®catalogue number: 4331182 (Applied Biosystems) which amplified 111 bp segment of CaII from the whole mRNA length of 1459 bp, 75 bp segment of CaIII from the whole mRNA length of 802 bp, 62 bp segment of CaIX from the whole mRNA length of 2073 bp, 123 bp segment of CaXII from the whole mRNA length of 1065 bp, and 76 bp segment of CaXIII from the whole mRNA length of 1982 bp. Gapdh and Hprt were used as a reference or as housekeeping genes as they were the most stably expressed in the endometrium [Lin et al. Citation2013]. Specificity of primer and probe ensures that expression of target DNA was specifically evaluated. Assay validation was performed in silico by using whole rat genome and in-vitro by using whole rat cDNA (Applied Biosystems). Validation ensured that specific sequences were detected.
The PCR amplification program included 15 min, 48°C reverse transcriptase (RT), 10 min, 95°C activation of ampliTaq gold DNA polymerase, denaturation at 95°C, 15 s, and annealing at 60°C for 1 min. Denaturation and annealing were performed for 40 cycles. Measurements were normalized using GenEx software (MultiD Analyses AB, Göteborg, Sweden) followed by Data Assist v3 (Applied Biosystems). The latter was used to calculate RNA fold changes. All experiments were carried out in triplicate. TaqMan® primers were obtained from pre-designed assays (Applied Biosystems). CaII, CaIII, CaIX, CaXII, and CaXIII assay IDs are Rn00570700_m1, Rn00695939_m1, Rn01764733_m1, Rn01418250_m1, and Rn01493656_g1, respectively while Gapdh and Hprt assay numbers are Rn0177576_g and Rn01527840_m1, respectively. Data were analyzed according to comparative Ct (2−ΔΔCt) method. The relative quantity of target in each sample was determined by comparing normalized quantity of target to average normalized quantity of references.
Protein expression analyses by Western blotting
Uterine tissues were snapped frozen in liquid nitrogen and were stored at −80°C prior to protein extraction. Following extraction of total protein with PRO-PREP solution (Intron Biotechnology Co., Seoul, South Korea), equal amount of protein (30 µg) from each tissue lysate was mixed with a loading dye. Protein was separated by SDS-PAGE 12% gel and transferred onto a polyvinylidenedifluoride (PVDF) membrane (Bio-Rad, Hercules, CA, USA), blocked with 5% BSA for 90 min at room temperature. After transfer, the membrane was cut along the protein standards lane and split into two blots. Next, the target protein primary antibody was applied to one blot and the loading control protein antibody was applied to the other. The membrane was exposed to goat polyclonal CAII and CAIII, rabbit polyclonal CAIX, CAXII, and CAXIII primary antibodies (Santa Cruz Biotechnology Inc., Santa Cruz, CA, USA: sc17244, sc50715, sc25600, sc25601 and sc67334, respectively). β-actin primary antibody (sc-130656; Santa Cruz Biotechnology Inc.) was used as loading control. Incubation was performed overnight at dilution of 1:100 in PBS containing 1% BSA and Tween-20. The blots were rinsed three times in PBS-T for 5 min each. In Western blot analyses, BLUeye protein ladder (FroggaBio Inc., Toronto, ON, Canada) was used which was a 3-color protein standard with 12 pre-stained proteins covering a wide range of molecular weights from 10 to 245 kDa. Proteins are covalently coupled with blue chromophore except for two reference bands when separated on SDS-PAGE (Tris-glycine buffer). The BLUeye prestained protein ladder is designed for approximating the size of the proteins.
Following primary antibody incubation, membranes were incubated with appropriate horseradish peroxidase (HRP) conjugated secondary antibodies (Santa Cruz Biotechnology Inc.) at a dilution of 1:2000, for 1 h and were subjected to Opti-4CN™ Substrate Kit (Bio-Rad) to visualize the protein bands. Photos of the blots were captured by gel documentation system and density of each band was determined by using Image J software (version 1.46j; National Institutes of Health, Bethesda, MD, USA). Ratio of target protein/β-actin was calculated and was considered as the expression levels of target proteins. The average ratio of each band was obtained from four different membranes representing four different animals with similar treatment. Pre-absorption test was carried out by using primary antiserum which substituted primary antibodies at a similar concentration to determine specificity of antibody binding. Reactions of secondary antibody with other proteins in the specimen were excluded by incubating specimens with antibody only. In these experiments, the results were negative (data not shown).
Immunofluorescence detection of protein distribution
The mid-portion of right uterine horns were fixed in 10% formalin overnight prior to processing and dehydrated through increasing concentrations of ethanol, cleared in chloroform and embedded in paraffin wax. Tissues were sectioned into 5 µm thickness, deparaffinised in xylene, and rehydrated in reducing concentrations of ethanol. Tri-EDTA buffer (10 mM Tris Base, 1 mM EDTA solution, 0.05% Tween 20, pH 9.0) was used for antigen retrieval. One percent H2O2 in methanol was used to neutralize the endogenous peroxidase. Sections were blocked in appropriate 10% normal serum (Santa Cruz Biotechnology Inc.) prior to incubation with CAII, CAIII, CAIX, CAXII, and CAXIII primary antibodies (Santa Cruz Biotechnology Inc.) as above at a dilution of 1:100 in PBS with 1.5% normal blocking serum at room temperature for 1 h. After three times rinsing with PBS, sections were incubated with appropriate IgG-fluorochrome-conjugated secondary antibody (Santa Cruz Biotechnology) at a dilution of 1:250 in PBS with 1.5% normal blocking serum at room temperature for 45 min. The slides were rinsed three times with PBS, counterstained with DAPI to visualized the nuclei and were mounted with Ultracruz mounting medium (Santa Cruz Biotechnology Inc.). All images were viewed under a light microscope attached to an Nikon Eclipse 80i camera. Non-specific binding was excluded by conducting a pre-adsorption test and by incubating the slides with anti-serum. In these experiments, no non-specific signals were seen (data not shown).
Quantitative analyses of immunofluorescence signals in uterine luminal epithelia
The slides were viewed under a Nikon Eclipse 80i microscope (SEO Enterprises Inc, Lakeland, FL, USA) with an attached Nikon DS Ri1 12 megapixel camera (Nikon, Tokyo, Japan). Immunofluoresence images were captured under standard conditions of illumination. Voltage for illumination was chosen with photographs taken at a fixed exposure time. Tiff images (1280 × 1024 pixels) were taken at objective lens magnification of 40x. By using the NIS-Element AR program (Nikon Instruments Inc., Melville, NY, USA), exposure time and sensitivity were set prior to image capture. At the outset of the session, part of the slide with no tissue (blank field) was viewed under the microscope and auto white balance was performed. Area of interest was selected and intensity of fluorescence signals was estimated. The mean intensity of the signals represents average amount of protein expressed in tissues.
Statistical analyses
Statistical differences were evaluated by one way analysis of variance (ANOVA). p < 0.05 was considered significant. Post-hoc statistical power analysis was performed for all experiments and all values were >0.8 which were considered adequate. Shapiro-Wilk test was performed and all values were >0.05 which indicate data normality.
| Abbreviations | ||
| ANOVA | = | analysis of variance |
| CA | = | carbonic anhydrase |
| cDNA | = | complementary DNA |
| CFTR | = | cystic fibrosis transmembrane regulator |
| CO2 | = | carbon dioxide |
| DNA | = | deoxyribonucleic acid |
| H2O | = | water |
| H2O2 | = | hydrogen peroxide HCO3− bicarbonate |
| HRP | = | horseradish peroxidise |
| IACUC | = | Institutional Animal Care and Use Committee |
| mRNA | = | messenger RNA |
| NHE | = | sodium hydrogen exchanger |
| PBS | = | phosphate buffered saline |
| RNA | = | ribonucleic acid |
| RT | = | reverse transcriptase |
| SD | = | Sprague-Dawley |
| SLC26A6 | = | chloride/bicarbonate exchanger |
Declaration of interest
This study was funded by a PPP grant (PV069-2014A), University of Malaya, Kuala Lumpur, Malaysia. The authors report no conflicts of interest. The authors are responsible for the content and writing of the paper.
Author contribution
Designed the experiments: NS; Performed the experiments and analyzed the data: KK, NG; Wrote and approved the manuscript: NS and SM.
References
- Aliakbar, S., Brown, P.R., Jauniaux, E., Bidwell, D.E. and Nicolaides, K.H. (1990a) Measurement of carbonic anhydrase isoenzymes in early human placental tissues. Biochem Soc Trans 18:670
- Aliakbar, S., Brown, P.R. and Nicolaides, K.H. (1990b) Localization of CAI and CAII isoenzymes in normal term human placenta by immunofluorescence techniques. Placenta 11:35–39
- Aspatwar, A., Tolvanen, M.E., Ortutay, C. and Parkkila, S. (2014) Carbonic Anhydrase Related Proteins: Molecular Biology and Evolution. Subcell Biochem 75:135–156
- Berg, J.T., Ramanathan, S., Gabrielli, M.G. and Swenson, E.R. (2004) Carbonic anhydrase in mammalian vascular smooth muscle. J Histochem Cytochem 52:1101–1106
- Bialy, G. and Pincus, G. (1962) Effects of estrogen and progestin on the uterine carbonic anhydrase of immature rats. Endocrinology 70:781–785
- Chantler, E.N., Lo, K. and Elstein, M. (1977) Carbonic anhydrase activity in human cervical mucus and its response to various contraceptives regimes. Br J Obstet Gynaecol 84:705–707
- Chinigarzadeh, A., Kassim, N.M., Muniandy, S. and Salleh, N. (2014) Genistein-induced fluid accumulation in ovariectomised rats' uteri is associated with increased cystic fibrosis transmembrane regulator expression. Clinics 69:111–119
- Di Fiore, A., Monti, S.M., Hilvo, M., Parkkila, S., Romano, V., Scaloni, A., et al. (2009) Crystal structure of human carbonic anhydrase XIII and its complex with the inhibitor acetazolamide. Proteins 74:164–175
- Friedley, N.J. and Rosen, S. (1975) Carbonic anhydrase activity in the mammalian ovary, fallopian tube, and uterus: Histochemical and biochemical studies. Biol Reprod 12:293–304
- Ge, Z.H. and Spicer, S.S. (1988) Immunocytochemistry of ion transport mediators in the genital tract of female rodents. Biol Reprod 38:439–452
- Gholami, K., Muniandy, S. and Salleh, N. (2013) In-Vivo Functional Study on the Involvement of CFTR, SLC26A6, NHE-1 and CA Isoenzymes II and XII in Uterine Fluid pH, Volume and Electrolyte Regulation in Rats under Different Sex-Steroid Influence. Int J Med Sci 10:1121–1134
- He, Q., Chen, H., Wong, C.H.Y., Tsang, L.L. and Chan, H.C. (2010) Regulatory mechanism underlying cyclic changes in mouse uterine bicarbonate secretion: Role of estrogen. Reproduction 140:903–910
- Hodgen, G.D. and Falk, R.J. (1971) Estrogen and Progesterone Regulation of Carbonic Anhydrase Isoenzymes in Guinea Pig and Rabbit Uterus. Endocrinology 89:859–864
- Hu, J. and Spencer, T.E. (2005) Carbonic anhydrase regulate endometrial gland development in the neonatal uterus. Biol Reprod 73:131–138
- Hynninen, P., Hamalainen, J., Pastorekova, S., Pastorek, J., Waheed, A., Sly, W., et al. (2004) Transmembrane carbonic anhydrase isozymes IX and XII in the female mouse reproductive organs. Reprod Biol Endocrinol 2:73. doi: 10.1186/1477-7827-2-73
- Ivanov, S., Liao, S.Y., Ivanova, A., Danilkovitch-Miagkova, A., Tarasova, N., Weirich, G., et al. (2001) Expression of hypoxia-inducible cell-surface transmembrane carbonic anhydrases in human cancer. Am J Pathol 158:905–919
- Jaiswal, M.K., Mallers, T.M., Larsen, B., Kwak-Kim, J., Chaouat, G., Gilman-Sachs, A., et al. (2012) V-ATPase upregulation during early pregnancy: A possible link to establishment of an inflammatory response during preimplantation period of pregnancy. Reproduction 143:713–725
- Karhumaa, P., Parkkila, S., Türeci, Ö., Waheed, A., Grubb, J., Shah, G., et al. (2000) Identification of carbonic anhydrase XII as the membrane isozyme expressed in the normal human endometrial epithelium. Mol Hum Reprod 6:68–74
- Kaufmann, P., Mühlhauser, J., Crescimanno, C., Castellucci, M., Rajaniemi, H., Parkkila, S., et al. (1994) Immunohistochemistry of carbonic anhydrase in human placenta and fetal membranes. Histochemistry 101:91–98
- Kivelä, J., Parkkila, S., Parkkila, A.K., Leinonen, J. and Rajaniemi, H. (1999) Salivary carbonic anhydrase isoenzyme VI. J Physiol 520:315–320
- Lehtonen, J.M., Parkkila, S., Vullo, D., Casini, A., Scozzafava, A. and Supuran, C.T. (2004) Carbonic anhydrase inhibitors. Inhibition of cytosolic isozyme XIII with aromatic and heterocyclic sulfonamides: A novel target for the drug design. Bioorg Med Chem Lett 14:3757–3762
- Li, X., Alvarez, B., Casey, J.R., Reithmeier, R.A.F. and Fliegel, L. (2002) Carbonic Anhydrase II Binds to and Enhances Activity of the Na+/H+ Exchanger. J Biol Chem 277:36085–36091
- Lin, P., Lan, X., Chen, F., Yang, Y., Jin, Y. and Wang, A. (2013) Reference gene selection for real-time quantitative PCR analysis of the mouse uterus in the peri-implantation period. PLoS One 8:e62462
- Liu, Y., Wang, D.K. and Chen, L.M. (2012) The Physiology of Bicarbonate Transporters in Mammalian Reproduction. Biol Reprod 86:99
- Lutwak-Mann, C. (1955) Carbonic anhydrase in the female reproductive tract, occurrence, disturbution and hormonal dependence. J Endocrin 13:26–38
- Maren, T.H. (1967) Carbonic anhydrase in the animal kingdom. Fed Proc 26:1097–1103
- Nicholls, R.A. and Board, J.A. (1967) Carbonic anhydrase concentration in endometrium after oral progestins. Am J Obstet Gynecol 99:829–832
- Nishita, T., Kinoshita, C., Maegaki, M. and Asari, M. (1990) Immunohistochemical studies of the carbonic anhydrase isozymes in the bovine placenta. Placenta 11:329–336
- Ogle, T.F., George, P. and Dai, D. (1998) Progesterone and estrogen regulation of rat decidual cell expression of proliferating cell nuclear antigen. Biol Reprod 59:444–450
- Pincus, G. and Bialy, G. (1963) Carbonic anhydrase in the steroid responsive tissues. Recent Prog Horm Res 19:201–250
- Rosen, O., Suarez, C., Schuster, V.L. and Brion, L.P. (2001) Expression of carbonic anhydrase IV in mouse placenta. Am J Physiol Regul Integr Comp Physiol 280:R365–375
- Sedlakova, O., Svastova, E., Takacova, M., Kopacek, J., Pastorek, J. and Pastorekova, S. (2013) Carbonic anhydrase IX, a hypoxia-induced catalytic component of the pH regulating machinery in tumors. Front Physiol 4:400. doi: 10.3389/fphys.2013.00400
- Shang, X., Chen, S., Ren, H., Li, Y. and Huang, H. (2009) Carbonic anhydrase III: The new hope for the elimination of exercise-induced muscle fatigue. Med Hypotheses 72:427–429
- Sterling, D., Reithmeier, R.A.F. and Casey, J.R. (2001) A transport metabolon: Functional interaction of carbonic anhydrase II and chloride/bicarbonate exchangers. J Biol Chem 276:47886–47894
- Sun-Wada, G.H., Murata, Y., Yamamoto, A., Kanazawa, H., Wada, Y. and Futai, M. (2000) Acidic endomembrane organelles are required for mouse postimplantation development. Dev Biol 228:315–325
- Tsai, Y.L., Wang, H.T., Chang, H.F., Tsai, C.F., Lin, C.K., Teng, P.H., et al. (2012) Development of TaqMan probe-based insulated isothermal PCR (iiPCR) for sensitive and specific on-site pathogen detection. PLoS One 7:e45278
- Zhu, X. and Sly, W. (1990) Carbonic anhydrase IV from human lung. Purification, characterization, and comparison with membrane carbonic anhydrase from human kidney. J Biol Chem 265:8795–8801