
 ?Mathematical formulae have been encoded as MathML and are displayed in this HTML version using MathJax in order to improve their display. Uncheck the box to turn MathJax off. This feature requires Javascript. Click on a formula to zoom.
Abstract
Aimml: The aim of this project was to synthesize and characterize gold nanoparticles (GNPs) to trace the sequence of the hnRNPB1as a lung cancer biomarker. Methods: In the synthesis of GNPs with characteristics appropriate for conjugation, the size, morphology, and shape of the synthesized GNPs were determined by using spectrophotometry and transmission electron microscopy (TEM), followed by designing a probe for hnRNPB1biomarker with characteristics suitable for conjugation. Next, the GNPs were functionalized with a single-stranded DNA probe that was specific for the biomarker, for the characterization and confirmation of the conjugation process. Finally, for determination of minimum level of detection in solution including DNA target and probe aggregation, the changes in the absorption spectra of the samples in the range of 250–750 nm were determined using the NanoDrop ND 1000 spectrophotometer. Results: The surface of GNPs can be modified by utilizing ligands to selectively attach biomarkers. Thiol-bonding of DNA and chemical functionalization of GNPs are the most common approaches. Colloidal gold was synthesized with the citrate reduction method, as described by Turkevich et al. in 1951. In this study, the probe for hnRNPB1 was designed with a thiol crosslinker. Every set of conjugated GNPs was complementary to one end of the hnRNPB1 biomarker, and the probes were aligned in a tail to tail fashion onto the target. Conclusion: Uniform GNPs were synthesized by the citrate reduction technique, and the outcomes of trials with variation in factors (shape and size of the nanoparticles, gold concentration, and conjugation between GNP and probes) were investigated. The gold nanoprobe-based technique is better than the PCR-based techniques, because there are no requirements of enzymatic amplification and gel electrophoresis, and the evaluation can be done using small amounts of sample.
Keywords::
Introduction
Lung cancer is the most widespread lethal disease worldwide and is the fifth on the list of leading causes of tumor in Iran, and though this rate is very low, its incidence in both men and women has been rising progressively through the recent years (CitationZhou et al. 1996, CitationGoldstraw et al. 2007). Despite improvements in the treatment, the prognosis remains poor, with an estimated 5-year survival rate of 10–15% for all stages. A biomarker is a biological molecule that originates in blood, other body fluids, or in tissues, and signals a normal or unusual process, or a state of disease. It may also be used to see how well the body responds to treatment for a disease or situation. The use of biomarkers spans a broad range of conditions affecting human health, and they are increasingly used in the management of cancer patients. A biomarker functions as a measurable meter of the severity or existence of some disease conditions (CitationMorel et al. 2004). It can be a material that is injected into an organism as a means to survey organ function or other aspects of health (CitationSoskolne 1997).
Heterogeneous nuclear ribonucleoprotein (hnRNP B1) is a member of the hnRNP family (CitationSato et al. 2008). The hnRNPs are a complex group of RNA-binding proteins that play a key role in mRNA processing and telomere biogenesis (CitationKim et al. 2003). HnRNPB1overexpression has been described in many cancers, including the liver, pancreas, and breast cancer cell lines. Overexpression of hnRNPB1 in exfoliated bronchial epithelial cells of archival sputum samples is correlated with eventual development of lung cancer. Nanotechnology offers unique approaches to probe and control a variety of biological and medical processes that occur, at nanometer ranges, and is anticipated to have a novel impact on biology and medicine (CitationDaraee et al. 2014a, Citation2014b, CitationEatemadi et al. 2014a, Citation2014b, CitationMellatyar et al. 2014, CitationSeidi et al. 2014). Nanoparticles are the simplest form of structures with sizes in the nanometer (nm) range. There are special methods in diagnostics using gold nanoparticles (GNPs) (CitationAli et al. 2014), such as (A) use of the color change in GNPs, as an indication of aggregation, (B) use of GNPs as a core/seed that can be modified in nanoprobes for diagnosis, and (C) exploitation of GNPs in electrochemical-based metal deposition for improved indicators, and the detection of single-stranded oligonucleotide targets by two different gold-nanoprobes such that each has been functionalized with a DNA-oligonucleotide matching one half of the given target. The use of thiol-linked ssDNA-customized GNPs for the colorimetric detection of gene targets represents a low-cost and easy method to follow, different from fluorescence or radioactivity-based analyses (CitationBaptista et al. 2008). This technique was designed for clinical laboratories using oligonucleotide probes conjugated to GNPs (CitationHuang et al. 2007), to avoid fluorescence, radioactivity, or target amplification (such as PCR), and makes use of an easy and fast hybridization-based approach for the diagnosis of biomarker (CitationDan’ko et al. 2014).
A GNP solution can be prepared by the reduction of AuCl4 with sodium citrate. The maximum absorption wavelength of the GNP solution is 520 nm in the non-aggregate form, and upon aggregation, the wavelength of maximum absorbance (λmax) shifts toward larger wavelengths (CitationShawky et al. 2010). Next, the change of color to deep red indicates the formation of GNPs (CitationJiang et al. 2013). The size and shape of the nanoparticles can be evaluated by transmission electron microscopy (TEM). To do this, the desired GNPs probes with specific ratios are incubated in the dark (about 20 to 48 h). Then, the resulting solution is centrifuged at high speed, at 4°C. The supernatant containing nanoparticle-conjugated oligonucleotides is not discarded, and the precipitate obtained is dissolved in a suitable buffer. The centrifugation is repeated several times and the final pellet is stored away from light at 4°C until use. Oligonucleotides are obtained to ensure that nanoprobes are conjugated, connected using dithiothreitol (DTT), as the reducing substances released from the nanoparticles are centrifuged and the concentration of free oligonucleotides are evaluated by UV spectrophotometer (CitationLasagna-Reeves et al. 2010). Finally, conjugated nanoparticle probes that can specifically target sequences are identified by the oligonucleotides they are incubated with, in the sample containing the biomarker sequences. If the resulting nanoparticles are not aggregated, the color remains constant; in the absence of biomarker sequences in the sample, the concentration of nanoparticles and their accumulation will cause discoloration. The color change or the lack of it can be analyzed using quantitative spectrophotometric techniques, and the presence of the target sequence can be determined this way (CitationMonteiro et al. 2009). The present study is focused on the effect of the detection of hnRNPB1 sequence by GNPs as a lung cancer biomarker.
Experimental section
Materials
The following chemicals were of systematic grade and were purchased from Sigma-Aldrich: tetrachloroauric acid (HAuCl4.3H2O), trisodium citrate dehydrate, NaOH, HCl, and NaCl; DTT was supplied by Merck, Germany; MgCl2 was purchased from Sigma-Aldrich; TCEP [tris(2-carboxyethyl)-phosphine],10 mM pH 8 phosphate buffer AGEI buffer [10 mM phosphate buffer (pH 8), 0.01% (w/v) SDS (Merck, Germany)]; AGEII buffer [10 mM phosphate buffer (pH 8), 0.3 M NaCl, 0.01% (w/v) SDS], saline phosphate buffer [0.1 M NaCl, 10 mM phosphate buffer (pH 8)], and oligonucleotides were obtained from Bioneer, South Korea. The water used for all reactions and preparation procedures were of Milli-Q quality (R > 18 MΩ cm), and was obtained by filtering using Millipore cartridges. All glassware used in these procedures were carefully cleaned three times in aqua regia (3 parts HCl: 1 part HNO3), cleaned with ultra-high clarity water (resistivity 18.2 MΩ·cm), and air-dried.
Apparatus
The instruments used included a sonicator SKL-950 W ultrasonic homogenizer (Ningbo Haishu Sklon Electronic Instrument Co. LTD, China), a NanoDrop-ND 1000 spectrophotometer (Thermo Fisher Scientific, USA), and a UV–visible spectrophotometer (BioAquarius, model CE7250, CECIL Co. UK), to determine the absorbance of GNPs in the presence and absence of the goal analyte; a Tunneling Electron Microscope (Philips EM 208, Phillips, USA), and Digimizer software version 4 (MedCalc Software, Belgium) were used to determine the size of the particles. Additional and ultrapure water (18 MΏ water) was set by using a deionizer model R.101.D, from Absaz Co, Iran. outlines these sequences of DNA probes and DNA targets for conjugation.
Table I. Sequences of hnRNPB1 probe, blank, and target.
Synthesis and classification of GNPs
GNPs were prepared by citrate reduction of HAuCl4.3H2O, according to the following procedure, based on the Turkevich method (CitationOjea-Jiménez et al. 2010). The required volume of an aqueous solution of HAuCl4.3H2O was heated to boiling point while stirring vigorously with a magnetite stirrer at 900 rpm, to which 15 mL of reducing agent (trisodium citrate) was injected. Heating was continued until the color of the solution changed from colorless to pink/red, assuring the completion of the reaction, and the solution was finally allowed to cool to room temperature (CitationMikhlin et al. 2011). All glassware was cleaned with aqua regia; the prepared GNPs were verified by salt-induced aggregation, and 5 M NaCl was added to the above solution. After 1 min, by measuring absorbance in the range of 300–800 nm, the difference between the localized surface plasmon resonance (LSPR) spectra of the original sample and that of the sample which aggregated was considered, and change in the color was checked (CitationMi et al. 2014).
The study of synthesized GNPs was carried out on the film-coated drop of nanoparticles, by TEM. The GNPs appeared as darker spots, while the rest of image, corresponding to the carbon grid used as a surface on which the nanoparticles were placed, appeared brighter, because of the lower electron density of the carbon. The pictures were taken with 90 Kv or 100 Kv power (http://www.digimizer.com/index.php).
Visible spectrometry at a wavelength of 530 nm was done to verify the concentration of GNPs, which was explained by the calibration curve gained from the prominent concentration of GNPs of particle sizes ranging between 10 and 20 nm.
Design of probe and target sequences
The probe sequence was designed based on the hnRNPB1 gene region that shares structural homology with the hnRNP family. An18-base oligonucleotide was generated as probe sequence using the NCBI BLAST nucleotide search tool (CitationMcGinnis and Madden 2004). Care was taken in designing the sequence so that it did not share any sequence homology with non-hnRNP family members. In addition, the melting temperature of the probes was ensured to be within a narrow range. Most of the sequence was confirmed for potential self-complementarities, and the formation of secondary structures was also verified using the mfold software (CitationLi et al. 2012), which may have otherwise hindered the assay. It contained a thiol modifier at the 5’ end to enable conjugation with the colloidal GNPs. Alongside the target, a non-appropriate target was selected to serve as negative control during the detection reaction, and a non-appropriate mRNA sequence of human beta-actin was used in a related method.
Preparation of gold nanoprobes
The gold nanoparticle probe (GNP-probe) technique is a unique and elegant method for sensitive and specific detection and quantification of hnRNP using GNP enhancement (CitationHill and Mirkin 2006). The method does not require expensive equipment or an advanced read-out system, and can be performed in any standard laboratory (CitationReynolds et al. 2000).
Fresh solution of 1 ml of 0.1 M DTT solution in the disulfide cleavage buffer was prepared, after 15 min.
In the first step, by using 1 μl of 17 mM TCEP [tris (2-carboxyethyl) phosphine] at a molar ratio of 10:0.5, 8 μl (0.6 nmol) of thiolated probes were reduced for 2 h at room temperature while shaking at 120 rpm. Then, 2.52 μl of AGEI buffer was added to obtain the solution, sonicated for 10 s and incubated at room temperature (RT) for 20 min while shaking at 70 rpm.
Next, 17.3 μl of AGEII buffer was added to the prepared solution and the volume gradually increased to 25.17 μl by a dropwise addition of the buffer, sonicated for 10 s, and incubated overnight at RT for 20 min while shaking at 70 rpm. Next, the prepared solution was transferred to an RNase/DNase-free 1.5 ml microtube and was centrifuged for 20 min at 16 000 g, and the final supernatant was removed. In this step, a red, oily pellet was obtained and was washed twice by adding 1 ml of phosphate buffer (pH 8), and was centrifuged for 20 min at 16 000 g, and the supernatant was removed. The next step of washing consisted of the application of 1 ml of PBS, and was followed by transfer to the glass container.
The concentration of the prepared nanoprobe was verified by visible spectrometry using the Beer-Lambert law (CitationLasagna-Reeves et al. 2010), and the prepared pellet was stored at 4°C in a dark atmosphere until use. The resistance test is a method of salt-induced aggregation to confirm conjugation of the probes with AuNPs, for which 5 μl of nanoprobes (1.7 nM) were blended with 1 μl of 5 mM MgCl2 and incubated for 10 min at RT. Simultaneously, the test was applied for the non-conjugated GNPs. For further confirmation of conjugation and quantification, 5 μl of nanoprobe was mixed with 5 μl of 10 mM DTT. The mixture was incubated for 48 h at RT while shaking at 120 rpm, and then centrifuged at 16 000 g for 30 min. Finally, for further confirmation, the NanoDrop ND 1000 spectrophotometer was used, in the range of 250–750 nm (CitationTaton 2002).
Sensing of Target
At first, the lowest concentration of MgCl2 that was needed for full aggregation of the prepared nanoprobes was verified. In brief, 2.5 μl of nanoprobe was incubated for 10 min at 65°C, 10 min at 55°C, and 20 min at 25° C. Next, different concentrations of MgCl2 (0–100 mM) were added and the blend was incubated for 15 min at 25°C. At last, the absorption of the reactions was recorded by the NanoDrop-ND1000 spectrophotometer in the 250 nm to 750 nm spectral series. The first concentration of the MgCl2 that caused OD594nm/OD530nm > 1, corresponding to complete aggregation, was selected for utilization in the procedure. Next, 1.25 μl of nanoprobe was mixed with different concentrations of target (150, 300, 450, 600, 750, and 900 fmol/μl) for detection of hnRNP RNA, and incubated for 10 min at 65°C, 10 min at 55°C, and 20 min at 25°C.
Next, 43 mM MgCl2 was added to the above solution and the mixture was made up to a whole amount of 5 μl, and was incubated for 15 min at 25°C. Finally, using a ND1000 spectrophotometer in the 250 nm to 750 nm spectral range, and the absorbance of solution was recorded. In all, over the trial, the negative control (nanoprobe plus 900 fmol/μl beta-actin), the blank (nanoprobe plus 43 mM MgCl2 and without target), and the dispersion (nanoprobe plus phosphate buffer) samples were studied.
Statistical analysis
The following formulas were used for calculation of the area under curve (AUC) for each reaction:
C = Summation of each area
B1 = Absorbance of the first wavelength
B2 = Absorbance of the second wavelength
A2 = The second wavelength
A2 = The first wavelength
Where data points on the x-axis under the curve are points in Column A and y-axis data points in Column B. B1 relate to the sample.
The following formula was used to calculate the limit of detection (LOD):
Results and discussion
Synthesis and classification of GNPs
GNPs were prepared by the citrate reduction method. After carrying out the procedure, 5 M NaCl was added to the prepared GNPs, and the color of the solution changed from deep red to blue. A positive result was indicated by change in color of the modified GNPs, from colorless to red, with the absorption peak at about 530 nm that could be observed visually. Another test, based on the formula A = 1.276C 0.067 was used for different concentrations of GNP in the absence of salt (). For the characterization of synthesized NPs, their main physicochemical properties were determined and analyzed. Of the properties which were measured are size, shape, and surface plasmon, as a result of which prepared GNPs were found to be homogenous nanoparticles with a mean diameter of 15–16 nm, when studied using the transmission electron microscope (TEM) ().
Figure 1. (a) UV–Vis spectrum of prepared GNPs before addition of 5 M NaCl, showing the absorption peak at 524 nm. (b) UV–Vis spectrum of prepared GNPs (insert), after addition of 5 M NaCl, showing absorption peak at 524 nm.
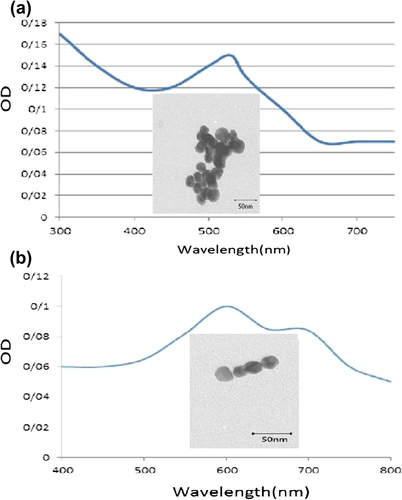
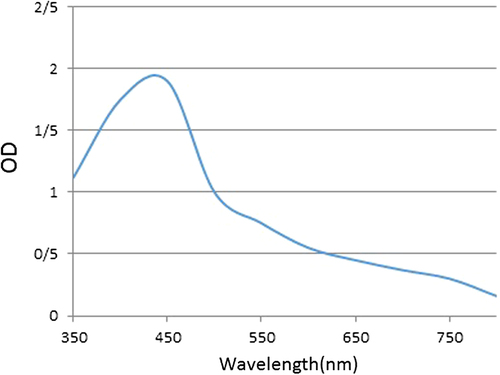
Figure 2. The UV–Vis spectrum of the prepared nanoprobes.
Designing of the sequences
The probe-preserved sequence was designed for hnRNPB1with a thiol linker to facilitate conjugation with colloidal GNPs, and a 10 polyA spacer. These thiol-modified probes were purchased from Takapozist (Iran) ().
Preparation of gold nanoprobes and verification of conjugation
First, thiolated DNA probes (1 ul) were added to the GNP solution in the presence of NaCl (0.02 M). This combination was shaken at 800 rpm overnight, to form nanoparticles conjugated with oligonucleotide probes that can specifically target sequences to identify the accurate sequence when incubated with the sample containing the sequence biomarker. If the sample includes the sequence of the biomarker of concentration, conjugated nanoparticles are joined to it and the bond can create a high negative charge around them so that in the next step, by adding salt, resistance occurs as an outcome of nanoparticle aggregation; if the GNPs are not closely aggregated, the color remains steady. In the absence of biomarker sequences in the sample, the increasing concentration of nanoparticles would cause coloration. This color change, or the lack of it, can be studied by a quantitative spectrophotometric analysis, and the presence of the target sequence can be determined by this technique. The concentration of prepared gold nanoprobes was 1.7 nM and the results of the localized surface plasmon resonance (LSPR) spectra of gold nanoprobes were similar to those of bare GNPs, as seen in the graphic plot (). After mixing of 5 mM MgCl2, the nanoprobes showed resistance to MgCl2-induced aggregation, compared with the bare GNPs.
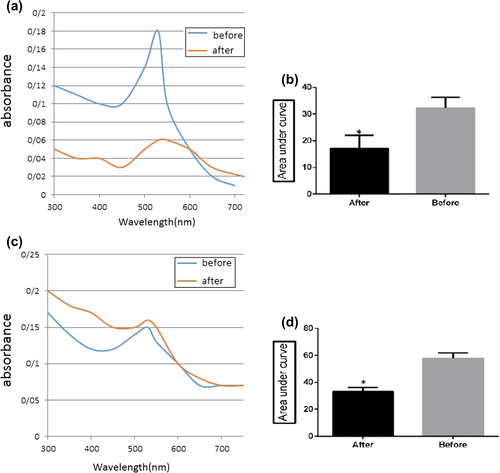
After adding 5 mM MgCl2, significant change in the absorbance spectrum of bare GNPs, in comparison with that of the nanoprobes, was seen, as shown in . Our results prove the successful conjugation of GNPs with thiolated probes (CitationVeigas et al. 2012).
Figure 3. (a) UV–Vis spectra of non-conjugated GNPs, against the aggregation spectra obtained before and after addition of MgCl2, for bare GNPs. (b) UV–Vis spectra of non-conjugated GNPs, against aggregation spectra obtained before and after addition of MgCl2 for bare GNPs. The area under curve (AUC) significantly decreases (*) after addition of MgCl2, in comparison with that before MgCl2 addition, for non-conjugated GNPs (P < 0.05). (c) UV–Vis spectra of conjugated GNPs against aggregation spectra obtained before and after addition of MgCl2, for conjugated GNPs. (d) AUC, UV–Vis spectra of conjugated GNPs, against aggregation spectra obtained before and after addition of MgCl2, for conjugated GNPs. The AUC significantly decreases (*) after addition of MgCl2, in comparison with that before MgCl2 addition, for conjugated GNPs (P < 0.05).
Detection of the target
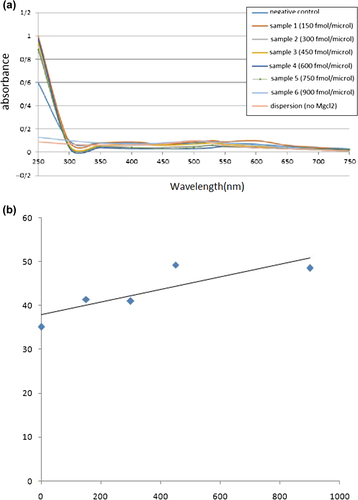
A quantity of 2.5 μl of DNA-functionalized GNPs probe solution was prepared with different concentrations of target DNA and incubated at different temperatures, then left at RT for 20 min for the hybridization process. In the negative control, percentage of dispersion of the negative control sample, with a concentration 900 fmol/μl, was 4% less than that of the least concentrated sample of the hnRNPB1 target. The results show that by increasing the concentration of the hnRNP target sequence, the percentage of dispersion rises, and LOD in the technique was equal to 300 fmol/μl of the synthetic hnRNP target, and this confirms the high sensitivity of the technique ().
Figure 4. (a) Detection of hnRNPB1 by the nanoprobe designed. UV–Vis spectra change with increase in the target concentration. (b) Detection of AUC of hnRNPB1 by the gold nanoprobe designed, at different concentrations of target.
Concluding remarks
Due to the high incidence of lung cancer and the majority of existing methods for the detection the disease having some major disadvantages, the use of newer techniques can provide the necessary reliability. The use of nanotechnology-based methods, especially the use of GNPs, can be a suitable method for the diagnosis of this disease, which is very significant because of the many benefits they offer, including cost reduction, speed, simplicity, and accuracy when compared with other molecular detection methods, which can be proven for future use. The results could lead to the development of technical knowledge that can be the basis for the design of diagnostic kits for lung cancer.
Acknowledgements
The authors thank the Department of Medical Nanotechnology, and the Biotechnology Faculty of Advanced Medical Science of Tabriz University, for all support provided.
Declaration of interest
The authors report no declarations of interest. The authors alone are responsible for the content and writing of the paper.
Related Research Data
References
- Ali MA, Eldin TAS, Moghazy GME, Tork IM, Omara II. 2014. Detection of E. coli O157: H7 in feed samples using gold nanoparticles sensor. Int J Curr Microbiol App Sci. 3:697–708.
- Baptista P, Pereira E, Eaton P, Doria G, Miranda A, Gomes IP, et al. 2008. Gold nanoparticles for the development of clinical diagnosis methods. Anal Bioanal Chem. 391:943–950.
- Dan’ko V, Michailovska K, Indutnyi I, Shepeliavyi P. 2014. Photoluminescence decay rate of silicon nanoparticles modified with gold nanoislands. Nanoscale Res Lett. 9:165.
- Daraee H, Eatemadi A, Abbasi E, Fekri Aval S, Kouhi M, Akbarzadeh A. 2014a. Application of gold nanoparticles in biomedical and drug delivery. Artif Cells Nanomed Biotechnol.1–13.
- Daraee H, Etemadi A, Kouhi M, Alimirzalu S, Akbarzadeh A. 2014b. Application of liposomes in medicine and drug delivery. Artif Cells Nanomed Biotechnol.1–11.
- Eatemadi A, Daraee H, Karimkhanloo H, Kouhi M, Zarghami N, Akbarzadeh A, et al. 2014a. Carbon nanotubes: properties, synthesis, purification, and medical applications. Nanoscale Res Lett. 9:1–13.
- Eatemadi A, Daraee H, Zarghami N, Melat Yar H, Akbarzadeh A. 2014b. Nanofiber: synthesis and biomedical applications. Artif Cells Nanomed Biotechnol.1–11.
- Goldstraw P, Crowley J, Chansky K, Giroux DJ, Groome PA, Rami-Porta R, et al. 2007. The IASLC lung cancer staging project: proposals for the revision of the TNM stage groupings in the forthcoming (seventh) edition of the TNM Classification of malignant tumours. J Thorac Oncol. 2:706–714.
- Hill HD, Mirkin CA. 2006. The bio-barcode assay for the detection of protein and nucleic acid targets using DTT-induced ligand exchange. Nat Protoc. 1:324–336. http://www.digimizer.com/index.php.
- Huang X, Jain PK, El-Sayed IH, El-Sayed MA. 2007. Gold nanoparticles: interesting optical properties and recent applications in cancer diagnostics and therapy. Nanomedicine (Lond). 2:681–693.
- Jiang S, Win KY, Liu S, Teng CP, Zheng Y, M- Han Y. 2013. Surface-functionalized nanoparticles for biosensing and imaging-guided therapeutics. Nanoscale. 5:3127–3148.
- Kim JH, Paek KY, Choi K, T- Kim D, Hahm B, Kim K-T, Jang SK. 2003. Heterogeneous nuclear ribonucleoprotein C modulates translation of c-myc mRNA in a cell cycle phase-dependent manner. Mol Cell Biol. 23:708–720.
- Lasagna-Reeves C, Gonzalez-Romero D, Barria MA, Olmedo I, Clos A, Sadagopa VM, et al. 2010. Bioaccumulation and toxicity of gold nanoparticles after repeated administration in mice. Biochem Biophys Res Commun. 393:649–655.
- Li Y, Zhang Z, Liu F, Vongsangnak W, Jing Q, Shen B. 2012. Performance comparison and evaluation of software tools for microRNA deep-sequencing data analysis. Nucleic Acids Res. 40:4298–4305.
- McGinnis S, Madden TL. 2004. BLAST: at the core of a powerful and diverse set of sequence analysis tools. Nucleic Acids Res. 32: W20–W25.
- Mellatyar H, Akbarzadeh A, Rahmati M, Ghalhar MG, Etemadi A, Nejati-Koshki K, et al. 2014. Comparison of inhibitory effect of 17-DMAG nanoparticles and free 17-DMAG in HSP90 gene expression in lung cancer. Asian Pac J Cancer Prev. 15:8693–8698.
- Mi H-Y, Li Z, Turng LS, Sun Y, Gong S. 2014. Silver nanowire/thermoplastic polyurethane elastomer nanocomposites: Thermal, mechanical, and dielectric properties. Mater Design. 56:398–404.
- Mikhlin Y, Karacharov A, Likhatski M, Podlipskaya T, Zubavichus Y, Veligzhanin A, Zaikovski V. 2011. Submicrometer intermediates in the citrate synthesis of gold nanoparticles: new insights into the nucleation and crystal growth mechanisms. J Colloid Interface Sci. 362:330–336.
- Monteiro DR, Gorup LF, Takamiya AS, Ruvollo-Filho AC, Camargo ERD, Barbosa DB. 2009. The growing importance of materials that prevent microbial adhesion: antimicrobial effect of medical devices containing silver. Int J Antimicrob Agents. 34:103–110.
- Morel NM, Holland JM, van der Greef J, Marple EW, Clish C, Loscalzo J, Naylor S. 2004. Primer on medical genomics Part XIV: introduction to systems biology—a new approach to understanding disease and treatment. Mayo Clin Proc. 79:651–658.
- Ojea-Jiménez I, Romero FM, Bastús NG, Puntes V. 2010. Small gold nanoparticles synthesized with sodium citrate and heavy water: insights into the reaction mechanism. J Phys Chem C. 114: 1800–1804.
- Reynolds RA, Mirkin CA, Letsinger RL. 2000. Homogeneous, nanoparticle-based quantitative colorimetric detection of oligonucleotides. J Am Chem Soc. 122:3795–3796.
- Sato A, Sueoka-Aragane N, Saitoh J, Komiya K, Hisatomi T, Tomimasu R, et al. 2008. Establishment of a new method, transcription–reverse transcription concerted reaction, for detection of plasma hnRNP B1 mRNA, a biomarker of lung cancer. J Cancer Res Clin Oncol. 134:1191–1197.
- Seidi K, Eatemadi A, Mansoori B, Jahanban-Esfahlan R, Farajzadeh D. 2014. Nanomagnet-Based detoxifying machine: an alternative/complementary approach in hiv therapy. J AIDS Clin Res. 5:2.
- Shawky SM, Bald D, Azzazy HME. 2010. Direct detection of unamplified hepatitis C virus RNA using unmodified gold nanoparticles. Clin Biochem. 43:1163–1168.
- Soskolne CL. 1997. Ethical, social, and legal issues surrounding studies of susceptible populations and individuals. Environ Health Perspect. 105:837.
- Taton TA. 2002. Preparation of gold nanoparticle–DNA conjugates. Curr Protoc Nucleic Acid Chem. 12–12.
- Veigas B, Doria G, Baptista PV. 2012. Nanodiagnostics for tuberculosis. In: Cardona P-J, Ed. Understanding Tuberculosis-Global Experiences and Innovative Approaches to the Diagnosis. InTech, pp. 257–276.
- Zhou J, Mulshine JL, Unsworth EJ, Scott FM, Avis IM, Vos MD, Treston AM. 1996. Purification and characterization of a protein that permits early detection of lung cancer Identification of heterogeneous nuclear ribonucleoprotein-A2/B1 as the antigen for monoclonal antibody 703D4. J Biol Chem. 271:10760–10766.