
 ?Mathematical formulae have been encoded as MathML and are displayed in this HTML version using MathJax in order to improve their display. Uncheck the box to turn MathJax off. This feature requires Javascript. Click on a formula to zoom.
Abstract
Objective: The obejctive of the present study was to investigate the potential use of floating spheroids of Atorvastatin Calcium (ATS) Loaded nanostructured lipid carriers (NLCs). Materials and Methods: The final formula of floating spheroids was optimized on the basis of shape (spherical), diameter (0.47 mm), lag time (20 s), and floating time (> 32 h). Results: The results were further confirmed by different pharmacokinetic parameters—it was observed that the developed optimized floating ATS spheroid-loaded NLCs formulation has significantly improved relative bioavailability, that is, 3.053-folds through oral route in comparison to marketed formulation.
Introduction
Hyperlipidemia is a general disorder of lipid metabolism marked by increased levels of total cholesterol and triglycerides. It is commonly characterized by an increased flow of free fatty acid, increased triglyceride, low-density lipoprotein-cholesterol (LDL-C), and apolipoprotein B levels, and abridged plasma high-density lipoprotein-cholesterol level (Kolovouet al. 2005), which is the key risk factor for atherosclerosis or cardiovascular diseases including coronary heart diseases and some other disorders and has been described as the most common cause of death in developed as well as developing countries (Reiner and Tedeschi-Reiner 2006, Simons 2002). An elevation in plasma lipid levels may be caused by a primary genetic defect or secondary to diet, drugs, or diseases. Hyperlipidemia can commonly be assigned to one of four main categories: inherited disorders of lipid metabolism, hypercholesterolemia caused by diet, diseases inducing secondary hyperlipidemia, and drug effects (Slack 1969). ATS (LIPITOR) is a member of the drug class known as “statins,” which is used for reducing cholesterol level. It is a competitive inhibitor of hydroxymethylglutaryl-coenzyme A (HMG-CoA) reductase, which is a rate-determining enzyme in cholesterol biosynthesis via the mevalonate pathway. ATS acts mainly in the liver, and decreased hepatic cholesterol levels increase hepatic uptake of cholesterol and reduce plasma cholesterol levels. ATS is rapidly absorbed after oral administration; maximum plasma concentrations occur within 1–2 h. The absolute bioavailability of ATS (parent drug) is approximately 14% and the systemic availability of HMG-CoA reductase inhibitory activity is approximately 30%. The low systemic availability is attributed to presystemic clearance in gastrointestinal mucosa and/or hepatic first-pass metabolism by the enzyme cytochrome P450-3A4 found in liver and intestine (Sharma et al. 2014). Even though food decreases the rate and extent of drug absorption by approximately 25% and 9%, respectively, as measured by Cmax and area under the curve (AUC), LDL-C reduction is similar irrespective of whether LIPITOR is given with or without food. Therefore, to overcome the problem of its low bioavailability, floating nanostructured lipid carriers (NLCs) loaded with ATS spheroids are developed in the present study. In several of the previously observed different approaches, the use of NPs has been considered to have great potential for the improvement of oral bioavailability of different drugs. Chen et al. developed NLCs made from mixtures of Precirol and squalene to examine whether the bioavailability of lovastatin can be enhanced by oral delivery. The principle of this study was to evaluate the possibility of using NLCs to enhance the oral absorption of lovastatin. Muchow et al. prepared NLC which has shown a superior ability to increase the bioavailability of testosterone undecanoate compared with the commercial product Andriol Testocaps®. Reducing the particle size led to higher AUC values. The total AUC with the best formulations was roughly two times higher compared with that of Andriol Testocaps® in non-fed state. Taking the reduced volume of the NLC particles compared with that of Andriol Testocaps® oil solution into account, administration of a single dose in one oral unit seems to be sufficient (Muchow et al. 2013). Beloqui et al. prepared NLCs as a tool to enhance the oral bioavailability of poorly soluble compounds using saquinavir (SQV), a Biopharmaceutics Classification System class IV drug and P-glycoprotein (P-gp) substrate as a model drug, and to study NLC transport mechanisms across the intestinal barrier. SQV transport across Caco-2 monolayers was increased up to 3.5-folds by NLCs compared with SQV suspension and these findings support the use of NLC approaches for oral delivery of poorly water-soluble P-gp substrates (Beloqui et al. 2013). The main aim of our study is to develop and evaluate floating NLCs loaded with ATS spheroids consisting of lipid cores as solid lipid stearic acid and liquid lipid oleic acid, using surfactant Tween 80. Furthermore, characterization of NLCs was carried out using several parameters such as particle size analysis, polydispersity index (PDI), percent entrapment efficiency (%EE), percentage drug loading (%), differential scanning calorimetry (DSC), and in vitro drug release study. Moreover, development of floating NLCs loaded ATS spheroids was carried out for enhancement of oral absorption of drug through stomach and characterization was carried out using shape and size, flow properties, friability, dissolution study (in vitro drug release studies), floating studies (in vitro buoyancy studies), and pharmacokinetic studies.
Materials and methods
Materials
Atorvastatin calcium as obtained from Ranbaxy Ltd., Gurgaon, India as gift. Stearic acid, oleic acid, and Tween 80 were purchased from Central Drug House (CDH). All other chemicals were procured form CDH and Loba Chemie.
Method of preparation of atorvastatin-loaded nanostructured lipid carriers
Lipid nanoparticles were produced by hot homogenization followed by ultrasonication method as reported by Chen et al. in 2010. The lipid and aqueous phases were prepared separately. The solid lipid/liquid lipid phase consisted of 10% (w/v) stearic acid and oleic acid at different ratios. The drug (atorvastatin calcium) was positioned in the lipid phase. Both phases were heated separately to 85°C for 10 min. The aqueous phase was added to the lipid phase and mixed using a high-shear homogenizer at 12,000 rpm for different time intervals. The mixture was further treated using a probe-type sonicator for different time intervals; subsequently, the dispersion was cooled to room temperature to solidify nanoparticles.
Characterizations of atorvastatin-loaded NLCs
Particle size, polydispersity index, and zeta potential measurement
Particle size, PDI, and zeta potential of atorvastatin calcium-loaded NLCs were measured by Zetasizer Delsa Nano C (Beckman coulter Delsa TM, UK).
Percent entrapment efficiency
EE was determined by measuring the concentration of free drug in aqueous medium as reported earlier (Manjunath and Venkateswarlu 2005). Lipid nanoparticles were taken in the centrifuged tube and centrifuged at 10,000 rpm for 20 min, and then the supernatant was measured for the unentrapped drug.
Differential scanning calorimetry
Thermal behaviors of NLCs were characterized using Pyris 6 DSC (Perkin-Elmer, USA). NLC dispersions were dried in desiccators for 24 h prior to DSC analysis. About 2 mg of air-dried NLCs sample was weighed into 40 L of aluminum sample pan. An empty sample pan was used as a reference. The heating run was performed from 35°C to 80°C with the heating rate of 5°C min − 1 by continuously flushing the nitrogen gas at the rate of 20mLmin− 1.
In vitro drug release study
In vitro drug release studies were performed by dialysis bag method (Yang and Zhu 2002) using shaking incubator at rotation speed of 100 rpm. Simulated gastric fluid (pH: 1.2) was used as dissolution medium. Each dialysis bag (pore size: 12 KD, Sigma Chemical Co., USA) was filled with 1 ml of nanoparticles. Volume and temperature of dissolution medium were 50 ml and 37 ± 0.2°C, respectively. At a predetermined time interval, samples (5 ml) were withdrawn, replaced with same volume of fresh media, and filtered and assayed for drug content at 246 nm against blank using UV–Visible spectrophotometer. Mean results of triplicate measurements and standard deviation (SD) were reported.
Method of preparations of floating spheroids
Floating spheroids were prepared by extrusion–spheronization process. The following steps were followed for the preparation of spheroids:
Granulation
NLCs loaded with atorvastatin calcium were blended with Avicel PH-101, polymers like HPMC-K4M and Carbopol 934, sodium bicarbonate, and citric acid. The batch size was 18 g with 20% (w/w) NLCs. The powders were dry mixed for 5 min. The mixture was wetted with purified water and granulated for 5 min (Goel and Aggarwal 2012).
Extrusion
The wet mass was extruded by an extrusion by means of a gravity-fed extruder. The wet mass was extruded by extrusion by means of a gravity-fed extruder. When wet mass was passed through the extruder, long cylindrical extrudates come out (Masciaa et al. 2006).
Spheronization
The extrudates were spheronized (at 800 rpm for 20–30 min) in a spheronizer using a die of size: 0.5 mm and friction plate (0.5 mm) with cross-hatched geometry. These long extrudes were firstly changed in small-size extrudes and then when these small extrudes come in contact with spheronizer plate and wall of spheronizer they change into uniformly sphere-shaped spheroids (Ghebre-Sellassie 1989, Sherrington and Oliver 1981).
Drying
Spheroids are commonly dried either using hot air ovens or fluid-bed driers. These two methods have been compared using dryer. Other drying methods include microwave drying (Bataille et al. 1993) and freeze drying (Kleinebudde and Knop 2007).
Characterization of floating atorvastatin calcium spheroids-loaded NLCs
Optimized formulation was characterized for various parameters like weight gain, size, shape, and flow properties: (angle of repose, Hausner's ratio, and Carr's index), porosity, friability, drug content, floating lag time, floating duration, and in vitro drug release.
Spheroid sphericity and shape analysis
The spheroid sphericity and shape of the spheroid were determined using an image analysis system. Photomicrographs of spheroids were taken with a Motic microscope. The captured images were analyzed using image analysis software. Around 50 spheroids were analyzed for every batch. Each individual spheroid was characterized by pellips (Podczeck et.al 1999, Koo and Heng 2001, Almeida-Prieto et.al 2007).
where P is the perimeter and dmax is the maximum diameter of the spheroid, calculated directly using image analysis software.
Friability
Friability was determined using a Roche-type friabilator. Ten grams of spheroids (Fs) was placed in an abrasion wheel at a rotational speed of 25 rpm for 4 min. Later, the fines were removed by sieving through a 250-μm mesh, and the fraction above 250-μm mesh (Fa) was used to calculate the friability of spheroids.
Flow properties
Angle of repose was calculated by allowing the formulation to flow through the funnel adjusted to a height of 6 cm from the surface. The diameter and height of the resultant pile were calculated and angle of repose was calculated according to the given formula:
where θ = angle of repose, h = height of the pile, and r = radius of the pile. Carr's compressibility index was determined by calculating bulk density and tapped density according to the formula:
The bulk density was determined by pouring weighed amount of spheroids into a graduated glass cylinder. The bulk density was calculated by dividing the weight by the occupied volume. The tapped density was determined using a tapped density tester in which the glass cylinder was tapped 1000 times (750 taps followed by 250 taps) (USP 2007a). All measurements were carried out in triplicate.
Porosity
Porosity of the powder is defined as “the ratios of the void volume to the bulk volume of the packing of particles and is expressed in percentage.”
where € = porosity, Vb = bulk volume, and Vp = true volume.
Floating studies (in vitro buoyancy studies)
In vitro floating lag time determination
This was performed in USP apparatus II with 900 ml of simulated gastric fluid (pH: 1.2) at 37 ± 0.05°C at a stirring rate of 50 rpm (n = 6). The time interval in the upper one-third of the dissolution vessels was measured for each of the spheroid formulation (Nowshad and Pathan 2013).
In vitro floating duration
The floating duration is defined as “the time period in which the spheroids constantly float on the surface of the medium.” The in vitro floating behavior of ATS spheroids-loaded NLCs formulation was carried out in USP apparatus II with 900 ml of simulated gastric fluid (pH: 1.2) at 37 ± 0.5° C at a stirring rate of 50 rpm (n = 6). The floating duration of ATS formulation was determined by visual observation.
In vitro drug release studies
In vitro release studies of floating ATS spheroids-loaded NLCs were carried out in USP type I dissolution apparatus, 900 ml of dissolution medium, that is, simulated gastric fluid at 37 ± 0.5°C and the rotating speed was 100 rpm. The dissolution samples withdrawn at 1, 2, 3, 4, 8, 16, 24, 32, and 48 h were analyzed by spectrophotometric method for ATS (Shishoo et al. 1999).
In vivo studies
Method development for determination of ATS in plasma: For the estimation of ATS in plasma, high-performance liquid chromatography (HPLC) method was developed. Blood samples were collected from the Wistar rats from the tail vein. Blood samples were immediately centrifuged (8000–10,000 rpm) for 10 min at an ambient temperature. After centrifugation, 0.2 ml of supernatant plasma was transferred into clean, fresh volumetric flask. 100mcg/ml solution was prepared and from this, that is, 0.8, 1.0, 1.2, 1.4, 1.6, and 1.8 ml was added, respectively, to obtain concentrations of 8, 10, 12, 14, 16, and 18mcg/ml. 0.2 ml each of the above dilution was added to the plasma samples and the volume was made up to 2 ml with methanol. The sample was analyzed in HPLC at λmax of 246 nm. Standard curve was plotted using the absorbance values to be used as standard for successive analysis of the sample.
Pharmacokinetics study of atorvastatin calciumml: The method described in previous section after performing HPLC was successfully applied to quantify plasma concentration of ATS in pharmacokinetics study.
Animal: Wistar rats of either sex (200 ± 20gm) were used to study pharmacokinetics of marketed formulation (MF) of ATS (control), atorvastatin-loaded NLCs (test), and floating ATS spheroids-loaded NLCs (test) after oral administration. Animals were procured from animal house of ISF College of Pharmacy, Moga, India and were housed under standard laboratory conditions with free access to food and water. The animals of both test and control groups were fasted overnight (∼14 h) and had free access to water throughout the experimental period. Experimental procedure was adopted according to the method reported earlier (Belhadj et al. 2013). Protocol for studies was approved by the Institutional Ethics Committee at ISF College of Pharmacy, Moga, India. The experiments were conducted as per the Committee for Prevention, Control and Supervision of Experimental Animals (approval no. ISFCP/IAEC/CPCSEA/Meeting No.8/2013-14/Protocol No.153) guidelines.
Experimental Protocol: Dose for the rats was calculated based on the surface area ratio of a rat to the human being. Animals were divided into four groups comprising six animals in each group (n = 6). All the animals of group I were given an oral dose of MF (Atorlip® tablets) of atorvastatin calcium; group II were given an oral dose of nanolipid carriers of ATS; and group III were given optimized batch of floating NLCs containing ATS spheroids at dose of 10 mg/kg orally () using a ball-tipped feeding needle (Jain et al. 2013). Blood samples (0.2 ml) were withdrawn at predetermined time intervals through the tail vein of rats in Vacutainer tubes, vortexed to mix the contents, and centrifuged at 5000 rpm for 20 min. The plasma was separated and stored at − 20°C until drug analysis was carried out.
Table I. Experimental protocol for in vivo studies.
Statistical analysis
All the data were run in triplicate for each sample. All data were expressed as mean SD for n = 3. Student's t-test analysis was done to assess the statistical significance of the data sets. A P’ value less than 0.05 was considered to indicate statistical significance for all comparisons.
Results and discussion
Formulation development and optimization of atorvastatin calcium NLCs
NLCs were prepared according to the procedure reported by Chen et al. in 2010 by hot homogenization followed by ultrasonication method and further, it was optimized on the basis of particle size and PDI of the nanoparticles. Process parameters included duration of homogenization; duration of ultrasonication; concentration of lipids, that is, stearic acid, oleic acid, and Tween 80 (as surfactant); and drug concentration.
Homogenization time
represents the effect of duration of homogenization on the particle size of ATS-loaded NLCs. Concentration of lipids and Tween 80 were fixed at 6:4 and 0.1%, respectively, and the effect of duration of homogenization treatment on particle size was investigated. Increasing the duration of homogenization led to reduction in particle size. The optimal value of duration of homogenization was selected as 8 min. However, beyond 8 min, slight increase in particle size was observed which might be because of agglomeration of NLCs.
Table II. Optimization of homogenization time, sonication time, and ratio of solid lipid:liquid lipid.
Ultrasonication time
represents the effect of duration of ultrasonication on the particle size of ATS NLCs. Time of homogenization was fixed at 8 min. Concentration of lipids and Tween 80 were fixed at 6:4 and 0.1%, respectively, and the effect of duration of ultrasonication treatment on particle size was investigated.
Reduction in particle size is mainly due to the development of cavitational forces in the homogenization gap, resulting in diminution of the lipid droplets to the nano size. This can be shown in the optimization process that increasing the duration of sonication for more than 4 min increased the particle size, thereby 3 min was selected as the optimized ultrasonication parameter.
Concentration of surfactant
represents the optimization of surfactant (stabilizer) concentration, using Tween 80, done on the basis of particle size and PDI. Duration of homogenization was fixed at 8 min, and ultrasonication time and lipid concentration was fixed at 3 min and 7:3, respectively.
An optimum concentration of stabilizer has to be selected because if concentration of the stabilizer is too low, it would lead to insufficient surface coverage, resulting in rapid crystal growth and agglomeration. High concentration of stabilizer can give enhanced viscosity of the solution. The primary role of the surfactant is stabilization of the nanoparticles in the colloidal state and prevention of particle size growth during storage. Therefore, surfactant concentration of 0.2% w/v was found to be optimized for NLCs formulation (NLC8). The choice of stabilizers is an important parameter to be considered in optimizing any nanoparticle formulation, not only to control the particle size and stabilization of the dispersions but also to control the crystallization and polymorphic transitions.
Concentration of lipid
represents the optimization of lipid concentration on the basis of particle size and PDI. Duration of homogenization was fixed at 8 min, and ultrasonication time and concentration of Tween 80 were fixed at 3 min and 0.2%, respectively. The lowest size was achieved with lipid concentration in the ratio of 7:3, further increasing lipid concentration above 7:3 resulted in an increase in particle size which might be due to unused lipids in the formulations which aggregate and increase the particle size.
Optimization of drug concentration
represents the optimization of drug concentration carried out on the basis of particle size, PDI, and EE. Duration of homogenization was fixed at 8 min, and ultrasonication time and concentration of lipids and Tween 80 were fixed at 3 min, 7:3, and 0.2%, respectively.
Table III. Optimization of amount of atorvastatin calcium with respect to lipids ratio.
It has been observed that the maximum amount of drug that can be incorporated in optimize NLCs formulation is 20 mg. Optimized NLC formulation (NLC13) has shown minimum particle size and PDI of 155.8 ± 1.8 and 0.066, respectively, with maximum EE of 58 ± 3.2%.
Characterization of optimized NLCs formulation particle size and distribution
Size and size distribution of optimized nanolipid carriers were determined by laser diffractometry using Beckman Coulter Delsa Nano C Particle Analyzer. The final formulation of NLC13 was optimized on the basis of particle size and PDI of 155.8 ± 1.8 and 0.066, respectively.
Entrapment efficiency
EE of atorvastatin-loaded nanolipid carriers using lipids (stearic acid and oleic acid) and surfactant (Tween 80) was estimated and repeated three times. All the formulations showed good reproducible results. EE of atorvastatin-loaded NLC13 was found to be 58 ± 3.2%.
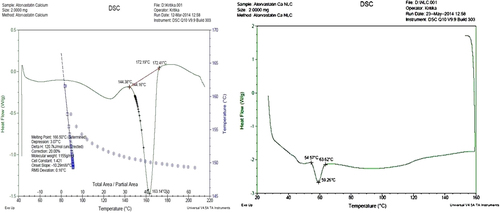
DSC Analysis of final optimized formulation (NLC13)
DSC thermograms of pure drug (atorvastatin calcium) and NLC13 are shown in and , respectively. The melting endotherm peak for pure drug was reported at 163.14°C and melting point was 166.50°C. The melting endotherm of the drug was completely absent in the thermograms of ATS-loaded NLCs, which indicates that ATS was completely solubilized inside the lipid matrix of the NLCs. Incorporation of ATS inside the lipid matrix results in an increase in the number of defects in the lipid crystal lattice, and hence causes a decrease in the melting point of the lipid in the final NLC formulations.
In vitro drug release
In vitro drug release profile of NLCs containing atorvastatin calcium in simulated gastric fluid (pH: 1.2) using dialysis bag is shown in . The release study of atorvastatin-loaded NLCs was repeated thrice to check the reproducibility. It showed a biphasic profile. In the initial stage (the first 8 h), drug release was comparatively faster followed by sustained release. Burst release is due to immediate dissolution of drug particles adsorbed on the surface of NLCs. About 50% of drug was released from NLCs within the first 12 h and the 55% drug was released for up to 24 h. Drug release followed Higuchi kinetics, indicating that the release was predominantly by diffusion. Increased diffusional distance due to the formation of drug depletion zone at particle surface and the presence on the surrounding lipid shell barrier might have slowed down the release rate resulting in sustained drug release profile ().
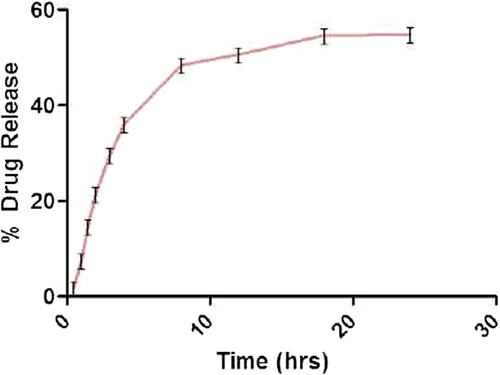
Table IV. Kinetics modeling of atorvastatin calcium NLC13.
Development and optimization of floating atorvastatin calcium spheroids-loaded NLCs
Floating spheroids were prepared according to the mentioned procedure and further, it was optimized on the basis of lag time, floating time, flow properties, friability, and percent drug release. Process parameters included extruder die size, spheronizer plate groove size, spheronization speed, and spheronization time.
Optimization of spheronization speed
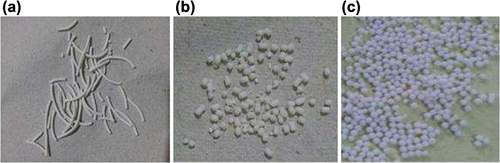
Using several spheronization speeds during preliminary tests revealed their major influence on pellet yield and sphericity. Using a lower spheronization speed led to dumbbell formation due to insufficient spheronization. Increasing the spheronization speed promoted formation of spherical pellets. However, further increase in speed produced low pellet yields due to excessive breaking of the extrudates ().
Table V. Influence of spheronization speed on the size and shape of floating atorvastatin calcium spheroids.
The diameter of the spheroid is slightly greater than that of the extrudate. This can be attributed to the fact that nucleation, coalescence, and layering mechanisms exist during the formation of spheroids from cylindrical extrudates, which results in slightly larger spheroids ().
Table VI. Influence of sizes of extruder die and spheronization plate on the properties of floating atorvastatin calcium spheroids.
Optimization of quantity of HPMC-K4M
HPMC-K4M is used as a matrix former in combination with Carbopol 934. The quantity of the polymer was optimized as given in .
Table VII. Optimization of HPMC-K4M with respect to lag floating time and floating time of spheroid.
Optimization of concentrations of carbopol, sodium bicarbonate, and citric acid
In the preparation of floating spheroids, optimized concentrations of Carbopol, sodium bicarbonate, and citric acid were found to be 400 mg, 2gm, and 2 gm as depicted in , , and respectively.
Table VIII. Optimization of Carbopol 934 with respect to lag floating time and floating time of spheroid.
Table IX. Optimization of concentration of sodium bicarbonate of spheroid.
Table X. Optimization of concentration of citric acid of spheroid.
Characterization of floating atorvastatin calcium spheroids-loaded NLCs
Characterization of floating atorvastatin calcium spheroids-loaded NLCs performed for various parameters is given in .
Table XI. Evaluation parameters for spheroids of atorvastatin calcium.
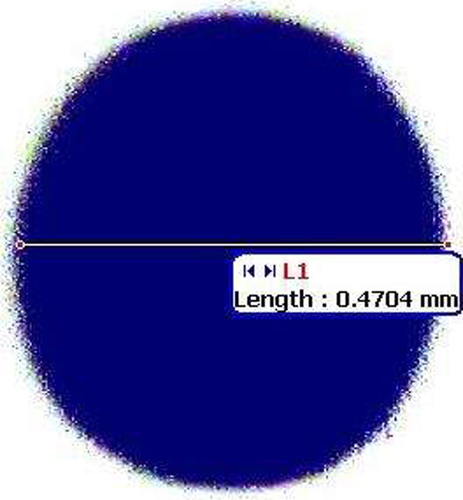
Shape
Shape of floating spheroid was found to be spherical when seen under Motic microscope. Spherical nature of spheroid was calculated by pellips (which is a characteristic of pellet shape). A pellet with pellips equal to 1.0 is considered spherical and good for pharmaceutical processing (, ).
Bulk density
Bulk density and tapped density were used for the calculation of Hausner's ratio and compressibility index. These help in determining the flow property and the compressibility of ingredients. A negligible variation of bulk density of spheroids was found to be 0.76 ± 0.64 g/cm3.
Tapped density
Negligible difference was experimentally observed in the tapped density and was found to be 0.84 ± 0.84 g/cm3.
Carr's index (%)
Results of compressibility study showed that the compressibility index of the spheroids had excellent flowability as the indices were < 10. Compressibility index was found to be 9.52 ± 0.35%, which shows excellent flow.
Hausner's ratio
According to USP 2000, spheroids with Hausner's ratio between 1.12 and 1.18 had good flow and those with Hausner's ratio above 1.35 showed poor flow property. The Hausner's ratios were found to be 1.10 ± 0.76—it was evident that the prepared spheroids had good flowability as the ratios were within the good flow range.
Angle of repose
Angle of repose of floating spheroids was found to be 26 ± 0.88 and according to the Indian Pharmacopoeia (I.P.) this is a very good value.
Friability
Friability of floating pellets was calculated and found to be 0.72 ± 0.21%, which was well within the acceptable limit as per I.P. 2007. The result of friability showed that the formulation had sufficient hardness for its safe shipment.
In vitro release studies
Drug release from the floating spheroids was studied using simulated gastric fluid for 48 h. 56.61 ± 1.2% release was seen in 32 h in simulated gastric fluid. It showed a biphasic profile. In the initial stage (the first 16 h), drug release was comparatively faster followed by sustained release. About 50% of drug was released from NLCs within the first 24 h and 57% of drug was released for up to 48 h (). Drug release followed Higuchi kinetics (), indicating that the release was predominantly by diffusion.
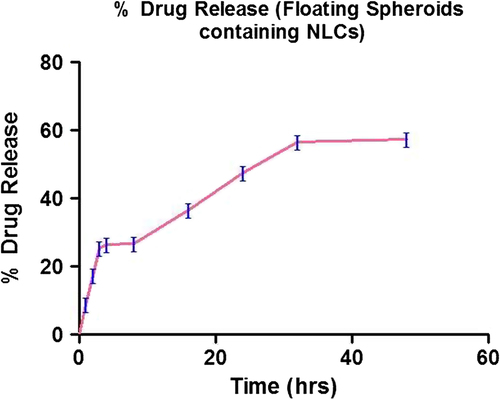
Table XII. In vitro release kinetic of floating atorvastatin calcium spheroids-loaded NLCs.
In vivo bioavailability and pharmacokinetic studies of test groups (atorvastatin NLCs and spheroids-loaded NLC) and control group (MF) were conducted in three groups of Wistar rats containing six animals in each group. Following oral dosage of sample, blood samples were collected at specified time points and concentration of atorvastatin calcium in plasma was determined by HPLC method. Results are tabulated as average plasma concentration of atorvastatin calcium (mcg/ml) for control and test groups along with SD given in . The values are plotted with plasma concentration versus time ().
Table XIII. Pharmacokinetic parameters of control and test sample calculated using plasma concentration–time data using software Kinetica.
The pharmacokinetic parameters were calculated by the software Kinetica (Version 5.0) using the data and are recorded in . The Cmax of atorvastatin marketed drug suspension was 48582 ± 2.37 ng/ml after 32.6 ± 3.47 h, whereas it was 53437 ± 2.68 ng/ml after 38.68 ± 3.51 for the floating atorvastatin calcium spheroids-loaded NLCs. The t1/2 of atorvastatin marketed drug suspension and the floating atorvastatin calcium spheroids-loaded NLCs was found to be 17.79 ± 3.57 and 29.36 ± 1.35 h, respectively. This might have been due to decrease in particle size of atorvastatin calcium (drug), and enhancement of diffusion of drug directly to the blood circulation helps to bypass its presystemic intestinal clearance which is the main cause for its low bioavailability. Thus, maximum drug concentration and prolonged drug concentration via oral route can be achieved by floating atorvastatin calcium spheroids-loaded NLCs in comparison to MF and atorvastatin calcium-loaded NLCs formulation. This clearly suggested that NLC-S is able to retain maximum drug concentration in blood and remain in the body for prolonged period of time. The relative bioavailability of the floating atorvastatin calcium spheroids-loaded NLCs formulation as compared with that of the marketed drug suspension was calculated using the mentioned formula:
where, AUC = Area under curve, F = Optimized Formulation, D = Dose (10mg/kg), d = Plain drung.
Relative bioavailability of floating atorvastatin calcium spheroids-loaded NLCs is 3.053-folds higher as compared with that of marketed drug suspension.
Conclusion
Among all the formulations, NLC13 was optimized on the basis of particle size (155.8 ± 1.9 nm), PDI (0.066), and %EE (58 ± 3.2%). Drug release of NLC13 formulation was found to be 54.76 ± 1.4% within 24 h. The final formula of floating spheroids was optimized on the basis of shape (spherical), diameter (0.47 mm), lag time (20 s), and floating time (> 32 h). Friability of spheroids was 0.72 ± 0.21% and drug release was found to 56.61 ± 1.2% within 32 h.
Absorption of drug will be enhanced by decrease in particle size (< 200 nm) and provide a lipid carrier for passive diffusion of drug through stomach. Floating drug delivery helps in retention of drug-loaded NLCs in stomach for long duration and assists in increasing the diffusion of drug through stomach for a long time and ultimately increasing bioavailability of drug by overcoming the problem of its low bioavailability, that is, presystemic intestinal clearance and first-pass metabolism.
Acknowledgement
Authors are thankful to Mr. Praveen Garg, Chairman, ISF College of Pharmacy, Moga, Punjab, for his continuous support and encouragement, and Ranbaxy Ltd. for providing atorbastatin calcium as gift.
Declaration of interest
The authors report no declarations of interest. The authors alone are responsible for the content and writing of the paper.
References
- Almeida-Prieto S, Blanco-Mendez J, Otero-Espinar FJ. 2007. Microscopic image analysis techniques for the morophological charterization of pharmaceutical particles: Influence of the software and the factor algorithms used in the shape factor estimation. Eur J Pham Biopharm. 67:766–776.
- Bataille B, Ligarski K, Jacob M, Thomas C, Duru C. 1993. Study of the influence of spheronization and drying conditions on the physico-mechanical properties of neutral spheroids containing Avicel PH-101 and lactose. Drug Dev Ind Pharm. 19:653–671.
- Belhadj Z, Zhang S, Zhang W, Junlin W. 2013. Formulation development and bioavailability evaluation of a Self-nanoemulsifying Drug Delivery System (SNEDDS) of Atorvastatin Calcium. Int J Pharmaceutics. 29:2051–5782.
- Beloqui A, Solinís MÁ, Gascón AR, del Pozo-Rodríguez A, des Rieux A, Préat V. 2013. Mechanism of transport of saquinavir-loaded nanostructured lipid carriers across the intestinal barrier. J Control Release. 166:115–123.
- Chen CC, Tsai TH, Huang ZR, Fang JY. 2010. Effects of lipophilic emulsifiers on the oral administration of lovastatin from nanostructured lipid carriers: physicochemical characterization and pharmacokinetics. Eur J Pharm Biopharm. 74:474–482.
- Ghebre-Sellassie. 1989. Pellets: A general overview. In: Ghebre-Sellassie I, Ed. Pharmaceutical Pelletization technology. New York, USA: Marcel Dekker Inc., 37: pp. 1–13.
- Goel A, Aggarwal S. 2012. Special emphasis given on spheronization: a review. IJIPLS. 2:76–87.
- Kleinebudde P, Knop K. 2007. Direct pelletization of pharmaceutical pellets in fluid-bed processes. In: Salman AD, Hounslow MJ, Seville JPK, Ed. Handbook of Powder Technology: Granulation, Vol. II. London: Elsevier, pp. 779–811.
- Kolovou G, Anagnostopoulou K, Cokkinos D. 2005. Pathophysiology of dyslipidemia in the metabolic syndrome. Postgrad Med J. 81:358–366.
- Koo OM, Heng PW. 2001. The influence of microcrystalline cellulose grade on shape and shape distributions of pellets produced by extrusion- spheronization. Chem Pharm Bull. 49:1383–1387.
- Manjunath K, Venkateswarlu V. 2005. Pharmacokinetics, tissue distribution and bioavailability of clozapine solid lipid nanoparticles after intravenous and intraduodenal administration. J Control Release. 107:215–228.
- Masciaa S, Patela MJ, Rougha SL, Martin PJ, Wilson DI. 2006. Liquid phase migration in the extrusion and squeezing of microcrystalline cellulose pastes. Eur J Pharma Sci. 29:22–34.
- McCrindle BW, Ose L, Marais AD. 2003. Efficacy and safety of atorvastatin in children and adolescents with familial hypercholesterolemia or severe hyperlipidemia: a multicenter, randomized, placebo-controlled trial. J Pediatr. 143:74–80.
- Muchow M, Maincent P, Muller RH, Keck CM. 2013. Testosterone undecanoate–increase of oral bioavailability by nanostructured lipid carriers (NLC). J Pharma Technol Drug Res. doi. https://doi.org/10.7243/2050-120X-2-4.
- Nowshad S, Pathan MSI. 2013. Preparation and Evaluation of Gastroretentive Floating Pellets of Metronidazole. Bangladesh Pharma J. 16:107–115.
- Podczeck F., Rahman, SR, Newton JM. 1999. Evaluation of a standardised procedure to assess the shape of pellets using image analysis. Int J Pharm. 192:123–138.
- Reiner Z, Tedeschi-Reiner E. 2006. Th-W47: 2 Atherosclerosis—A paradox of Eastern European countries. Atherosclerosis Supplements. 7:461.
- Sharma K, Kumar K, Mishra N. 2014. Nanoparticulate carrier systemml: a novel treatment approach for hyperlipidemia. Drug Deliv. 1–16. doi: https://doi.org/10.3109/10717544.2014.920937.
- Sherrington PJ, Oliver R. 1981. Compaction and other granulation methods. In: Granulation, London: Heyden. 81:141–152.
- Shishoo, CJ, Shah SA, Rathod IS, Savale SS, Vora MJ. 2001. Impaired bioavailability of rifampicin in presence of isoniazid from fixed dose combination (FDC) formulation. Int J Pharm. 228:53–67.
- Simons LA. 2002. Additive effect of plant sterol-ester margarine and cerivastatin in lowering low-density lipoprotein cholesterol in primary hypercholesterolemia. Am J Cardiol. 90:737–740.
- Slack J. 1969. Risks of ischaemic heart-disease in familial hyperlipoproteinaemic states. The Lancet. 294:1380–1382.
- Yang SC, Zhu JB. 2002. Preparation and characterization of camptothecin solid lipid nanoparticles. Drug Dev Ind Pharm. 28:265–74.