
 ?Mathematical formulae have been encoded as MathML and are displayed in this HTML version using MathJax in order to improve their display. Uncheck the box to turn MathJax off. This feature requires Javascript. Click on a formula to zoom.
Abstract
Although much research has been published on ways to overcome the low oral bioavailability of paclitaxel, exploration of novel drug delivery systems that can target paclitaxel deep in to the dermal areas in AIDS-related Kaposi sarcoma (KS) have not yet been reported. Our aim was to develop deformable nanovesicles of paclitaxel capable of being used in dermal chemotherapy, especially deep into the dermal areas of AIDS related KS. Deformable nanovesicular formulations (TS1–TS15) composed of soya lecithin and span80 were prepared by the rotary evaporation sonication method within the constraints of our Box–Behnken design. The formulations were subjected to vesicle characterization and ex vivo permeation. The optimized vesicular suspension was formulated as a gel and assessed for in vitro cytotoxicity and penetration characteristics by confocal laser scanning microscopy (CLSM). TS9 with vesicle size characteristics of 185.76 ± 2.15 nm, zeta potential of −23.2 mV, deformability index = 138.02 and cumulative drug permeation of 89.80 ± 1.84% was identified as the optimized formulation. TEM revealed spherical vesicles with firm boundaries that were stable at 4 °C. TS9 was developed as carbopol 934P gel (TG) and compared with the control gel (CG) made with the pure drug (paclitaxel). TG showed significantly higher (p < 0.05) in vitro drug permeation and flux compared to the CG. In vitro cytotoxicity study on KSY-1 cell lines revealed higher IC50 (≤17) for TS against IC50 ≤19 for TG. CLSM confirmed the penetrating potential of transfersomes via TG to the dermal layers of skin, the proposed target site. Conclusively, deformable nonovesicles of paclitaxel appear as a feasible alternative to the conventional formulations of paclitaxel in the management of AIDS-related KS.
Introduction
Paclitaxel (PTX), one of the established anticancer agents with broad spectrum efficacy against AIDS-related kaposi sarcoma (KS), acts by inhibiting antiapoptotic activity and downregulating the Bcl-2 proto-oncogene, a gene which is highly expressed in the spindle cells and the blood vessels in KS patients. Spindle cells mostly present in the advanced stage of the KS lesions represent the most prominent histopathological feature of the advanced nodular stage of KS (Raimundo and Asche Citation2011). Several phase II studies have proved the safety and efficacy of PTX against spindle cells in patients suffering with AIDS-related KS (Dittmer et al. Citation2012, Douglas et al. Citation2010). The intravenous infusion (Taxol®) for parenteral administration contains cremophore that has been reported to cause severe hypersensitivity reactions (Singla et al. Citation2002). Oral administration can be considered as an alternative to avoid the parenteral administration but co-administration of PTX with other drugs (dexamethasone, cyclosporine A and cisplatin) becomes mandatory to avoid side effects caused by PTX. Furthermore, orally administered PTX has a bioavailability of only 7% due to presystemic metabolism by the cytochrome enzymes CYP-3A4 and 2C8 and also due to intestinal efflux by the P-glycoprotein (Van Asperen et al. Citation1998).
Research efforts have been dedicated to produce a cremophore-free formulation as well as systems to overcome the low oral bioavailability of paclitaxel (Hennenfent and Govindan Citation2006, Luo et al. Citation2012, Oostendorp et al. Citation2011). A comprehensive review on various nanocarrier systems that offer the advantage of high degree of encapsulation and cellular uptake, escape from elimination by P-glycoprotein mediated efflux has been presented by Nehate et al. (Citation2014). But to date noninvasive system is yet to gain agency approval. A myriad of treatment modalities have been reported, but the appropriate treatment selection is based on individual clinical presentment of the disease. Being a vascular malignant disease, AIDS-related KS requires systemic therapy. But, to date all forms of systemic therapy have been hampered by either severe side effects of chemotherapy or the use of biologic response modifiers with low response rates. Although fully suppressive highly active antiretroviral therapy (HAART) is the first choice and is well received, it does not completely protect against KS.
Lipid-based deformable nanovesicles are one advanced delivery system that can be considered suitable for noninvasive treatment of AIDS-related KS. In animal models, deformable nanovesicles have shown prolonged circulation times which accounts for their superior therapeutic effectiveness (Kumar et al. Citation2012). Deformable nanovesicles have the potential to encapsulate PTX (a high-molecular-weight drug) and deliver the drug transdermally in to the dermal region and surrounding blood vessels by circumventing the stratum corneum. The herein presented research work documents the development of deformable nanovesicles containing PTX via Box–Behnken design capable of being used in dermal chemotherapy. The in vitro cytotoxicity was assessed on KSY-1 cell lines and the penetration ability in to the dermal layers via gel formulation was probed by confocal laser scanning microscopy (CLSM).
Materials and methods
Materials
Soya lecithin (90% phosphatidyl choline) was purchased from Himedia Laboratories Pvt. Ltd., Mumbai, India. PTX was availed as a gift sample by Fresenius Kabi Oncology Ltd., West Bengal, India. Span 80, chloroform, isopropyl alcohol and carbopol 934P were purchased from SD Fine-Chem Ltd., Mumbai, India. Rhodamine B was procured from CDH (P) Ltd., New Delhi, India.
Ethics declaration
All procedures implicating the use of animals have been conducted in full compliance with the Institutional ethical and regulatory principles and as per the spirit of Association for Assessment and Accreditation of Laboratory Animal Care & International expectations for animal care and use/ethics committees. The investigations were performed after obtaining approval by the Institutional Animal Ethical Committee of Rajiv Academy for Pharmacy, Mathura, India (IAEC No: IAEC/RAP/3968).
Box–Behnken design (BBD)
A three-level, three-factor BBD (Singh et al. Citation2004) was selected to optimize the formulation variables. The design matrix comprising of 15 experimental runs (three factors at three levels) was constructed using Design Expert (Version 8.0.7.1; Stat-Ease Inc., Minneapolis, USA). The model constructed using a BBD can be mathematically expressed by the following equation:
(1)
(1)
Where, Y represents the measured responses associated with each factor level combinations; a0 is the constant; a1, a2, a3 are the linear coefficients, a12, a13, a23 are the interaction coefficients between the three factors. a11, a22, a33 are the quadratic coefficients. The concentration(s) of soya lecithin (X1), cholesterol (X2) and span 80 (X3) were taken as the independent variables. The dependent variables were the entrapment efficiency (Y1), vesicle size (Y2), and % cumulative drug permeation (Y3) as shown in .
Table I. Actual and coded levels of independent variables and responses monitored for Box–Behnken design for paclitaxel-loaded deformable nanovesicular formulations.
Paclitaxel deformable nanovesicles
The deformable nanovesicles containing PTX were prepared by the rotary evaporation sonication technique (Yusuf et al. Citation2014). Accurately weighed amounts of soya lecithin, paclitaxel (1% by wt of lipid) and cholesterol were placed in a 250 mL pear-shaped flask and dissolved in the organic solvent mixture of ethanol (95% v/v) and chloroform, followed by addition of span 80. The mixture was sonicated for 30 min using probe sonicator (PCI Analytics, Mumbai, India). The mixture was evaporated to dryness in a water bath at 60 °C and the resulting film was hydrated with 200 mL of phosphate buffer, pH 6.8 until translucent.
Characterization of deformable nanovesicles
Vesicle size
The average vesicle size, polydispersity index and zeta potential of the nanovesicles were measured by light scattering based on laser diffraction using Malvern zetasizer ver.6.0.1 (Malvern Instruments Ltd., UK) after diluting the sample with water as dispersant.
Entrapment efficiency
The entrapment efficiencies of PTX in the deformable nanovesicles were estimated by an indirect method. The vesicles were treated with n-propanol (1:1) for the precipitation of unentrapped drug followed by centrifugation (Remi cooling centrifuge, Model 412 LAG, Vasai, India) for 10 min at 10,000 rpm. The supernatant was syringed out by 0.45 μm porous nylon-filtered syringe and the absorbance was determined at 231 nm spectrophotometerically (Shimadzu Pharmaspec 1700, Kyoto, Japan). The unentrapped amount of drug was determined using validated calibration curve and the entrapment efficiency was calculated using EquationEq. (2)(2)
(2) .
(2)
(2)
Deformability index
The nanovesicular suspension was extruded through a nylon-membrane filter (Merck specialties Pvt. Ltd., Mumbai, India; pore size: 50 nm) by applying a constant pressure of 1.2 MPa for 10 min. The deformability of the vesicles expressed as deformability index was calculated using EquationEq. (3)(3)
(3) .
(3)
(3)
where, j denotes the weight of suspension extruded in 10 min; rv is the vesicle size (after extrusion) and rp is the pore size of the membrane used.
Ex vivo permeation
The ex vivo permeation of PTX from the deformable nanovesicular suspension was determined across rat skin. The rat was sacrificed by prolonged inhalation of chloroform followed by clearing of the hairs on the abdominal area by shaving. The abdominal skin was then excised and the subcutaneous tissues were removed surgically. The dermis side was wiped with isopropyl alcohol in order to remove residual adhering fat and foreign material. The skin was then washed with distilled water and treated with 2 M sodium bromide solution in water for 6 h. The epidermis was separated using a previously moistened cotton swab with distilled water. The obtained epidermal membrane was repeatedly washed with distilled water, wrapped in aluminum foil and stored in a deep freezer at −20 °C till further use. Prior to experiment, the stored skin membrane was hydrated with phosphate buffer, pH 7.4 at room temperature for 30 min, to remove extraneous debris and leachable enzymes. The excised skin was mounted on Franz diffusion cell between donor and receptor compartment with an effective surface area and receptor cell volume of 2.03 cm2 and 15 mL, respectively. The skin membrane was carefully mounted so that the stratum corneum side facing the donor compartment and dermal side bathed in receptor media (saline phosphate buffer, pH 7.4). An aliquot volume of nanovesicular suspension containing 50 mg of PTX was placed in the donor compartment. The cell assembly was maintained at 37 ± 1 °C and the contents of the receptor compartment were constantly stirred at 100 rpm. Samples were withdrawn (2 ml) via the sampling port at 0, 2, 4, 6, 8, 10, 12 and 24 h and replenished with equal volume of fresh medium to maintain sink condition throughout the experiment. The samples were analyzed at 231 nm. The percent cumulative drug permeation versus time plots were used to derive the slope and intercept of the linear portion of the plots and the flux (J, μg/cm2/h) was calculated by following equation:
(4)
(4)
Selection of optimized formulation
The optimized formulation of deformable nanovesicular suspension was selected on the basis of optimal vesicle size, maximum entrapment efficiency and maximum percentage cumulative drug permeation. The optimized formulation was characterized by transmission electron microscopy.
Transmission electron microscopy
The optimized formulation was visualized with a high-resolution transmission electron microscope (JEOL JEM-3100F, Munchen, Germany) at 10–100 K magnification at an accelerating voltage of 300 kV. One milliliter of sample was deposited on copper grid as a thin film and 10 μl of 1% w/v phosphotungstic acid was used as negative stain. The samples were visualized at 5000× magnification.
Preparation of nanovesicular gel
An appropriate amount of carbopol 934P was weighed and added slowly to phosphate buffer, pH 6.8 with constant stirring. The gel (1% w/v) was allowed to swell for at least 24 h with gentle stirring until fully swollen and transparent. Triethanolamine (0.5% w/v) was added in order to maintain the pH of the gel. Deformable nanovesicular gel was prepared by slowly dispersing the pellet of TS9 in the gel (TG) so that the final formulation contained PTX equivalent to 10 mg. Similarly, the control gel (CG) was prepared by dispersing 10 mg of pure drug with the help of 1% v/v ethanol (95% v/v) in the carbopol gel base along with 1% w/v menthol as permeation enhancer.
Evaluation of transfersomal gel
pH, viscosity and drug content
One gram of gel formulation was weighed accurately and dispersed in 10 ml of distilled water. The pH of the dispersion was measured using a digital pH meter (Model HI 96107, pHep®, Hanna instruments Ltd., Italy). The viscosity was measured with Brookfield Viscometer (BV R/S–CPS Brookfield Engineering Laboratories, Inc. MA, USA) DV-II pro-coupled with S-93 T-spindle. The viscosity was measured at 25 °C by rotating the spindle at 20 rpm. For drug content determination, the gel formulation (100 mg) was dissolved in ethanol (95% v/v) and filtered. The volume was made up to 100 ml with ethanol, diluted appropriately and absorbance measured at 231 nm.
Ex vivo skin permeation
The ex vivo skin permeation study was carried out using a Franz diffusion cell. The experimental conditions were same as those described in the section “Ex vivo permeation”. A known quantity of gel equivalent to the calculated transdermal dose of PTX was uniformly spread over the skin on donor side. Samples were collected at definite time intervals and the absorbance was recorded spectrophotometrically.
In vitro occlusion
An in vitro occlusion test adapted by Wissing et al. (Citation2001) was used. Beakers (100 ml) were filled with 50 ml of water, covered with filter paper and sealed. Two hundred milligram samples (TG/CG) were spread evenly with a spatula on the filter surface (18.10 cm2) leading to an applied amount of 11.04 mg/cm2. A visible film formation on top of the filter paper was observed during the experiment. At the end of the experiment, the solid film could be removed with a spatula. The samples were stored at 32 °C and 50–55% RH for 48 h. The samples were weighed after 48 h giving the water loss due to evaporation at each time (water flux through the filter paper). Beakers covered with filter paper but without applied sample served as reference. Each experiment was performed in triplicate. The occlusion factor F was calculated according to EquationEq. (5)(5)
(5) :
(5)
(5)
where A is the water loss without sample (reference) and B is the water loss with sample.
In vitro cytotoxicity
KSY-1 cell lines were cultured in RPMI1640 media (Gibco BRL, Life Technologies, Inc.) supplied with 10% heat-inactivated bovine serum and maintained under standard cell culture condition at 37 °C with 50% CO2 in a humidified environment. The cells were substituted with 98% trypsin–EDTA solution, pH 7.2 once every 4 days. Inhibition of cell growth of KSY-1 cell lines was determined for PTX, deformable nanovesicular suspension (TS9), deformable nanovesicular gel (TG) and 5-fluorouracil (standard cytotoxic agent). IC50 was determined in order to estimate the maximum effective concentration of all samples which will inhibit 50% growth of cancerous cells.
Confocal laser scanning microscopy (CLSM)
Wistar albino rats, weighing 150–200 g, were divided into two groups each consisting of two animals. The first group served as control and was applied CG containing rhodamine B dye. The second group received application of TG loaded with rhodamine dye as fluorescent marker. The formulations were applied on the dorsal abdominal area of the rat (2 cm2). The animals were caged individually after application of formulation to prevent licking and were sacrificed after 12 (TG) and 24 h (CG) of application. Different test periods were used as CG containing pure drug is expected to take longer time for penetration than deformable nanovesicular gel (TG). The skin was removed immediately cut into pieces, and washed with saline phosphate buffer, pH 6.8. The skin was immersed in 10% buffered formalin for 24 h, embedded in paraffin wax, sectioned and evaluated for depth of penetration of Rhodamine marker. Full skin thickness was optically scanned at different increments through the z-axis of a CLS microscope (Confocal Laser Scanning Microscope, Fluo View FV 1000, Olympus, Japan). Optical excitations were carried out with a 540 nm laser at 100× magnification. The micrographs obtained were recorded to analyze the corresponding depth travelled by TG and CG in 12 and 24 h, respectively.
Stability
Stability studies were conducted to monitor any physical or chemical changes in the deformable nanovesicles (TS9). After measuring the initial percentage entrapment of the drug in the optimized formulation, the two batches of the same formulation were stored in sealed glass ampoules (one each) at refrigeration temperature (4 ± 2 °C) and room temperature (25 ± 2 °C) for a period of 3 months. After every 1 month, physical parameters such as vesicle size and chemical parameters such as percentage entrapment of the drug were determined in order to estimate the effect of storage temperature on the physical and chemical stability of the deformable nanovesicles.
Statistical analysis
The unpaired Student’s t-test was used to test the differences between the calculated parameters. Statistical differences yielding p < 0.05 were considered statistically significant. Design Expert software version 8.7.0.1 (Stat Ease, Inc., Minneapolis, USA) was used to optimize the variables and to validate the experimental design.
Results and discussion
Box–Behnken design (BBD) is an independent, rotatable (or nearly rotatable) quadratic design and the treatment combinations are present at the midpoint of edges of the formulation space or the process and the center of experimental domain (Box and Behnken Citation1960, Govender et al. Citation2005). This design avoids conducting experiments under extreme conditions as it does not contain experiments of combinations of factors which are located at their highest or lowest levels (Ferreira et al. Citation2007). Therefore, a three-level (+,0,−) and three-factor BBD was selected as a suitable approach to develop and optimize the formulation variables in order to explore the quadratic response surfaces and for producing polynomial models to facilitate optimization with small number of experiments (Khajeh Citation2009). Fifteen formulations were prepared by varying the composition of soya lecithin as phospholipid, cholesterol as membrane rigidifying agent, and span 80 as edge activator. Soya lecithin was chosen because of its bilayer forming property. Span 80 was selected as surfactant because it is biocompatible and provides optimum deformability to the lipid bilayer. All formulations were formed as colloidal dispersions and the responses of each are compiled in .
Dependent variables
Vesicle size
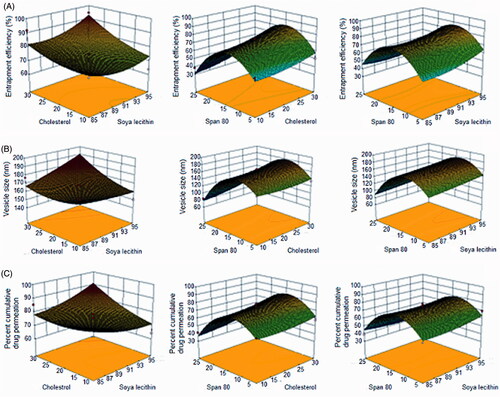
As interpreted from the design, there lies a direct relationship between the phospholipid concentration and edge activator on the vesicle size. The smallest vesicle size was found for TS4 (74.9 nm) and the largest vesicle size was found for TS9 (185.76 nm, ). All the formulations had vesicle sizes <200 nm that is considered suitable for transdermal delivery (Hiruta et al. Citation2006). An increase in the concentration of phospholipid along with edge activator substantiated an increase in vesicle size. This may be attributed to aggregation of lipid and its improper hydration (Duangjit et al. Citation2011), resulting in an increased size of the vesicles up to a certain threshold level (medium level of span 80 coded “0”) beyond which the vesicle size decreased () possibly due to the formation of mixed micelles instead of vesicles, which are comparatively smaller in size. The effect of simultaneously varying span 80 and cholesterol was similar to the one described for span 80 and soya lecithin. In contrast, a simultaneous increase in the levels of cholesterol and soya lecithin showed a decrease in vesicle size.
Figure 1. Three-dimensional response surface plots demonstrating the effect on independent variables on the dependent variables: vesicle size, entrapment efficiency and percent cumulative drug permeation of transfersomal formulations of paclitaxel.
Entrapment efficiency
The drug entrapment is ascribed to the lipophilic property of PTX (log p = 3) which enables it to distribute in the lipid bilayer of the vesicles. When the lipid layer gets saturated with the drug, the entrapment efficiency becomes limited. So it is suggested that PTX can be entrapped in the vesicles only to a limited extent. Span 80 had a considerable influence on the entrapment efficiency. Initially, the percent entrapment efficiency increased with an increase in the concentration of span 80 (edge activator) but on further increasing the concentration of span 80, the percent entrapment efficiency was found to be decrease (). As explained by El Zaafarany et al. (Citation2010) in their studies on the role of edge activator on deformable vesicles, formation of micelles and a disruption of the lipid membrane lead to pore formation within lipid bilayer of vesicles at higher concentration of span 80 (edge activator), which results in escape of drug from the vesicles resulting in lower drug entrapment. Inclusion of cholesterol in the formulation also affected the entrapment efficiency. Hence, it was observed that even with a saturated concentration of span 80, the percent entrapment efficiency was high. Cholesterol in the phospholipid bilayer acted as a membrane rigidifying agent and prevented leakage of drug from the vesicle, and thus increased the entrapment efficiency. An entrapment efficiency of 94.40% for TS9 confirmed the potential of deformable nanovesicles to entrap a high-molecular-weight drug. The effect of input variables on entrapment efficiency can be clearly seen in the 3D response surface diagrams ().
Ex vivo permeation
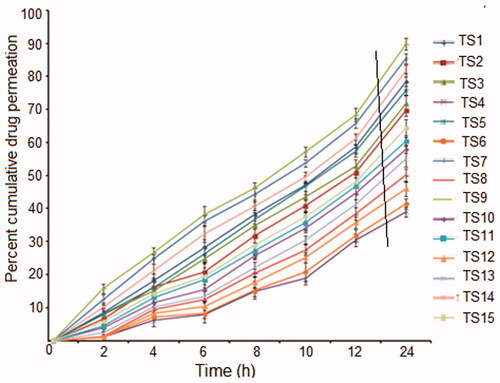
The percentage cumulative drug permeated (CDP) per unit area through excised rat skin as a function of time was determined from the ex vivo permeation plots (). It was found that deformable nanovesicular preparation TS9 exhibited the highest CDP of 94.69%. The transdermal flux of the formulations ranged from 149.78 ± 6.68 to 438.38 ± 6.24 μg h−1 cm−2 () and the maximum flux was seen for TS9. The reason for maximum flux is attributable to incorporation of a large amount of span 80 that supported the deformability of the phospholipid bilayer facilitating easy passage through the pores of the stratum corneum even though smaller in diameter than deformable nanovesicles. The increase in the drug permeation may be a consequence of one or a combination of the following mechanisms as explained by Cevc et al. (Citation1995): (1) high association of drugs with vesicle bilayers, (2) increased partitioning of vesicles into the stratum corneum, (3) rapid permeation of intact vesicles and (4) elasticity of vesicle membrane.
Figure 2. In vitro permeation plots of transfersomal formulations of paclitaxel.
The results also suggest that drug permeation rates were highest for compositions containing high concentrations of phospholipid (soya lecithin) and optimum concentration of surfactant or edge activator. The results correlated with the deformability index that was highest for TS9 due to an optimum concentration of span 80. This increase in deformability was probably the result of the function of span 80 as edge activator which has high affinity for strongly curved membranes that lowers the vesicle deformation energy by way of curvature induced lateral demixing of membrane components which leads to an accumulation of membrane softening ingredients in most curved parts of deformed bilayer vesicles (Parsegian et al. Citation1979). Thus at its optimum concentration, the deformation index is expected to increase so that the vesicles can penetrate deeper into the dermal layers. However, both at lower and at higher concentrations above its optimum level, a decrease in deformability index was observed resulting in less cumulative drug permeation.
Deformability index
The prerequisite for transdermal delivery is that the vesicular suspension should be deformable enough to pass through the stratum corneum as well as minute pores of the epidermis. Lipid-based vesicle penetration through the skin is a function of its carrier membrane flexibility. Hence the deformability index () was determined and the maximum deformability index was seen for TS9 (138.02). This may be attributed to an increase in concentration of span 80 which acts as a membrane softening/destabilizing agent and contributes to the deformation infiltration of deformable nanovesicles. As the concentration of span 80 increases, the deformability of the nanovesicles increases because the span 80 present inside the phospholipid bilayer will act as an edge activator which has a high affinity for strongly curved membranes and will lower the deformation energy by the mechanism explained in previous section. The deformability of the vesicles is governed by their own bending energies (Gompper and Kroll Citation1995). The pressure depends on the lysis tension required to rupture the phospholipid membrane rather than bending energies of the system.
Zeta potential and PDI
The magnitude of the zeta potential is an indication of the physical stability of the colloidal system. If the vesicles in suspension carry a large negative or positive zeta potential, then they will tend to repel each other and there will be no tendency for the vesicles to come together and form aggregates or fuse into large vesicle size. However, if the vesicles have low zeta potential values, then there will be less force to prevent the vesicles from coming together and flocculating. The general dividing line between stable and unstable suspensions is generally taken at either +30 or −30 mV (Celia et al. Citation2012). The zeta potentials determined for all the vesicular formulations were found to be negative and ranged from −23.2 to −49.8 mV (). The net charge observed was due to the lipid head group in the formulations. Soya lecithin is a zwitterionic compound with an isoelectric point of 6–7. In the formulation development, the pH of hydration media was maintained at 7.4 (suitable for skin delivery) which is higher than the isoelectric point of soya lecithin so the vesicles carried a net negative charge. Span 80 and PTX are nonionic in nature and hence did not contribute to the vesicle charge. The skin also has a slight negative charge and negatively charged nanovesicular formulations will exhibit improved skin permeation of PTX (Sinico et al. Citation2005). Irrespective of the charge, a value of <30 mV is considered to be an effective cut off for the formulations, and TS9 and TS15 can be considered as electrically stable. The polydispersity index was used to assess the homogeneity of the vesicular dispersion and to check the evenness of vesicle size. The size distribution curves of vesicles were unimodal in the range 0.228–0.589. A polydispersity index of <0.3 indicates a homogenous dispersion (Verma and Pathak Citation2012), hence, selectively, TS1, 3, 5, 7, 8 and 9 made with intermediate levels of span 80/phospholipid can be considered as homogenous vesicular dispersions.
Optimization and validation of Box–Behnken design
The responses generated from the formulations were statistically analyzed using the Design Expert software and fitting of data to various models revealed that the best-fit model for all the three dependent variables was quadratic model. The model(s) that best described the data were selected for use in the optimization process. The best-fit model was chosen based on a p value ≤0.05, residuals, lack of fit and the correlation coefficient, R2. One-way ANOVA was used to identify significant factors that affected the responses studied, and the response surface plots were produced to study interaction effects of input variables, if any, on all responses. The results for model analysis are summarized in and the model with smallest p value, acceptable lack of fit and highest R2 values was selected for use in optimization process. The data best-fitted the quadratic model, on analysis by one-way ANOVA.
Table II. Results of model analysis and lack of fit.
Validation of the experimental design becomes very important after establishment of design in order to provide evidence that the composition which was selected for the preparation of various formulations is optimized or not. Extra design check points (center points of the design) are the basis for validation as these points tell about the purity of the experiments. Therefore, validation of the experimental design was done and the observed values of the center points (TS1, TS3 and TS9) were found in concordance with the predicted values determined by the following equations:
(6)
(6)
(7)
(7)
(8)
(8)
Higher values of the coefficients indicate the quadratic (nonlinear) nature of the relationship. A positive value for a response in the regression equation represents synergistic effects which will favor the optimization, while a negative value indicates antagonistic effect which will provide an inverse or negative relationship between the factors taken and responses observed. It is evident that the phospholipid and cholesterol concentration had positive effects on the responses whereas span 80 showed an inverse relationship with the responses. Response Y3 (%CDP) was affected greatly by the edge activator (span 80). Since span 80 had a negative relationship with percent cumulative drug permeation, an amount of span 80 increases beyond the optimal limit showed gradual decrease in percent cumulative drug permeation.
No statistically (p > 0.05) significant difference was observed between the predicted and experimental values of responses (). Linear diagnostic plots () for actual versus predicted values validate the closeness in values. Low values of residuals denote prognostic ability of the experimental design. The prediction accuracy of the process was then established by calculating the percent prediction errors of the three formulations formulated using the optimized independent variables. The percent prediction errors were <5% except for response Y3 in TS3 and TS5 indicates that the prediction was more precise for other responses than for response Y3. These results validate the prognostic ability of the experimental design.
Figure 3. Linear diagnostic plots (2D) plots (A, C, E) between actual and predicted values and the corresponding residual plots (B, D, F) for various responses.
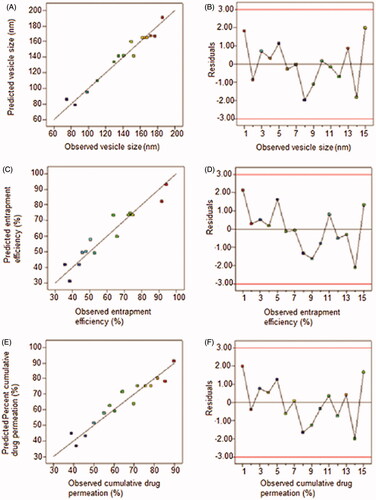
Table III. Validation of experimental model: predicted versus observed responses.
Transmission electron microscopy
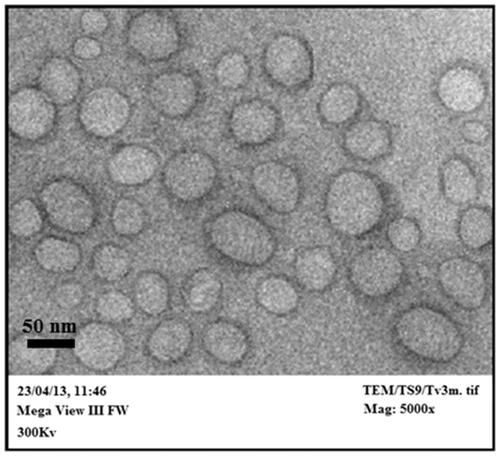
Transmission electron micrograph showed spherical nanosized vesicles with a lower number of oval vesicles in the suspension bulk (). The structural appearance confirmed a lighter core surrounded by a denser excellent outline that seals the core perfectly. When a thin film of lipid is hydrated by an aqueous media, it tends to form an enclosed vesicular structure with shape ranging from spherical to oval in order to attain thermodynamic stabilization by reducing the total free energy of the system. No disruptions of vesicular structure confirmed the vesicle integrity even after various mechanical stresses such as sonication and extrusion.
Figure 4. Transmission electron micrographs of optimized transfersomal formulation of paclitaxel (TS9).
Deformable nanovesicular gel
An effective transdermal dosage form design should fulfill demanding expectations with respect to feasibility, stability, sensitivity, therapeutic elegancy as well as patient compliance. To satisfy the aforementioned criteria, an endeavor has been structured to develop a dosage form suitable for transdermal delivery of PTX via deformable nanovesicular gel. The gel was prepared by the dispersion method using carbopol 934P as gelling agent, in which vesicular pellet of TS9 was uniformly dispersed throughout the polymeric network to form the TG. It was evaluated against the control gel (CG: containing freely dispersed PTX in carbopol gel matrix) for various pharmacotechnical and performance characteristics.
pH, viscosity and drug content
A physical examination of TG and CG revealed translucent gels with a mixed nonspecified faint smell of the excipients(s) used. The pH of TG and CG was 6.71 ± 0.15 and 6.64 ± 0.23, respectively, that was almost at the midpoint of the specified range of physiological skin pH of 3–9 and rendered the formulations safe and nonirritating to the skin. A higher pH or overly acidic pH of the products intended for skin application may cause alteration of the pH of the skin, thereby causing inflammation and escalating the inflamed skin in KS. The viscosities of TG and CG were found to be 36,483.2 ± 6.23 and 32,834.3 ± 4.97 cp, respectively, () values that are expected to facilitate retention of gel on skin as well as provide easy extrusion of the dosage form from the package (collapsible tubes). Although carbopol 934 P was present in both the gels in the same concentration and equal volumes have been maintained, even then the viscosity of the TG was slightly higher than that of the CG possibly due to the deformable nanovesicles in TG.
Table IV. Comparative data of transfersomal (TG) and control gel (CG).
Ex vivo skin permeation
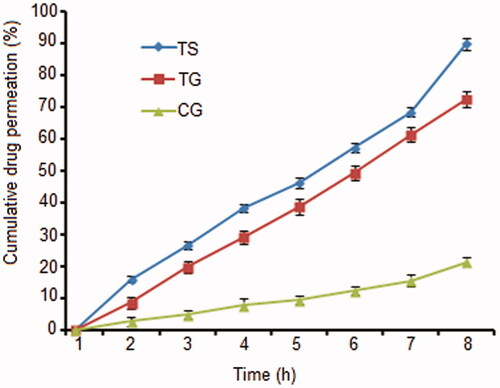
Ex vivo skin permeation studies () demonstrated a significantly higher (p < 0.05) %CDP of 72.48 ± 2.49 for TG and CG (21.20 ± 1.54). In comparison to TS9 (89.80 ± 1.84), the %CDP of TG was restrained due to carbopol matrix that deterred the path of drug molecules. TG, on the other hand, showed a higher %CDP than CG due to the presence of edge activator (span 80) that permitted flexibility/deformability of nanovesicles which allowed them to pass through the narrow constricted pores of the experimental skin. When fitted to permeation models, TG followed a Higuchi-based diffusion model with an R2 value of 0.9989, while CG followed the first-order permeation kinetics model with an R2 value of 0.9974 (). Experimental flux for TG was 4.69 times higher than CG and close to the target flux of 499.5 μg/cm2/h. The flexibility of the deformable nanovesicles allows them to squeeze through the pores much smaller in diameter than their own diameters (Cevc et al. Citation1995).
Figure 5. Comparative ex vivo cumulative drug permeation profiles of TS9, TG and CG in phosphate buffer, pH 7.4.
In vitro occlusion
Occlusion is an important factor influencing skin hydration and affects the penetration of compounds. In the in vitro occlusion studies, the deformable nanovesicular formulation (TG) displayed a negligible occlusion factor (F) of 1.92 ± 0.49 in comparison to the occlusion factor of 17.21 ± 1.49 for CG at 24 h (p < 0.05). At 48th hour, F values changed to 1.83 ± 0.69 and 5.53 ± 0.48 for TG and CG, respectively. This clearly indicates a larger occlusive effect of CG in comparison to TG. An occlusive effect induces enhanced skin hydration, causing stratum corneum to swell thus leading to an enhanced penetration into- or localization of compounds in specific skin layers. However, in case of deformable nanovesicles, occlusion disables the transcutaneous hydration gradient that normally drives the carriers across the skin (Cevc et al. Citation2008).
In vitro cytotoxicity
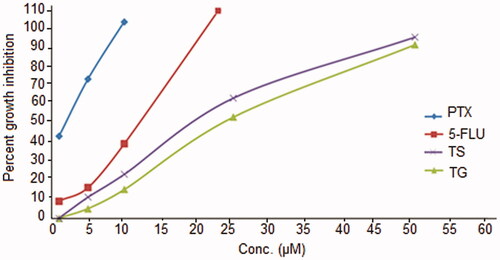
In vitro cytotoxicity study was conducted on AIDS-related KS cell lines: KSY-1. Free/pure PTX showed a strong cytotoxicity against or KSY-1 cells in comparison to 5-FU (IC50 = ≤12) taken as reference for the study (). The IC50 was found to be highest (≤2) for pure PTX followed by TS9 (≤17) and TG (≤19). A slow release of the therapeutic agent in the cellular cytoplasm from the gel matrix of the TG was probably the reason for the lower IC50 value of TG than TS9. In general, an IC50 value ≤10 μg/ml indicates an anticancer activity for the pure compound, whereas IC50 value of ≤20 μg/ml indicates the anticancer activity for test formulations (Arya and Pathak Citation2014). Thus, the TG formulation (comprising TS9 in the gel base) has considerable potential for exerting a cytotoxic effect in vivo.
Figure 6. Percent growth inhibition graph for various treatments on KSY1 cell lines.
Confocal laser scanning microscopy
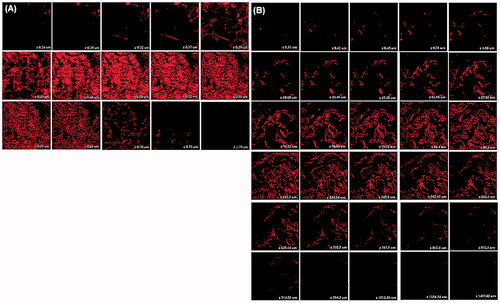
The study was focused on determining the depth of penetration using dermatomed rat skin, and also for demonstrating the possible mechanism of permeation through the skin. Rhodamine B lipophilic dye was selected as a fluorescent probe and can be easily incorporated within the vesicles to determine the depth and variability in extent of permeation in skin (Toropainen et al. Citation2001). Rat skin suited the experimentation as the reported thickness of rat stratum corneum (18 μm) is close to human stratum corneum thickness of 17–20 μm. Results of CLSM revealed that optimized transfersomal gel (TG) was fairly evenly distributed throughout the stratum corneum, viable epidermis and dermis demonstrated by high fluorescence intensity of rhodamine B. It also penetrated deeply into the rat skin in comparison to CG which remained confined to the upper surface of stratum corneum. The efficient delivery of TG suggests enhanced penetration and consequent fusion of the vesicles with the membrane lipids in the depths of the skin layers, supporting the hypothesis of many researchers. However, weak fluorescence exhibited in this region may be due to the interaction of stratum corneum lipid with the vesicles that is suggestive of the permeation enhancing effect of the lipid system that interacts and loosens the tight junctions of the stratum corneum (Schatzlein and Cevc Citation1995). Deeper visualization revealed fading of fluorescence intensity of CG beyond 0.64 μm () while in case of TG, the intensity was maintained to a depth of 914.55 μm (). The CLSM micrographs after 24 h of TG application showed the presence of an optimal amount of rhodamine B that could be densely observed up to the depth of 1234.24 μm, beyond which the fluorescence intensity decreased but the presence of the fluorescence could still be observed to the depth of 1487.65 μm that supported the penetrability of the active ingredient in to the dermal region and hence can enter into the systemic circulation. CG, on the other hand, remained confined to the upper region of viable epidermis with traces of fluorescence up to the maximum depth of 1.79 μm. These results strongly suggest deep and fast penetration of the deformable nanovesicular formulation of PTX. The formulation is thus apt for management of AIDS-related KS wherein drug delivery is expected into the skin down to the blood vessels. Thus the system has potential for dermal chemotherapy and after reaching the target site it may enter into the systemic circulation of the diseased tissue.
Figure 7. Confocal laser scanning micrographs of (A) control gel (CG) and (B) transfersomal gel (TG) captured using fluorescent tracer Rhodamine B across the rat skin.
Stability
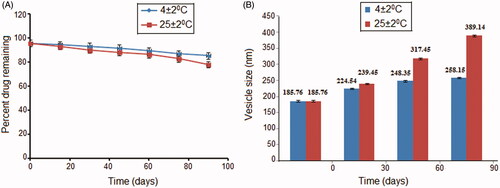
The storage stability of the dosage form is an important aspect and an integral part of formulation development. It guides suitable storage conditions and defines the shelf life of the developed formulation. The stability of TG was found to depend on the storage temperature. Results indicate that the drug leakage from the vesicles at 4 °C was lower than on storage at 25 °C. As illustrated in , the drug loss from the formulation TG at 4 °C was 10.18% while at 25 °C it was 17.63%. At lower temperatures, the vesicles remain in gel state and exhibit good packing characteristics; hence, the loss of drug is very low. As the temperature increases, the gel state gets converts to liquid crystalline state (Ghanbarzadeh and Arami Citation2013) that renders them more flexible and leakier. Chemical degradation may also contribute to physical instability of vesicles at elevated temperatures. The effect of storage on vesicle size has also been studied and an increase in the vesicle size was observed on storage (). This may be attributed to aggregation and fusion of small vesicles leading to enlargement of the vesicle size. A simple model for aggregation describes that the isolated vesicle initially tends to flocculate that results in a smaller increment in size. However, flocculation of vesicles is a reversible process and they can be redispersed to their original vesicular state, but fusion is irreversible that leads to a permanent increase in vesicle size (Sinico et al. Citation2005).
Figure 8. Effect of storage temperature on (A) drug entrapment and (B) vesicle size of TS9.
Conclusions
The deformable nanovesicles of paclitaxel were successfully optimized by Box–Behnken design. By preparing these lipids-based vesicles capable of deforming their shapes, we have designed a system capable of delivering paclitaxel more effectively and noninvasively through the skin of AIDS-related KS. The deformable nanovesicles were found capable of effectively permeating the stratum corneum and reaching the dermal layer of the skin. The in vitro cytotoxicity study confirmed the therapeutic efficacy of the developed dosage form. The formulation may provide an alternative to pre-existing paclitaxel formulations available on commercial scale, by being noninvasive, efficacious and stable. Clinical phase I, phase II and phase III studies will be required before the formulation can be used in human patients.
Declaration of interest
All the authors have approved the manuscript.
The authors are highly thankful to All India Council of Technical Education, New Delhi, India, for providing research fellowship to Ms Meenu Sharma.
Related Research Data
References
- Arya P, Pathak K. 2014. Assessing the viability of microsponges as gastro retentive drug delivery system of curcumin: optimization and pharmacokinetics. Int J Pharm. 460:1–12.
- Box GEP, Behnken DW. 1960. Some new three-level designs for the study of quantitative variables. Technometrics. 2:455–475.
- Celia C, Cilurro F, Trapasso E, Cosco D, Fresta M, Paolino D. 2012. Ethosomes and transferosomes containing linoleic acid: Physicochemical and technological features of topical drug delivery carriers for potential treatment of melasma disorder. BioMed Micro Devices. 14:119–130.
- Cevc G, Schatzlein A, Blume G. 1995. Transdermal drug carrier: basic properties, optimization and transfer efficiency in the case of epicutaneously applied peptide. J Control Release. 36:3–16.
- Cevc G, Mazgareanu S, Rother M, Vierl U. 2008. Occlusion effect on transcutaneous NSAID delivery from conventional and carrier-based formulations. Int J Pharm. 359:190–197.
- Dittmer DP, Richards KL, Damania B. 2012. Treatment of Kaposi sarcoma-associated herpesvirus-associated cancers. Front Microbiol. 3:1–8.
- Douglas JL, Gustin JK, Moses AV, Dezube BJ, Pantanowitz L. 2010. Kaposi Sarcoma pathogenesis: a triad of viral infection, oncogenesis and chronic inflammation. Transl Biomed. 1:172.
- Duangjit S, Opanasopit P, Rojanarata T, Ngawhirunpat T. 2011. Characterization and in vitro skin permeation of meloxicam loaded liposomes versus transfersomes. J Drug Deliv. Article ID 418316.
- El Zaafarany GM, Awad ASG, Holayel SM, Mortada DN. 2010. Role of edge activators and surface charge in developing ultradeformable vesicles with enhanced skin delivery. Int J Pharm. 397:164–172.
- Ferreira SLC, Bruns RE, Ferreira HS, Matos GD, David JM, Brandao GC, et al. 2007. Box–Behnken design: an alternative for the optimization of analytical methods. Anal Chim Acta. 597:179–186.
- Ghanbarzadeh S, Arami S. 2013. Enhanced transdermal delivery of diclofenac sodium via conventional liposomes, ethosomes and transferosomes. BioMed Res Int. Article ID: 616810.
- Gompper G, Kroll DM. 1995. Driven transport of fluid vesicles through narrow pores. Phys Rev. 52:4198–4208.
- Govender S, Pillay V, Chetty DJ, Essack SY, Dangor CM, Govender T. 2005. Optimization and characterization of bioadhesive controlled release tetracycline microspheres. Int J Pharm. 306:24–40.
- Hennenfent KL, Govindan R. 2006. Novel formulations of taxanes: a review. Old wine in a new bottle? Ann Oncol. 17:735–749.
- Hiruta Y, Hattori Y, Kawano K, Obata Y, Maitani Y. 2006. Novel ultradeformable vesicles entrapped with bleomycin and enhanced to penetrate in the rat skin. J Control Release. 113:146–154.
- Khajeh M. 2009. Application of Box-Behnken design in the optimization of a magnetic nanoparticle procedure for zinc determination in analytical samples by inductively coupled plasma optical emission spectrometry. J Hazard Mater. 172:385–389.
- Kumar A, Pathak K, Bali V. 2012. Ultra-adaptable nanovesicular systems: a carrier for systemic delivery of therapeutic agents. Drug Discovery Today. 17:1233–1241.
- Luo C, Wang Y, Chen Q, Han X, Liu X, Sun J, He Z. 2012. Advances of paclitaxel formulations based on nanosystem delivery technology. Mini Rev Med Chem. 12:434–444.
- Nehate C, Jain S, Saneja A, Khare V, Alam N, Dubey RD, Gupta PN. 2014. Paclitaxel formulations: Challenges and novel delivery options. Curr Drug Deliv. 11:666–686.
- Oostendorp RL, Buckle T, Lambert G, Garrigue JS, Beijnen JH, Schellens JHM, van Tellingen O. 2011. Paclitaxel in self-micro emulsifying formulations: oral bioavailability study in mice. Invest New Drugs. 29:768–776.
- Parsegian VA, Fuller N, Rand RP. 1979. Measured work of deformation and repulsion of lecithin bilayers. Proc Natl Acad Sci USA. 6:2750–2754.
- Raimundo KP, Asche CV. 2011. A review of the efficacy and outcomes studies of currently approved chemotherapy treatments for advanced AIDS-Kaposi’s sarcoma. HIV AIDS Rev. 10:56–60.
- Schatzlein A, Cevc G. 1995. Non-uniform cellular packing of the stratum corneum and permeability barrier function of intact skin: a high resolution confocal laser scanning microscopy study using highly deformable vesicles (Transfersomes). Br J Dermatol. 138:583–592.
- Singla AK, Garg A, Aggarwal D. 2002. Paclitaxel and its formulations. Int J Pharm. 235:179–192.
- Singh B, Kumar R, Ahuja N. 2004. Optimizing drug delivery systems using systematic “Design of Experiments.” Part I: Fundamental aspects. Crit Rev Ther Drug Carr Syst. 22:27–105.
- Sinico C, Manconi M, Peppi LF, Valenti D, Fadda AM. 2005. Liposomes as carrier for dermal delivery of tretinoin: In vitro evaluation of drug permeation and vesicle skin interaction. J Control Release. 103:123–136.
- Toropainen E, Ranta VP, Talvitie A, Suhonen P, Vrtti A. 2001. Culture model of human corneal epithelium for prediction of ocular drug absorption. Invest Ophthalmol Visual Sci. 42:2942–2948.
- Van Asperen J, Van Tellingen O, Van der Valk MA. 1998. Enhanced oral absorption and decreased elimination of paclitaxel in mice cotreated with cyclosporine A. Clin Cancer Res. 4:2293–2297.
- Verma P, Pathak K. 2012. Nanosized ethanolic vesicles loaded with econazole nitrate for the treatment of deep skin infections through topical gel formulation. Nanomed Nanotech Biol Med. 8:489–496.
- Wissing SA, Lippacher A, Muller RH. 2001. Investigations on the occlusive properties of solid lipid nanoparticles (SLN). J Cosmet Sci. 52:313–324.
- Yusuf M, Sharma V, Pathak K. 2014. Nanovesicles for transdermal delivery of felodipine: development, characterization and pharmacokinetics. Int J Pharm Invest. 4:119–130.