
Abstract
Retinal stem cells (RSCs) have been defined as neural cells with the potential to self-renew and to generate all the different cell types of the nervous system following differentiation, which are an ideal engraft in retinal regeneration. In this research, mouse RSCs were isolated from retina, induced differentiation into neuron cells in vitro after over-expression of miR-9. The results showed that the RSCs could induce differentiation into neuron cells under the special medium, but when the miR-9 was over-expressed, the differentiated efficiency of neuron cells from RSCs could be promoted. This reason was demonstrated that polypyrimidine tract-binding protein 1 (PTBP1) was a repressor for polypyrimidine tract-binding protein 2 (PTBP2), during neuronal differentiation, miR-9 reduced PTBP1 levels, leading to the accumulation of correctly spliced PTBP2 mRNA and a dramatic increase in PTBP2 protein. And then miR-9 promoted neuron cells from RSCs were successful colonized into injured spinal cord for participation in tissue-repair. In conclusion, our research showed that the miR-9 promoted the differentiation of neuronal cells from RSCs, and this mechanism was miR-9 reduced the expression of PTBP1, increased the expression of PTBP2.
Introduction
MicroRNAs (miRNAs) are a fundamental class of biological molecules with a crucial role in development (Kloosterman and Plasterk Citation2006), the dysfunction of which has been linked to cancer (Calin and Croce Citation2006), among other biological processes. Genes encoding miRNAs, which are found in most eukaryotes, produce short (18–25 nt) RNAs that bind to mRNA traRSCripts and down-regulate their expression either through mRNA destabilization or translational repression (Bartel Citation2009, Shukla et al. Citation2011). miRNAs regulate the expression of genes by guiding the RNA-induced silencing complex (RISC) to a target sequence, which is usually located at the 3′untranslated region (UTR) of mRNAs (Bartel Citation2004). Retinal stem cells (RSCs) have the ability to self-renew, and are capable of differentiating into neurones, astrocytes and oligodendrocytes. The RSCs have been isolated from the developing retina. Thus, miRNAs are potentially key post-traRSCriptional regulators in stem cell self-renewal and differentiation. Distinct sets of miRNAs have been shown to be specifically expressed in embryonic stem cells (Houbaviy et al. Citation2003, Suh et al. Citation2004). Knock-out or knock-down of Dicer causes embryonic lethality and loss of stem cell populations (Wienholds et al. Citation2003). Argonaute family members, key components of the RISC, are required for maintaining germline stem cells in various species (Carmell et al. Citation2002, Zhai et al. Citation2014). These observations together support a role for miRNAs in stem cell biology. Several brain-specific miRNAs have recently been identified. Among these miRNAs, miR-9 is expressed specifically in neurogenic regions of the brain during neural development and in adulthood (Hirakata and Siomi Citation2015, Krichevsky et al. Citation2003, Lagos-Quintana et al. Citation2002, Leucht et al. Citation2008, Zhao et al. Citation2009). MiR-9, enriched in central nerve system (CNS) (Deo et al. Citation2006), contributes likely to multi-pathological processes including the neurogenesis (Shibata et al. Citation2011), proliferation (Hu et al. Citation2014), migration and differentiation of neural progenitor cells (Zhao et al. Citation2009), drug adaption (Pietrzykowski et al. Citation2008), adult brain plasticity (Coolen et al. Citation2012), neural cell fate (Nakagawa Citation2015, Zhao et al. Citation2013), the migration and proliferation of glioma cells (Tan et al. Citation2012), axon extension and branching (Dajas-Bailador et al. Citation2012), spinal motor neuron development (Otaegi et al. Citation2011) under physiological status. In current report, miR-9 directly targets mRNAs of Lifr-beta, Il6st (gp130), and Jak1 to down-regulate these critical upstream components of the Jak-Stat pathway, achieving inhibition of Stat phosphorylation and consequently, suppression of astrogliogenesis (Zhao et al. Citation2015). miR-9 is expressed specifically in neurogenic areas of the brain and may be involved in neural stem cell self-renewal and differentiation. In this research, miR-9 was transfected into mouse RSCs for differentiation of neuron cells to research the functions in differentiation programs.
Materials and Methods
Isolation and culture of RSCs
RSCs were collected from the retina tissue of BABLC mouse, supplied by the Laboratory Animal Center of Capital Medical University. All animal experiments were approved by the Animal Care and Experimentation Committee of the Capital Medical University.
Retina tissue was isolated and rinsed three times and then transferred to a Dulbecco’s modified Eagle’s medium/Ham’s F-12 (D/F12, Gibco, Carlsbad, CA) medium containing plate was cultivated into monoplast suspension after repetitive beat by pipette and mechanical separation, and then single cells were plated at 1000 cells/cm2 in untreated 25 cm2 tissue culture flasks, cultured in completed neural medium [D/F12 + 2% B27 supplement (Gibco) + 20 ng/mL of EGF (PeproTech, NJ) + bFGF (PeproTech, Rocky Hill, NJ). Media were half-refreshed every 2–3 days.
Immunofluorescence
Immunofluorescence was used to identify RSCs by the specific marker, Nestin. RSCs were seed in 100 μg/ml poly-l-lysine coated coverslips 24 h, then 4% paraformaldehyde for 10 min and then washed three times in PBS buffer. Cells were per-metabolized with 0.125% Triton X-100 for 10 min and then washed three times in PBS buffer. The cells were blocked with 10% normal goat serum for 30 min. Mouse RSCs were then incubated with Nestin antibodies (1:200, Abcam, Cambridge, MA) in a humidified chamber at 4 °C overnight. After three washes with PBS buffer, the cells were incubated with FITC labeled secondary antibodies (1:500, Bioss, Beijing, China) at room temperature for 1 h, the cells were rinsed three times with PBS buffer. Finally, nuclei were labeled by incubation with 4, 6 diamidino-2-phenylindole (DAPI) (Sigma(St. Louis, MO)). The cells were examined by a phase contrast fluorescence microscope (Olympus, Kanagawa, Japan).
Proliferation assay
RSCs proliferation was analyzed by Ki67 staining, Ki67 is a nuclear non-histone protein and preferentially expressed during late G1, S, G2, and M phase of the cell cycle; while resting, non-cycling cells (G0 phase) lack Ki67 expression. RSCs (5 × 10⁴ per 12 mm coverslip) were cultured in RSCs medium. Ki67 expression in RSCs was visualized using immunofluorescence staining. Ki67-positive stem cells were counted from six random fields per coverslip in each of three independently differentiated RSC samples.
Assay of luciferase activity
The 3′UTR fragments for PTBP1 were generated by PCR using the following primers: 5′-AAGGGCAACTGTACTCACCC-3′ and 5′-CTGTTGACATAGCCCAGCCA-3′ and cloned into the psiCHECK-2 vector (Promega) downstream from the Renilla luciferase cassette. The predicted miR-9 binding site was mutated using the QuikChange II XL Site-Directed Mutagenesis Kit (Stratagene, La Jolla, CA). HEK293T cells were grown in a 96-well plate and co-transfected with the luciferase reporter vector together with a miRNA precursor or a negative control (20 nM; Ambion, Austin, TX) using Attractene (Qiagen, Hilden, Germany) according to the manufacturer’s instructions. Activities of firefly and Renilla luciferase were analyzed using the Dual-Luciferase Reporter Assay System (Promega, Fitchburg, WI) 24 h after transfection.
Expression of pre-miR-9 by recombinant Lentivirus
The sequence of pre-miR-9 was synthesized by Sangon Biotech (Shanghai, China), cloned into lentiviral vector and then used to recombine lentivirus in HEK293F cells. The lentivirus designated as pCMV-SM30 also expresses eGFP as a marker for monitoring infection efficiency. Analogous lentivirus only expressing monomeric eGFP was used as a control. Real-time PCR was used to evaluate the expression level of miR-9 after virus infection. miRNAs were isolated from cells using microRNA isolation kit (Applied Biosystems) according to the manufacturer’s instructions. cDNA synthesis was carried out with the High Capacity cDNA synthesis kit (Applied Biosystems, Carlsbad, CA) using 2 ng of RNA as a template. The miRNA sequence-specific reverse traRSCription PCR primers for miR-9 and endogenous control U6 were purchased from Ambion. Real-time PCR analysis was carried out using Applied Biosystems 7500 real-time PCR system. The gene expression threshold cycle (CT) values of miRNAs from each sample were calculated by normalizing with internal control U6 and relative quantitation values were plotted.
Real-time PCR
RNA was extracted from cells using Trizol reagent (Invitrogen, Carlsbad, CA). Total RNA was reverse transcribed, followed by 30 PCR cycles using RNA PCR kit ver 3.0 (Taraka, China). PCR was performed in a 20-μl extensre containing 10 μl SYBR premix Ex Taq buffer (Takara) , 0.4 μl ROX Reference Dye, 0.8 μM each of forward and reverse primers (Table I), 1 μl template cDNA, and 7 μl ddH2O (DaLian, LiaoNing, China). The cycling conditions consisted of an initial 10 s at 95°C, followed by 40 cycles of two-temperature cycling: 5 s at 95°C (for denaturation) and 34 s at 60°C (for annealing and polymerization). Each experiment was performed in duplicate in 96-well plates and repeated three times. Gene expression was detected on an ABI 7500 real-time PCR system. The expression level was calculated using the 2−ΔΔCt method to compare relative expression.
Western blot analysis
The PTBP1 and PTBP2 (1:500, Abcam), target genes of miR-9 were detected by western blotting. Cells were lysed using M-PER Protein Extraction Reagent (Pierce, Carlsbad, CA) supplemented with protease inhibitor cocktail (DMSF). Protein concentrations of the extracts were measured with BCA assay (Pierce) and equalized with the extraction reagent. Equal amount of the extracts was loaded and subjected to SDS–PAGE, transferred onto nitrocellulose membranes, and then blotted as previously reported (Hou et al. Citation2009). Specific antibodies and horseradish peroxidase-coupled secondary antibodies (1:1000) were purchased from Santa Cruz Biotechnology, Santa Cruz, CA. Membranes were probed using ultra-enhanced chemiluminescence western blotting detection reagents. GAPDH was used as an internal control.
Induced differentiation of RSCs into neuron cells
Neurogenic differentiation cells were divided into two groups, RSCs (group A) and RSCs after over-expressed miR-9 (group B). The cells seeded in plates using D/F12 containing 10% fetal bovine serum (Gibco). After 10 days, the cells were harvested and neural specific makers (NSE and GFAP) were detected by immunocytochemical staining. The primary antibodies were NSE and GFAP (1:200, Abcam). The secondary antibodies were conjugated with Cy5 (1:500, Bioss), 10 non-overlapped visions were randomized from induced stained cells, followed by the same data processing as that mentioned above.
Transplantation of neural cells into model of spinal cord injury
The animal model of spinal cord injury was made using Jin’s methods (Oh et al. Citation2011). Animals received cyclosporin A (10 mg/kg/day) beginning 1 day before transplantation until the end of the study. Transplantation surgeries occurred 7 day after contusion surgery. The neurogenic cells were used transplantation from miR-9 mediated neural-differentiation. RSCs were labeled using empty lentivirus (containing eGFP reporter gene). Animals were anesthetized as above, and the cell suspensions were injected along the lesion epicenter of spinal cord in a total volume of either 2.5 μl (2.5 × 10⁵ cells) at a rate of 2 μl/min. The mice were killed 2 and 4 weeks after cell transplantation under anesthesia, the location of transplanted cell was observed using histology methods in the lesion epicenter of spinal cord.
After 0, 1, 2, 3 and 4 weeks of transplantation, mice were sacrificed and then perfused with saline and 4% paraformaldehyde (Sigma). A total of 50 cross-sections with thickness of 10 μm were made from each spinal cord tissue at different time. Because lentivirus fluorescence green, we did not use immunohistochemistry to identify transplanted neuron cells. To distinguish between the injected neuron cells and control group, DAPI staining was performed as counterstaining and stained cells were observed at a wavelength of 575 nm under a fluorescence microscope.
Statistical analysis
Statistical analyses of the data were performed with a one-way ANOVA followed by the Tukey–Kramer honestly significant difference test for the three sets of results. A P value of less than 0.05 was considered significant. Statistical analyses were done with a JMP1 Statistical Discovery Software (SAS Institute, Cary, NC).
Results
Bio-characteristics of mouse RSCs
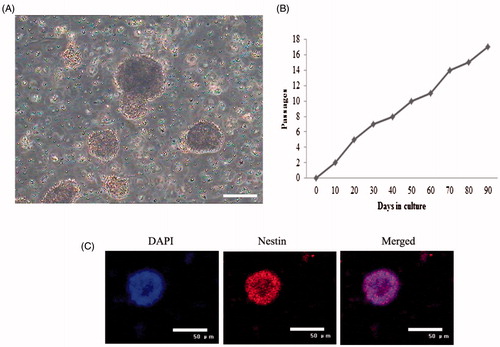
Cells derived from the dissociation of mouse retina samples were suspended in cultural medium. Assembling neurospheres were very slow and spheres were pretty small. In cultures, many single cells attached to the flasks; however, as the cells proliferated into small clusters, they detached from the plastic and floated in suspension (). These cells were maintained in culture for more than 80 days with no sign of senescence or differentiation (). The special gene of RSCs was detected by immunofluorescence assay. The results showed that different passages of mouse RSCs expressed Nestin ().
Figure 1. Bio-characteristics of mouse RSCs. (A) Morphology of mouse RSCs. (B) Proliferation potential of RSCs under the cultural conditions in vitro. RSCs proliferation was analyzed by Ki67 staining, Ki67 is a nuclear non-histone protein and preferentially expressed during late G1, S, G2, and M phase of the cell cycle; while resting, non-cycling cells (G0 phase) lack Ki67 expression. RSCs from mouse were passaged 16 times and maintained in culture for 90 days with no sign of senescence or differentiation. (C) Special gene characteristics of mouse RSCs, immunoflourescence staining results showed that mouse RSCs were positive for the Nestin (scan bar = 50 μm).
PTBP1 is a direct target of miR-9
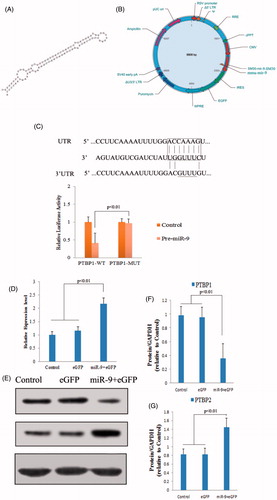
miRNA target genes are likely to have relatively long and conserved 3′UTR (Bartel Citation2009). We noticed that PTBP1 has a long evolutionarily conserved 3′UTR, so we used the TargetScan algorithm (Lewis et al. Citation2005) to search for miRNAs that could potentially regulate PTBP1. The miR-9 has putative target binding sites in PTBP1 in the mouse genome (). To directly test whether miR-9 targets PTBP1, we cloned the 3′UTRs of PTBP1 downstream of a luciferase reporter, and co-transfected these reporter constructs along with miRNA precursors into the human cell line HEK293T. Co-expression of miR-9 was found to effectively down-regulate luciferase expression in constructs with these 3′UTRs (). Mutations in the seed sequence of the predicted miR-9 binding sites within PTBP1 abolished the inhibitory effects of miR-9 on luciferase expression.
Figure 2. The function research of miRNA-9 in mouse RSCs. (A) The precursor of mmu-miR-9. (B) Diagram of recombinant lentiviral vector for pre-miR-9. (C) PTBP1 is the direct target of miR-9. miR-9 complementary sites with 3′UTR of PTBP1. The mutant sequence (PTBP1-MUT) is identical to PTBP1-WT construct except for five-point mutations disrupting base-pairing at the 5′end of miR-9 (indicated with a bar). Mutating the miR-9 target site in the 3′UTR of PTBP1 abolishes inhibition of luciferase activity by endogenous miR-9 in 293 cells. (D) RSCs were transfected with lentivirus as described in the “Methods” section, and the expression of miR-9 was quantified by real-time PCR. The expression of miR-9 was significant increase after transfection. (E) Effect of miR-9 on protein level of PBTP1 and PTBP2. (F and G) The protein expression level of PBTP1 and PTBP2 was analyzed by Image J tools.
Function analyses of miR-9
The expression of miR-9was quantified by real-time PCR after transfection 72 h. As shown in , miR-9 levels were significantly elevated after transfection. The target genes of miR-9 were predicted and analyzed using targetScan (http://www.targetscan.org/) and Panther tools (http://www.pantherdb.org/), the miR-9 sequence and its target gene sequence confirmed that PTBP1 was target genes for miR-9. shows that miR-9 targeted PTBP1 at the 3′UTR in mouse RSCs to regulate expression (). Protein expression of PTBP1, putative target genes was performed on miR-9 transfected cells according to Image J tools comparative method. Meanwhile, PTBP2, the downstream gene of PTBP1 was also detected by western blotting, and the results showed that the protein level of PTBP2 was up-regulated when down-regulation of PTBP1 (). PTBP1 is a multi-functional RNA-binding protein that is aberrantly overexpressed in glioma. PTBP1 and its brain-specific homologue polypyrimidine tract-binding protein 2 (PTBP2) regulate neural precursor cell differentiation.
Induced differentiation of mouse RSCs into neuron cells
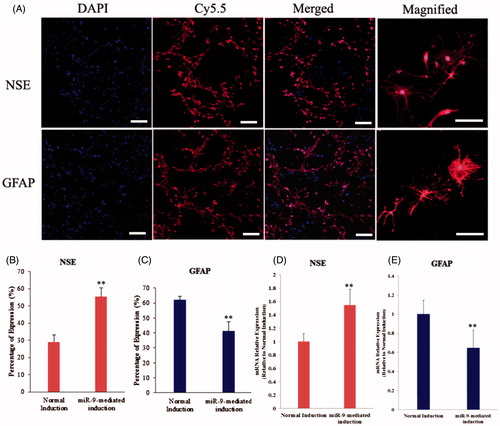
RSCs were induced differentiation into neuron cells for 10 days, following induction, the cells further contracted and became round, triangular or cone-shaped with multipolar processes. The processes continued to grow with many branches forming and cone-like terminal expansions observed. A number of cells demonstrated very long processes, which appeared similar to the long axon of neurons. After 10 days of induction, immunofluorescence assay indicated that the specific genes including NSE and GFAP were detected (). However, the productivity of neuron cells from RSCs after transfected pre-miR-9 was higher than non-overexpressed pre-miR-9 RSCs, meanwhile, transfection of miR-9 dramatically increased the percentage of NSE-positive cells, and reduced the percentage of GFAP-positive cells in vitro (). PTBP1 is a multi-functional RNA-binding protein that is aberrantly overexpressed in glioma. PTBP1 and its brain-specific homolog PTBP2 regulate neural precursor cell differentiation. Our results demonstrated that miR-9 could reduce expression level of PTBP1, increase expression level of PTBP2, and then promote the percentage of neurons in differentiation of RSCs-derived nerve cells.
Figure 3. Neurogenic differentiation of mouse RSCs. (A) Immunoflourescence staining assay indicated that the neurogenic specific genes including NSE and GFAP were positive after induction of miR-9-expressed RSCs. NSE, special marker for nerve cell, GFAP, special marker of neurogliocyte (scan bar = 50 μm). (B) The percentage of NSE expression of neuron cells from RSCs and miR-9-expressed RSCs. (C) The percentage of GFAP expression of neuron cells from RSCs and miR-9-expressed RSCs. (D and E) Gene expression of NSE and GFAP detected in differentiated RSCs. Gene expressions in each group were determined by real-time PCR and then normalized to that of control (normal induction). Data are shown as means ± SEM from three repeated (*P < 0.05, **P < 0.01).
RSCs-derived neuron cells take part in mouse spinal cord recovery
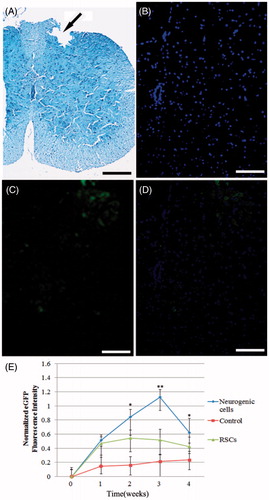
Neuron cells from RSCs of pre-miR-9 over-expression were used to transplant and take part in tissue regeneration in spinal cord injury. To test whether transplantation of RSCs or neuron cells taken part in recovery of spinal cord, cross-sections were used to observed the location for transplantation of neuron cells in scathing spinal cord. eGFP was used as a label to discover the RSCs-derived neuron cells in tissue of spinal cord. The results demonstrated that RSCs, RSCs-derived neuron cells could take part in recovery of spinal cord injury (). Mice spinal cord tissue was obtained 1, 2, 3 and 4 weeks after transplantation into the injured spinal cord. Optical density analysis showed a greater number of neuron cells (eGFP) in the spinal tissue of mice that had both cell treatment group and control group (). The higher survival of neuron cells transplanted was maintained four weeks after transplantation. In the experiment to confirm the location of neuron cells, it was observed that neuron cells planted in middle and lateral part of the injured spinal cord.
Figure 4. Transplantation of mice RSCs, RSCs-derived neuron cells resulted in cell survival, limited redistribution from site of implantation. (A) Spinal cord contusion injury resulted in a loss of tissue structure within the central region of the spinal cord by 2 week post-injury. Injury region were marked using black arrow, the pathological tissue was formed after injury, and dropped out when tissue sliced. (B–D) Cell track showing transplanted cells (eGFP) located primarily within the region of the spinal cord injury (scan bar = 100 μm). (E) Optical density analysis showed a greater number of RSCs, RSCs-derived neuron cells in the spinal tissue of mice in both cell treatment group and control group. The higher survival of RSCs and RSCs-derived neuron cells transplantation was maintained 4 weeks, 0 week as a control (*P < 0.05, **P < 0.01).
Discussion
Cell therapy has emerged as a strategy for the treatment of many diseases. At present, tissue stem cells were tentatively expanded and orientationally induced in vitro to some seed cells that are needed, which are then transplanted into patients to repair damage, to replace regressive tissue and improve the function of hereditarily defective tissue. The transplantation of hematopoietic stem cell has been widely used in the treatment of hematopoietic malignent diseases, which provides an exemplification for the study of tissue stem cells. It was reported that stem cells could be used to repair and reconstruct some tissues such as bone retina, cornea and brain (Pereira et al. Citation1998). MiRNAs are small non-coding RNAs that are cleaved from 70–100 nucleotide (nt) hairpin pre-miRNA precursors in the cytoplasm by RNaseIII Dicer into their mature form of 19–25 nt. Single-stranded miRNAs bind messenger RNAs of potentially hundreds of genes at the region of 3′UTR with perfect or near perfect complementarity, resulting in degradation or inhibition of the target messenger RNA (Bloomston et al. Citation2007). MiRNAs are fundamental biological molecules that have been shown to play important roles in biological development (Ruvkun et al. Citation2004).
This study demonstrates that miR-9 has an important role in RSC differentiation and that PTBP1 is a key target of miR-9 in RSCs. Every miRNA could have multiple target genes (Lewis et al. Citation2003, Citation2005), indeed, several target genes have been predicted and some tested for miR-9, including those encoding the traRSCription factors TLX, REST, FoxG1, Senseless and Hairy/E (spl), and components of the FGF signaling pathway (Conaco et al. Citation2006, Leucht et al. Citation2008, Li et al. Citation2006, Wu and Xie Citation2006, Zhao et al. Citation2009). One of the questions addressed here is whether the cell differentiation effect mediated by miR-9 in RSCs is directly related to repression of PTBP1 expression. The result of this experiment suggests that miR-9 regulates RSCs differentiation through repression of PTBP1 expression. Although PTBP1 is an important target gene of miR-9, other targets may also have a role in miR-9 function in RSCs. miR-9 induced embryonic stem cells to differentiate into neuronal which mechanism was it down-regulated the level of PTBP1.The expression patterns and RNA-binding sites of both PTBP1 and its homolog, PTBP2 (also known as nPTB or brPTB) imply that they have similar, but distinct roles in brain development and function. In the mammalian fetal brain, PTBP1 and PTBP2 are expressed at high levels and then both transcripts decrease in the mature adult brain where staining patterns become mutually exclusive: PTBP1 in glial cells and PTBP2 mostly in neurons (Cheung et al. Citation2009). Therefore, PTBP1 was selected for analyzing the function of miR-9 according to prediction of Targetscan tools in this research. Our results demonstrated miR-9 could promote the percentage of neurons in differentiation of RSCs-derived nerve cells.
Transfection of miR-9 dramatically increased the percentage of NSE-positive cells, and reduced the percentage of GFAP-positive cells in vitro. Previous studies have shown that miR-9 overexpression represses cell proliferation and promotes neuronal differentiation in medulloblastoma (Pierson et al. Citation2008). In this study, we detected the function of miR-9 in differentiation of neuron cells from RSCs and performed the RSCs into neuron cells in vitro. The results demonstrated that miR-9 could promote the productivity of neuron cells from RSCs and increased the percentage of NSE-positive cells in vitro. And then RSCs-derived neuron cells were transplanted into injured spinal for transplantation, and successfully participated in neural restoration.
Declaration of interest
The authors have declared that there is no conflict of interest.
References
- Bartel DP. 2004. MicroRNAs: genomics, biogenesis, mechanism, and function. Cell. 116:281–297.
- Bartel DP. 2009. MicroRNAs: target recognition and regulatory functions. Cell. 136:215–233.
- Bloomston M, Frankel WL, Petrocca F, Volinia S, Alder H, Hagan JP, et al. 2007. MicroRNA expression patterns to dsifferentiate pancreatic adenocarcinoma from normal pancreas and chronic pancreatitis. JAMA. 297:1901–1908.
- Calin GA, Croce CM. 2006. MicroRNA-cancer connection: the beginning of a new tale. Cancer Res. 66:7390–7394.
- Carmell MA, Xuan Z, Zhang MQ, Hannon GJ. 2002. The Argonaute family: tentacles that reach into RNAi, developmental control, stem cell maintenance, and tumorigenesis. Genes Dev. 16:2733–2742.
- Cheung HC, Hai T, Zhu W, Baggerly KA, Tsavachidis S, Krahe R, Cote GJ. 2009. Splicing factors PTBP1 and PTBP2 promote proliferation and migration of glioma cell lines. Brain. 132:2277–2288.
- Conaco C, Otto S, Han JJ, Mandel G. 2006. Reciprocal actions of REST and a microRNA promote neuronal identity. Proc Natl Acad Sci USA. 103:2422–2427.
- Coolen M, Thieffry D, Drivenes O, Becker TS, Bally-Cuif L. 2012. miR-9 controls the timing of neurogenesis through the direct inhibition of antagonistic factors. Dev Cell. 22:1052–1064.
- Dajas-Bailador F, Bonev B, Garcez P, Stanley P, Guillemot F, Papalopulu N. 2012. microRNA-9 regulates axon extension and branching by targeting Map1b in mouse cortical neurons. Nat Neurosci. 15:697–699.
- Deo M, Yu JY, Chung KH, Tippens M, Turner DL. 2006. Detection of mammalian microRNA expression by in situ hybridization with RNA oligonucleotides. Dev Dyn. 235:2538–2548.
- Hirakata S, Siomi MC. 2015. piRNA biogenesis in the germline: from transcription of piRNA genomic sources to piRNA maturation. Biochim Biophys Acta. [Epub ahead of print]. doi: 10.1016/j.bbagrm.2015.09.002.
- Hou J, Wang P, Lin L, Liu X, Ma F, An H, Wang Z, Cao X. 2009. MicroRNA-146a feedback inhibits RIG-I-dependent type I IFN production in macrophages by targeting TRAF6, IRAK1, and IRAK2. J Immunol. 183:2150–8.
- Houbaviy HB, Murray MF, Sharp PA. 2003. Embryonic stem cell-specific microRNAs. Dev Cell. 5:351–358.
- Hu Y, Luo M, Ni N, Den Y, Xia J, Chen J, et al. 2014. Reciprocal actions of microRNA-9 and TLX in the proliferation and differentiation of retinal progenitor cells. Stem Cells Dev. 23:2771–2781.
- Kloosterman WP, Plasterk RH. 2006. The diverse functions of microRNAs in animal development and disease. Dev Cell. 11:441–450.
- Krichevsky AM, King KS, Donahue CP, Khrapko K, Kosik KS. 2003. A microRNA array reveals extensive regulation of microRNAs during brain development. RNA. 9:1274–1281.
- Lagos-Quintana M, Rauhut R, Yalcin A, Meyer J, Lendeckel W, Tuschl T. 2002. Identification of tissue-specific microRNAs from mouse. Curr Biol. 12:735–739.
- Leucht C, Stigloher C, Wizenmann A, Klafke R, Folchert A, Bally-Cuif L. 2008. MicroRNA-9 directs late organizer activity of the midbrain–hindbrain boundary. Nat Neurosci. 11:641–648.
- Lewis BP, Burge CB, Bartel DP. 2005. Conserved seed pairing, often flanked by adenosines, indicates that thousands of human genes are microRNA targets. Cell. 120:15–20.
- Lewis BP, Shih IH, Jones-Rhoades MW, Bartel DP, Burge CB. 2003. Prediction of mammalian microRNA targets. Cell. 115:787–798.
- Li Y, Wang F, Lee JA, Gao FB. 2006. MicroRNA-9a ensures the precise specification of sensory organ precursors in Drosophila. Genes Dev. 20:2793–2805.
- Nakagawa S. (2015). Lessons from reverse-genetic studies of lncRNAs. Biochim Biophys Acta. [Epub ahead of print]. doi: 10.1016/j.bbagrm.2015.06.011.
- Oh JS, Kim KN, An SS, Pennant WA, Kim HJ, Gwak SJ, et al. 2011. Cotransplantation of mouse neural stem cells (mNSCs) with adipose tissue-derived mesenchymal stem cells improves mNSC survival in a rat spinal cord injury model. Cell Transplant. 20:837–849.
- Otaegi G, Pollock A, Sun T. 2011. An optimized sponge for microRNA miR-9 affects spinal motor neuron development in vivo. Front Neurosci. 5:146.
- Pereira PL, Roche AJ, Maier GW, Huppert PE, Dammann F, Farnsworth CT, Duda SH, Claussen CD. 1998. Insulinoma and islet cell hyperplasia: value of the calcium intraarterial stimulation test when findings of other preoperative studies are negative. Radiology. 206:703–709.
- Pierson J, Hostager B, Fan R, Vibhakar R. (2008). Regulation of cyclin dependent kinase 6 by microRNA 124 in medulloblastoma. J Neurooncol. 90:1–7.
- Pietrzykowski AZ, Friesen RM, Martin GE, Puig SI, Nowak CL, Wynne PM, Siegelmann HT, Treistman SN. 2008. Posttranscriptional regulation of BK channel splice variant stability by miR-9 underlies neuroadaptation to alcohol. Neuron. 59:274–287.
- Ruvkun G, Wightman B, Ha I. 2004. The 20 years it took to recognize the importance of tiny RNAs. Cell. 116:S93–S96.
- Shibata M, Nakao H, Kiyonari H, Abe T, Aizawa S. 2011. MicroRNA-9 regulates neurogenesis in mouse telencephalon by targeting multiple transcription factors. J Neurosci. 31:3407–3422.
- Shukla GC, Singh J, Barik S. 2011. MicroRNAs: processing, maturation, target recognition and regulatory functions. Mol Cell Pharmacol. 3:83–92.
- Suh MR, Lee Y, Kim JY, Kim SK, Moon SH, Lee JY, et al. 2004. Human embryonic stem cells express a unique set of microRNAs. Dev Biol. 270:488–498.
- Tan X, Wang S, Yang B, Zhu L, Yin B, Chao T, et al. 2012. The CREB-miR-9 negative feedback minicircuitry coordinates the migration and proliferation of glioma cells. PLoS One. 7:e49570.
- Wienholds E, Koudijs MJ, van Eeden FJ, Cuppen E, Plasterk RH. 2003. The microRNA-producing enzyme Dicer1 is essential for zebrafish development. Nat Genet. 35:217–218.
- Wu J, Xie X. 2006. Comparative sequence analysis reveals an intricate network among REST, CREB and miRNA in mediating neuronal gene expression. Genome Biol. 7:R85.
- Zhai L, Sun W, Zhang K, Jia H, Liu L, Liu Z, Teng F, Zhang Z. 2014. Identification and characterization of Argonaute gene family and meiosis-enriched Argonaute during sporogenesis in maize. J Integr Plant Biol. 56:1042–1052.
- Zhao J, Lin Q, Kim KJ, Dardashti FD, Kim J, He F, Sun Y. 2015. Ngn1 inhibits astrogliogenesis through induction of miR-9 during neuronal fate specification. Elife. 4. doi:10.7554/eLife.06885.
- Zhao C, Sun G, Li S, Shi Y. 2009. A feedback regulatory loop involving microRNA-9 and nuclear receptor TLX in neural stem cell fate determination. Nat Struct Mol Biol. 16:365–371.
- Zhao C, Sun G, Ye P, Li S, Shi Y. 2013. MicroRNA let-7d regulates the TLX/microRNA-9 cascade to control neural cell fate and neurogenesis. Sci Rep. 3:1329.