
Abstract
In breast cancer, a proper biomarker for the assessment of metastasis and poor prognosis is the RNA of activated leukocyte cell adhesion molecule (ALCAM) gene, which is expressed at high levels in breast tumor. We applied DNA-functionalized gold nanoparticles as the target-specific probes, for detecting specific sequences of DNA or RNA. At high MgCL2 concentrations, nanoprobes aggregate in the absence of the complementary DNA sequence and alteration in the solution color is detectable by evaluating the localized surface plasmon resonance (LSPR). But in the presence of complementary DNA, nanoprobes hybridize to the complementary sequence; therefore, no aggregation takes place, and no color change is observed. We designed a gold nanoprobe-based method that promptly detects the ALCAM gene expression in a low reaction volume with high sensitivity and specificity. This method is simple, fast, selective, and quantitative and can be done with small concentrations of the target (fmol/μL). Limit of detection of the method corresponded to 300 fmol/μL of synthetic ALCAM target.
Keywords:
Introduction
Breast cancer is the most prevalent cancer in women. Nearly 1 in 3 cancer cases of women are diagnosed with this type of cancer. The second leading cause of cancer mortality in women is breast cancer (DeSantis et al. Citation2014). A biomarker is a characteristic, that is, accurately quantified and assessed as an indicator of specific circumstances. In cancer, a biomarker may be a molecule, that is, secreted by the tumor or it might be a particular response of the body to the existence of cancer (Mishra and Verma Citation2010). It may be a protein, a part of a protein, DNA, RNA, or a basic chemical produced by abnormal cells. It gives information about the basic mechanism of the initiation of the cancer and suggests great methods for diagnosing and curing the tumor at the right time (Swierczewska et al. Citation2012). A proper biomarker for the assessment of metastasis and poor prognosis in breast cancer is the RNA of activated leukocyte cell adhesion molecule (ALCAM) gene. This biomarker is detectable in the tumor of patients with breast cancer based on several studies (Ihnen et al. Citation2010, Piao et al. Citation2012, Witzel et al. Citation2012). ALCAM, a member of the immunoglobulin superfamily, is a cell surface immunoglobulin that acts as a cell-to-cell adhesion molecule. It is a transmembrane glycoprotein receptor. CD166/ALCAM was identified as one of the most highly up-regulated genes among cell-adhesion molecules (Ishiguro et al. Citation2012, Zhou et al. Citation2011). ALCAM expressed at extreme levels in breast tumor. The high membranous expression probably caused weakened adherent ability and metastasis and high cytoplasmic expression reinforced invasive ability of malignant cells, promoting tumor development (Piao et al. Citation2012). ALCAM has gained growing attention because of its important association with tumor progression and metastasis (Zhou et al. Citation2011). ALCAM protects breast cancer cells against apoptosis and autophagy. Diminished expression of ALCAM is linked with the induction of two types of programed cell death, apoptosis, and autophagy, in breast cancer cells. It can be considered as a new breast cancer indicator and therapeutic target (Jezierska et al. Citation2006). Nanotechnology is an advancing field of science. Its progress can have a spectacular influence on medicine (Zdrojewicz et al. Citation2015). It regards structures with approximately 1–100 nm size in at least one dimension (Farokhzad and Langer Citation2009). Nanomaterials are appropriate for biosensing applications. Having high specific surface is one of their general excellences (Abbasi et al. Citation2016). Among the metal nanoparticles, gold nanoparticles are mostly applied for biosensing purposes owing to their biocompatibility, their electronic and optical properties, and their simple production and alteration. These impressive properties made gold nanoparticles valuable candidates for many research fields. Gold nanoparticles are various in sizes, shape, and structure, and diverse formulations have been developed for different treatment applications. In spite of outstanding accomplishment in breast cancer treatment, some impediments still exist. Gold nanoparticles may be valuable in addressing these obstacles due to their unique characteristics, such as enhanced permeability and retention in tumor, interaction with radiation to produce secondary electrons, light absorbance and surface Plasmon resonance in near-infrared light, and potency to be conjugated with drugs or other agents (Lee et al. Citation2014). Different compounds including nucleic acids can be anchored onto the surface of gold nanoparticles through the strong metal–ligand interaction among sulfur and gold. The mentioned S–Au interaction is partly covalent (∼35%) and mainly electrostatic (∼65%) (Ding et al. Citation2014).
DNA-functionalized gold nanoparticles utilized as the target-specific probes and have the most important applications among nanoparticles. These systems can be applied for the detection of specific sequences of DNA or RNA (Doria et al. Citation2007). Adsorbing single-stranded DNA on negatively charged AuNPs occurs with the speed affected by sequence length and temperature. After adsorption, the particles are resistant to salt-induced aggregation. These findings form the basis for a colorimetric assay to recognize specific sequences of nucleic acids (Nelson and Rothberg Citation2011). The gold nanoparticles are wine red (Liu et al. Citation2014) and the nanoprobes solution reveals a red color too, due to having the surface Plasmon resonance at an absorbance peak of the AuNPs. At high MgCL2 concentrations, nanoprobes aggregate in the absence of the complementary DNA sequences and alter the solution color to purple. If the nanoprobes hybridize to the complementary sequences, no nanoprobe aggregation is observed, and the mixture stays red (Baptista et al. Citation2006).
Gold nanoparticles have net negative charge on the surface; therefore, the nanoparticles repulse each other and remain dispersed in the solution. By adding salt, the repulsive force is neutralized and the nanoparticles aggregation is observed. When nanoprobes hybridize to the target sequences, due to the negative charge of phosphate groups of nucleic acids, the negative charge of the gold nanoparticles is boosted. Therefore, after adding salt, resistance to aggregation occurs and the dispersion of the solution is preserved. The higher concentration of the target sequences leads to more dispersion of the solution. One of the advantages of our method is the fact that no PCR and electrophoresis and no expensive equipment is needed (Eatemadi et al. Citation2016).
As it is cited previously, ALCAM RNA detection is important in breast cancer. Thus, we designed a gold nanoprobe-based technique that enabled us to detect the ALCAM gene expression in a low reaction volume with high sensitivity and specificity. This simple and fast method can be done with small concentrations of the target (fmol/μL).
Materials and methods
Materials
The following chemicals were bought from Sigma-Aldrich (Berlin, Germany): tetrachloroauric acid (HAuCl4ċ3H2O), trisodium citrate, Na2HPO4, NaH2PO4. MgCl2, NaOH, SDS, and TCEP [tris (2-carboxyethyl)-phosphine] were supplied by Merck, Germany. Tris HCl was bought from Scharlau. NaCl was obtained from Panreac. Oligonucleotides were purchased from Bioneer, South Korea. The water used for all procedures was of Milli-Q quality. Aqua regia (3 parts HCl: 1 part HNO3) and ultra-high clarity water were used for cleaning all glassware.
Apparatus
A nanodrop-ND 1000 spectrophotometer (Thermo Fisher Scientific) and a UV–visible spectrophotometer (Bioaquarius, model CE7,250, CECIL Co. UK) were used to determine the absorbance of solutions containing AuNPs. A tunneling electron microscope (Philips EM 208, Phillips, Cardiff, UK) and Digimizer software version 4 (MedCalc Software, Belgium) were utilized for determining the size of the synthesized nanoparticles. Ultrapure water (18 MΏ water) was set by applying a deionizer (model R.101.D, from Absaz Co, Iran). A WiseClean WUC Digital Ultrasonic Cleaner-set (PMI-Labortechnik GmbH, model WUC-D 10H) was used for sonication.
Synthesis of gold nanoparticles
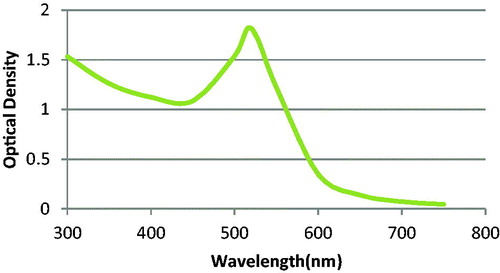
At first, all glassware were treated with an aqua regia solution, washed with Milli-Q water and dried inside an oven at 120 °C. Gold nanoparticles were synthesized based on Turkevich method. After boiling 50 mL of 1 mM HAuCl4 solution, 5 mL of 38.8 mM trisodium citrate solution was rapidly added with intense stirring in 900 rpm. The mixture was boiled and stirred for 10 min and the color turned into ruby red. The mixture was cooled to room temperature. The nanoparticle solution was stored in the dark at 4 °C (Chen et al. Citation2013). The λmax of prepared AuNPs was determined by evaluating their absorbance in the range of 300–800 nm. As it is illustrated in , the λmax revealed by the curve was 520 nm. We made six serially diluted samples of freshly synthesized AuNPs solution. Then, we recorded optical density (OD) of each sample at the predetermined λm (520 nm). The line equation of the curve was obtained and the concentration was calculated based on Beer–Lambert law ().
Figure 1. The absorbance spectra of synthesized AuNPs with the absorption peak at 520 nm.
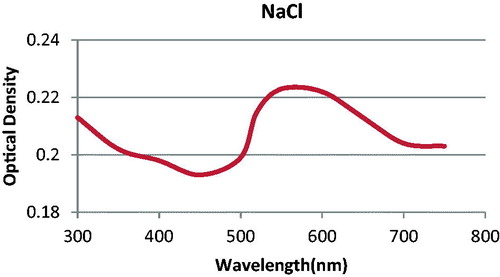
Some droplets of NaCl (6 M) solution were added to a sample of synthesized AuNPs. After some seconds the color of the solution turned to blue (Bergen et al. Citation2006). This aggregation that induced by salt showed the applicability of prepared AuNPs. Then, the difference between localized surface Plasmon resonance (LSPR) spectra of two samples was assessed by evaluating their absorbance in the range of 300–800 nm.
The size and morphology of the synthesized nanoparticles were studied by transmission electron microscopy (TEM) (Chandran et al. Citation2006). First, several droplets of the gold nanoparticle solution was sonicated. Then, it was put on a carbon grid, and after drying, the images were taken with 90 or 100 Kv power. The mean size of particles was obtained by measurement of their diameter in the captured TEM images using Digimizer software version 4 (Pourhassan-Moghaddam et al. Citation2014a).
Designing of the probe and target sequences
ALCAM RNA has four different splice variants. Thus, the consensus area was found and the sequences were designed based on this consensus region. The probe and target sequences were picked on the exon–exon junctions, so it was specific for the ALCAM RNA. Choosing target from palindromic and repetitive regions was prevented. Due to the fact that stable secondary structures interfere with the accurate and effective hybridization between probe and target, the formation of secondary structures was checked. The probe had 17 nucleotides that were continued by 10 adenine bases. The adenine region was between the 5′ end and the thiol group. This region caused flexibility of conjugated probes; consequently, the efficacy of hybridization was boosted (Pourhassan-Moghaddam et al. Citation2014b). The thiol group at 5′ end was designed for conjugation with the AuNPs (Daraee et al. Citation2015). A sequence from hnRNPB1 RNA was designed and applied as a negative control during the detection reaction as it is illustrated in (Daraee et al. Citation2015).
Table 1. Sequences of probe, target, and negative control
Preparation of gold nanoprobes
Before starting the procedure, all the containers were treated with DEPC-treated water.
At first, we prepared the solutions that are listed below:
Phosphate buffer (PB) with pH 8: 9.32 mM Na2HPO4, 0.68 mM NaH2PO4.
AGE I: 2% (w/v) SDS, 10 mM phosphate buffer (pH8).
AGE II: 1.5 M NaCl, 2% (w/v) SDS, 10 mM phosphate buffer (pH8). PBS (phosphate-buffered saline): 0.1 M NaCl, 10 mM phosphate buffer (pH8)
The first step was reduction of thiolated probes with TCEP [tris (2-carboxyethyl) phosphine] at 20:1 molar ratio for 2 h at 25 °C while shaking at 120 rpm. For this step, we mixed we mixed 8 μL of 200 p.m. solution of desired probes (1.6 nmol) with 1 μL of TCEP (34 Mm). Then, we mixed reduced probes with 1 mL AuNP solution inside a NaOH-treated glass container. About 5.04 μL of AGEI solution was added gradually and mixed gently; sonicated for 10 s and incubated at 25 °C for 20 min while shaking at 65 rpm. Then, 34.7 μL of AGEII solution was added gradually and mixed gently; sonicated for 10 s and incubated at 25 °C for 20 min while shaking at 65 rpm. Then, 39.94 μL, 43 μL, 46.46 μL, and 50.34 μL of AGEII solution was added in order, Sonicated for 10 s and incubated at 25 °C for 20 min while shaking at 65 rpm.
In the next step, the solution was incubated for 20 h at 25 °C while shaking at 65 rpm with shaker incubator. Then, the solution was centrifuged in 13,500 g for 20 min at 4 °C and the supernatant was discarded very carefully. At that stage, an oily red pellet was formed. The red oily pellet confirmed the successful conjugation. The red pellet was dissolved in 1 mL PB, centrifuged in 13,500 g for 20 min at 4 °C and the supernatant was discarded very carefully twice. The red pellet was dissolved in 1 mL PBS and stored at 4 °C in the dark until use. The concentration of the prepared nanoprobe was assessed by visible spectrometry and the Beer–Lambert law.
Two methods were used for the confirmation of conjugation. One of them was based on salt-induced aggregation of gold nanoparticles. The nanoprobes resisted to salt-induced aggregation. For resistance test, 10 μL nanoprobes were mixed with 2 μL MgCl2 (10 mM). It was incubated for 10 min at 25 °C. 10 μL unconjugated nanoparticles were mixed with 2 μL MgCl2 (10 mM) and incubated for 10 min at 25 °C. Then, the aggregation was evaluated by recording the changes in the absorption spectra in the range of 250–750 nm range by Nanodrop ND 1000 spectrophotometer. In second method of confirmation, the quantity of conjugated probes was achieved. About 10 μL nanoprobes was blended with 10 μL TCEP solution. We put the solution in shaker incubator for 48 h at 120 rpm at 25 °C. It was centrifuged in 13,500 g for 30 min and the supernatant was collected. The concentration of released probes was determined by Nanodrop ND 1000 spectrophotometer.
Target detection
Before sensing the target, the lowest concentration of MgCl2 needed for full aggregation of the prepared nanoprobes was measured. At first, we mixed nanoprobe with phosphate buffer. About 2.5 μL of nanoprobe was incubated for 10 min at 65 °C, 10 min at 55 °C, and 20 min at 25 °C. Then, several concentrations of MgCl2 (0–100 mM) were added to the mixture and was incubated for 15 min at 25 °C. At last, the absorption was noted by the NanoDrop-ND 1000 spectrophotometer in the spectral range of 250 nm to 750 nm. The minimum concentration of the MgCl2 that caused OD600 nm/OD520 nm >1 was selected for the next step. OD600 nm/OD520 nm >1 was a sign of complete aggregation and achieved by 80 mM MgCl2 (Pourhassan-Moghaddam et al. Citation2014b).
For sensing of the target, 2.5 μL of nanoprobe was mixed with different concentrations of target (150, 300, 450, 600, 750, and 900 fmol/μL). The solutions were incubated for 10 min at 65 °C, 10 min at 55 °C, and 20 min at 25 °C. The desired MgCl2 concentration was added to them. The mixtures were incubated for 15 min at 25 °C. Finally, the absorbance of solutions was evaluated in the 250 nm to 750 nm spectral range, with a ND 1000 spectrophotometer. Also, the negative control (nanoprobe plus 900 fmol/μL hnRNPB1), the blank (nanoprobe plus 80 mM MgCl2 and with no target), and the dispersion (nanoprobe plus phosphate buffer) were assessed simultaneously (Daraee et al. Citation2015). The pH of the solutions was 8 and the reactions were done at room temperature. The ionic strength of the MgCl2 was 3.
Statistical analysis
The dispersion % (D %) – or resistance percentage – for each mixture was calculated with this formula after performing three repeats for each mixture (Conde et al. Citation2010):
ΔOD is the difference between OD of the reaction at 520 nm and 600 nm, s is sample, b is blank, and d is dispersion.
Limit of detection (LOD) was calculated by the following formula:
Results and discussion
Synthesis of gold nanoparticles
For testing the applicability of synthesized nanoparticles, we checked salt-induced aggregation. For this reason, we used a few droplets of 6 M NaCl. After adding the salt, the color of the gold nanoparticles altered to blue. This change in the color was a sign of aggregation that was confirmed by showing the difference between localized surface Plasmon resonance (LSPR) spectra of two samples, via evaluating their absorbance in the range of 300–800 nm. The λmax of the solution was 550 nm ().
Figure 2. The absorbance spectra of synthesized AuNPs after adding NaCl with the absorption peak at 550 nm.
Transmission electron microscopy (TEM) was utilized for studying the size and morphology of the synthesized nanoparticles. The pictures showed that the mean size of the AuNPs was 12–14 nm. The size of prepared nanoparticles was appropriate for diagnostic purposes ().
Figure 3. TEM micrograph of synthesized AuNPs.
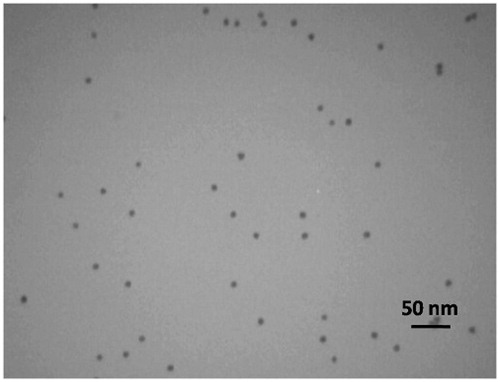
Figure 4. Curve of different concentrations of gold nanoparticles and line equation of the curve.
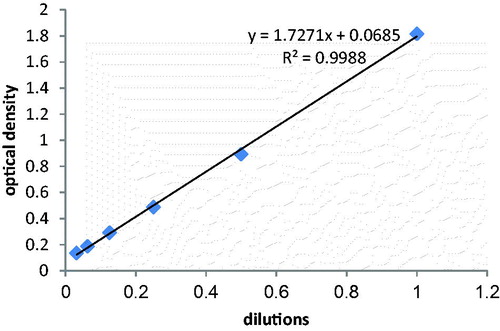
The solution of AuNPs was diluted and the absorbance of each solution was calculated by a UV–visible spectrophotometer in 520 nm. The molar concentration of the prepared AuNPs was 21 nm according to the Beer–Lambert law.
Designing of the probe and target sequences
The sequences were selected from the consensus region of four different splice variants. The sequences of oligonucleotides are listed in . The probe sequence was designed with a polyA spacer (10 Adenine) and a thiol linker to ease conjugation with AuNPs (Fallahzadeh et al. Citation2010).
Preparation of nanoprobes and verification of conjugation
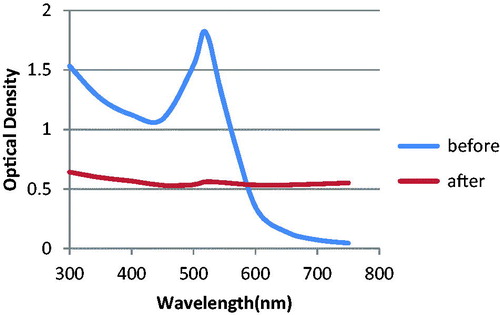
The concentration of the nanoprobes (3.6 nm) was determined by visible spectrometry using the Beer–Lambert law. Localized surface Plasmon resonance of nanoprobes had similar shape with the LSPR of unconjugated AuNPs. When we added MgCl2, there was a significant change in the absorbance spectrum of unconjugated AuNPs in comparison with nanoprobes. This was a sign of successful conjugation between AuNPs and the probes. Since after adding MgCl2, the nanoprobes showed resistance to MgCl2-induced aggregation ().
Figure 5. The absorbance spectra of synthesized AuNPs, before and after adding MgCl2.
Target detection
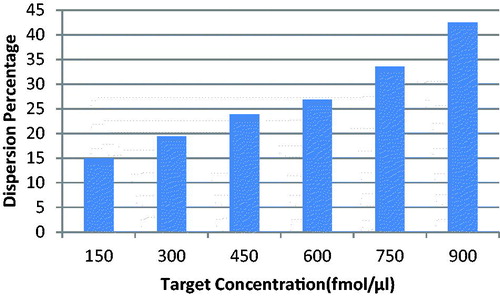
When nanoprobes were added to the solutions that contained target sequences, the nanoprobes bound to the target. This fact caused a high negative charge around the nanoparticles. So after adding MgCl2, resistance happened instead of nanoparticle aggregation (). If the solution did not contain target sequences, there would be no nanoprobe binding. That is why we did not observe resistance to aggregation after adding MgCl2, in solutions with no target. If the concentration of the target was higher; the resistance to aggregation was stronger. So the results of our study showed that the dispersion percentage augmented as the concentration of the target sequences increased (). The dispersion percentage of the negative control sample (hnRNPB1) was less than the dispersion percentage of the lowest concentration of ALCAM target. The method had a high sensitivity, due to the fact that limit of detection of the method corresponded to 300 fmol/μL of ALCAM target ().
Figure 6. The absorbance spectra of prepared nanoprobes, before and after adding MgCl2.
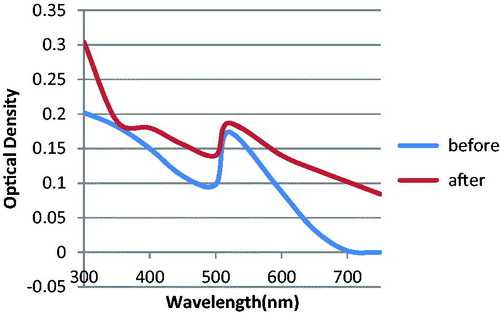
Figure 7. The absorbance spectra of different concentrations of target, negative control and dispersion solution after adding gold nanoprobes.
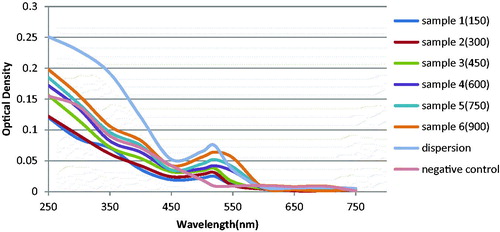
Figure 8. Detection of different concentrations of ALCAM target by nanoprobes.
Conclusion
Due to the high incidence of breast cancer and the importance of the stage of disease in treatment outcome, it is necessary to apply new methods for the detection of breast cancer biomarkers. ALCAM RNA is a proper biomarker for assessment of metastasis and poor prognosis in this type of cancer, which can be detected by our gold nanoprobe-based method with high sensitivity. This method is simple, rapid, selective, quantitative, and cost-effective and can be done in low-resources laboratories.
Funding information
The authors thank Immunology Research Center of Tabriz University of medical sciences and Iran Nanotechnology Initiative Council for financial supports.
Acknowledgements
The authors would like to thank the Department of Medical Biotechnology and the Department of medical Nanotechnology in the Faculty of Advanced Medical Science of Tabriz University of medical sciences, for technical support.
Disclosure statement
The authors report no conflicts of interest.
References
- Abbasi E, Akbarzadeh A, Kouhi M, Milani M. 2016. Graphene: Synthesis, bio-applications, and properties. Artif Cells Nanomed Biotechnol. 44:150–156.
- Baptista PV, Koziol-Montewka M, Paluch-Oles J, Doria G, Franco R. 2006. Gold-nanoparticle-probe-based assay for rapid and direct detection of Mycobacterium tuberculosis DNA in clinical samples. Clin Chem. 52:1433–1434.
- Bergen JM, von Recum HA, Goodman TT, Massey AP, Pun SH. 2006. Gold nanoparticles as a versatile platform for optimizing physicochemical parameters for targeted drug delivery. Macromol Biosci. 6:506–516.
- Chandran SP, Chaudhary M, Pasricha R, Ahmad A, Sastry M. 2006. Synthesis of gold nanotriangles and silver nanoparticles using Aloe vera plant extract. Biotechnol Prog. 22:577–583.
- Chen Z, Wang Z, Chen X, Xu H, Liu J. 2013. Chitosan-capped gold nanoparticles for selective and colorimetric sensing of heparin. J Nanopart Res. 15:1–9.
- Conde J, de la Fuente JM, Baptista PV. 2010. RNA quantification using gold nanoprobes - application to cancer diagnostics. J Nanobiotechnol. 8:5.
- Daraee H, Pourhassanmoghadam M, Akbarzadeh A, Zarghami N, Rahmati-Yamchi M. 2015. Gold nanoparticle–oligonucleotide conjugate to detect the sequence of lung cancer biomarker. Artif Cells Nanomed Biotechnol. [Epub ahead of print]. doi: 10.3109/21691401.2015.1031905.
- DeSantis C, Ma J, Bryan L, Jemal A. 2014. Breast cancer statistics, 2013. CA Cancer J Clin. 64:52–62.
- Ding Y, Jiang Z, Saha K, Kim CS, Kim ST, Landis RF, Rotello VM. 2014. Gold nanoparticles for nucleic acid delivery. Mol Ther. 22:1075–1083.
- Doria G, Franco R, Baptista P. 2007. Nanodiagnostics: fast colorimetric method for single nucleotide polymorphism/mutation detection. IET Nanobiotechnol. 1:53–57.
- Eatemadi A, Daraee H, Zarghami N, Melat Yar H, Akbarzadeh A. 2016. Nanofiber: Synthesis and biomedical applications. Artif Cells Nanomed Biotechnol 44:111–121.
- Fallahzadeh S, Bahrami H, Akbarzadeh A, Tayarani M. 2010. High-Isolation Dual-Frequency Operation Patch Antenna Using Spiral Defected Microstrip Structure. IEEE Antenn Wireless Propag Lett 9:122–124.
- Farokhzad OC, Langer R. 2009. Impact of nanotechnology on drug delivery. ACS Nano. 3:16–20.
- Ihnen M, Kohler N, Kerstenc JF, Milde-Langoscha K, Becka K, Holler S, et al. 2010. Expression levels of activated leukocyte cell adhesion molecule (ALCAM/CD166) in primary breast carcinoma and distant breast cancer metastases. Dis Markers. 28:71–78.
- Ishiguro F, Murakami H, Mizuno T, Fujii M, Kondo Y, Usami N, et al. 2012. Activated leukocyte cell-adhesion molecule (ALCAM) promotes malignant phenotypes of malignant mesothelioma. J Thorac Oncol. 7:890–899.
- Jezierska A, Wojciech M, Tomasz M. 2006. ALCAM/CD166 protects breast cancer cells against apoptosis and autophagy. Med Sci Monitor Basic Res. 12: BR263–BR273.
- Lee J, Chatterjee DK, Lee MH, Krishnan S. 2014. Gold nanoparticles in breast cancer treatment: Promise and potential pitfalls. Cancer Lett. 347:46–53.
- Lee B, Kate YJ, Wang Y, Nie S. 2015. In vitro study of a pH-sensitive multifunctional doxorubicin–gold nanoparticle system: therapeutic effect and surface enhanced Raman scattering. RSC Adv. 5:65651–65659.
- Liu G, Ren H, Guan Y, Dai R, Chai C. 2014. Development of a mercury detection kit based on melamine-functionalized gold nanoparticles. Anal Sci Scis. 31:113–118.
- Mishra A, Verma M. 2010. Cancer biomarkers: are we ready for the prime time? Cancers. 2:190–208.
- Nelson EM, Rothberg LJ. 2011. Kinetics and mechanism of single-stranded DNA adsorption onto citrate-stabilized gold nanoparticles in colloidal solution. Langmuir. 27:1770–1777.
- Piao D, Jiang T, Liu G, Wang B, Xu J, Zhu A. 2012. Clinical implications of activated leukocyte cell adhesion molecule expression in breast cancer. Mol Biol Rep. 39:661–668.
- Pourhassan-Moghaddam M, Zarghami N, Mohsenifar A. 2014a. Watercress-based gold nanoparticles: biosynthesis, mechanism of formation and study of their biocompatibility in vitro. Micro Nano Lett. 9.5:345–350.
- Pourhassan-Moghaddam M, Zarghami N, Mohsenifar A, Rahmati-Yamchi M, Daraee H, de la Guardia M, Ahmadian S. 2014b. Gold nanoprobe based label-free detection of human telomerase reverse transcriptase (hTERT) gene expression: gold nanoprobe-based detection of hTERT gene expression. IEEE Trans Nanobiosci. [Epub ahead of print]. doi: 10.1109/TNB.2014.2365256.
- Swierczewska M, Liu G, Lee S, Chen X. 2012. High-sensitivity nanosensors for biomarker detection. Chem Soc Rev. 41:2641–2655.
- Witzel I, Schroder C, Muller V, Zander H, Tachezy M, Ihnen M, et al. 2012. Detection of activated leukocyte cell adhesion molecule in the serum of breast cancer patients and implications for prognosis. Oncology. 82:305–312.
- Zdrojewicz Z, Waracki M, Bugaj B, Pypno D, Cabała K. 2015. Medical applications of nanotechnology. PostȩPy Hig Med Dośw (Online). 69:1196.
- Zhou P, Du LF, Lv GQ, Yu XM, Gu YL, Li JP, Zhang C. 2011. Functional polymorphisms in CD166/ALCAM gene associated with increased risk for breast cancer in a Chinese population. Breast Cancer Res Treat. 128:527–534.