
Abstract
This study aims to evaluate the application of a new type of high specificity antigen sensor in detecting the viruses in sudden infectious diseases. Influenza A (H1N1) virus immunosensor was used for the respective determination of the six kinds of antigens of H1N1, H3N2 viral protein, HA protein of H7N9, influenza B virus, adenovirus, and EV71 virus of same dilution degree on the Screen Printed Carbon Electrode (SPCE), so as to test the specificity of the detection method. In addition, various batches of chick embryo allantoic saliva dilution simulation samples were also detected on their recovery (accuracy), repeatability (precision), and stability. The results were as follows: the linear equation was y = 121.33x + 168; the slope of the linear equation was 121.33 nA/HA unit, representing the sensitivity; correlation coefficient was R2=0.9921 > 0.90. Using Statistical Analysis System (SAS) software, we found that: the W values of seven sets of data after Shapiro–Wilk detection were 0.853, 0.991, 0.901, 0.906, 0.825, 0.974, and 0.992, respectively; P values were 0.247, 0.831, 0.386, 0.405, 0.174, 0.691, and 0.821, respectively, all of which were greater than 0.05, suggesting that normality was met. The results of homogeneity test for variance were as follows: F = 2.44, P = 0.0775 > 0.05, suggesting that homogeneity of variance was met. The parametric test results were as follows: F = 19114.0, P < 0.0001, suggesting that there were obvious differences between testing data of the seven groups. The determination recovery rate of electrochemical immunosensor was 80–110%. Relative Standard Deviation (RSD) values of repeatability (precision) test of H1N1 influenza virus electrochemical immunosensor were 7.74%, 3.54%, and 2.01%, all of which were smaller than 10%. The signal response of H1N1 electrochemical immune biological sensor could still maintain more than 85% of the original signal within 30 days of storage. In conclusion, H1N1 electrochemical immune biosensor has good specificity and the test results are not affected by other viruses of the same type. Besides, it has good accuracy which can realize the accurate determination of A (H1N1) influenza virus in actual detection. Thus, the requirement of precision measurement of A (H1N1) flu virus detection can be met. Therefore, H1N1 electrochemical immune biosensors can be used in actual detection with good stability.
Introduction
In the twentieth century, despite the significant progress in prevention, diagnosis and treatment, infectious disease remains as an important global health problem (Ivan et al. Citation2014, Matthieu et al. Citation2014). The rapid diagnosis plays a crucial role in timely and appropriate treatment of infectious diseases. Currently, pathogen detection technologies mainly include pathogen isolated culture method, immune method, fluorescence microscopy method, etc. However, these methods are time-consuming, with low specificity and sensitivity as well as high requirements on detection personnel, which cannot meet the requirements of on-site rapid detection and grassroot popularization and application (Emmanouil et al. Citation2009, Grzegorz Citation2015, Rizzi et al. Citation2009, Zhang et al. Citation2012). In recent years, sensors due to the advantages of rapid, accurate, efficient, and convenient have increasingly become one of the hot spots of medical diagnosis and pathogen detection technology and can be applied to the detection of various kinds of acute infectious diseases as well as the prevention of international biological terrorist events (Bruns and Horvath Citation2014, Gao et al. Citation2013, Starodub et al. Citation2000). Influenza virus has been a long-term threat to human health and influenza A virus appears annually with continuous variations which may sometimes even lead to large-scale flu outbreak, and one of the key aspects of the prevention and control of influenza is rapid screening and diagnosis of suspected cases of influenza by detection of pathogens (Ahn et al. Citation2006, Chen and Chen Citation2014).
The electrochemical immunosensor not only has the characteristics of sensitive and convenient sensor (Guo and Dong Citation2009), but also is free from interference of sample color and turbidity, thus it can be directly applied to the determination of pathogens and therefore is more suitable for on-site rapid detection. Chowdhury et al. (Citation2012) directly connected Escherichia coli specific antibody to gold electrode surface with crosslinking polyanilines and built the immune sensor to detect Escherichia coli, with a lower limit of detection reaching 102 CFU/ml. Saleh et al. (Citation2013) built up a kind of amperometric immunosensor which was able to quickly detect malaria, taking Rhop-3 type as the target antigen. Peh and Li (Citation2013) developed an aluminum membrane biosensor which could realize rapid and high sensitivity detection on Dengue type 2 virus (at lowest 0.230 PFU/ml) and Dengue type 3 virus (at 0.710 PFU/ml) within 40 min. This study aims to establish the standard curve describing the detection of A (H1N1) influenza virus by electrochemical immune biosensor and evaluate the performance indexes of sensitivity, specificity, repeatability, precision, and stability of sensors.
Materials and methods
Experimental materials
The following equipment and materials were applied in this study: multichannel electrochemical workstation, portable potentiostat, electro-heating standing-temperature cultivator, PHS-3CT precise pH meter, A (H1N1/BJ501) influenza virus liquid, influenza B virus liquid, A (H3N2) virus protein, A (H7N9) HA protein, adenovirus, EV71 virus, Goat anti-Mouse IgG-HRP, bovine serum albumin, Tris–HCl, Twain-20, K-blue substrate solution, 96 hole trace reaction plate, H1–24 murine monoclonal antibody, A1–6-HRP murine monoclonal antibody, ELISA detector, 8300 μl adjustable pipettes, towel, 37 °C incubation box, TMB substrate liquid, pH 9.6 – 0.05 M carbonate buffer solution, pH 7.4 PBST, 1% BSA confining liquid, 2 M H2 SO4 stop buffer, A (H1N1) influenza virus, cDNA, 501 forward and reverse primers, 501 fluorescence quantitative probe (Chomel Citation2008), TaKaRa Premix Extaq, Rnase Free Water, regular arrayed SPCE electrode, regular arrayed graphite holder, A (H1N1)/2009 ELISA kit, H3N2 ELISA kit, H7N9 ELISA kit, H4N6 ELISA kit, H7N7 ELISA kit, H9N2 ELISA kit, H5N1 influenza, ELISA kit, Influenza B, ELISA kit, A (H1N1) fluorescence quantitative kit, adenovirus liquid, EV71 liquid, influenza type b liquid, H3N2 liquid, H1N1 influenza liquid, etc.
Optimization of detection conditions of influenza A (H1N1) virus immune sensor
Impact of concentration of capture antibody and detection antibody
Impact of capture antibody concentration. The capture antibodies were diluted to 25, 50, 100, 200, 500, 1000, and 2000 μg/ml and then binded to the SPCE electrode at 4 °C for a night. Then, the electrode was washed with ultrapure water and dried with N2. After that, 50 μl of 2% BSA and 1% CAS solution was added into the electrode and blocked for 1.5 h at 37 °C. Then, the electrode was again washed with ultrapure water and dried with N2. Goat anti-mouse-HRP was taken as detection antibody and incubated at 37 °C for 1 h and then soaked for three times with PBST (3 min for each time). Then, ultrapure water was used again for washing and N2 for drying. Afterwards, 50 μl of K-blue substrate solution was added. Finally, IT method was used for determination of current signal and the most suitable concentration of capture antibody.
Impact of detection antibody concentration. Based on the above-optimized concentration, the capture antibody was fixed on the SPCE electrode. A (H1N1)/BJ501 chick embryo allantoic fluid with a titer of 16 HA unit was taken as the antigen. Besides, A1–6-HRP was respectively diluted to 10, 40, 60, 80, 100, and 150 μg/ml and taken as the detection antibody. The experimental procedures were the same as the above ones and IT method was used for determination of current signal and the most suitable concentration of detection antibody.
Impact of incubation time of antigen and detection antibody
Impact of antigen incubation time
The electrode with the fixed capture antibody H1–24 was firstly blocked with blocking liquid for 1.5 h and then washed with ultrapure water and dried with N2 for standby application. Then, the virus liquid was diluted to 32 HA unit, with corresponding diluted EV71 virus liquid as the negative control. Both of the liquids were added to the five groups of electrodes with a content of 10 μl and incubated for 15, 30, 45, 60 and 90 min at 37 °C, respectively. Ninety minutes later, the liquids were washed with PBST and dried with N2. Afterwards, 5 μl of diluted detection antibody (1:100) A1–6-HRP was added drop by drop to the electrode surface and incubated for 1 h at 37 °C and then soaked for three times with PBS, 3 min for each time. Finally, IT method was applied for determination after washing with ultrapure water and drying with N2.
Impact of incubation time of detection antibody
The electrode with the fixed capture antibody H1–24 was firstly blocked with blocking liquid for 1.5 h and then washed with ultrapure water and dried with N2 for standby application. Then, the virus liquid was diluted to 32 HA unit, with corresponding diluted EV71 virus liquid as the negative control. Both of the liquids were added to the five groups of electrodes with a content of 10 μl and incubated for 30 min at 37 °C, then the liquids were washed with PBST and dried with N2. Afterwards, 5 μl of diluted detection antibody (1:100) A1–6-HRP was added drop by drop to each electrode surface of six groups and incubated for 10, 20, 30, 45, 60, and 90 min at 37 °C and then soaked for three times with PBS, 3 min for each time. Finally, IT method was applied for determination after washing with ultrapure water and drying with N2.
Impact of incubation temperature
Impact of incubation temperature of capture antibody
Firstly, 5 μl of capture antibody H1–24 was added to three groups of electrode surface and incubated for 2 h at 4 °C, 25 °C and 37 °C, respectively. Then, it was washed with ultrapure water and dried with N2 for standby application. Afterwards, the electrodes were blocked with blocking liquid for 1 h and washed with ultrapure water and dried with N2 for standby application. Taking Goat anti-Mouse IgG-HRP as the detection antibody, 5 μl of diluted detection antibody (1:100) was added drop by drop to each electrode surface of three groups and incubated for 1 h at 37 °C and then soaked for three times with PBS, 3 min for each time. Finally, IT method was applied for determination after washing with ultrapure water and drying with N2.
Impact of incubation temperature of antibody
The electrode with the fixed capture antibody H1–24 was firstly blocked with blocking liquid for 1 h and then washed with ultrapure water and dried with N2 for standby application. Then, the virus liquid was diluted to 32 HA unit and 10 μl of liquid was added to the three groups of electrodes and incubated for 30 min at 4 °C, 25 °C, and 37 °C, respectively. Then, the liquids were washed with PBST and dried with N2. Afterwards, 5 μl of diluted detection antibody (1:100) A1–6-HRP was added drop by drop to each electrode surface of the three groups and incubated for 45 min at 37 °C and then soaked for three times with PBS, 3 min for each time. Finally, IT method was applied for determination after washing with ultrapure water and drying with N2.
Impact of incubation temperature of detection antibody
The electrode with the fixed capture antibody H1–24 was firstly blocked with blocking liquid for 1 h and then washed with ultrapure water and dried with N2 for standby application. Then, the virus liquid was diluted to 32 HA unit and 10 μl of liquid was added to the three groups of electrodes and incubated for 30 min at 37 °C. Then, the liquids were washed with PBST and dried with N2. Afterwards, 5 μl of diluted detection antibody (1:100) A1–6-HRP was added drop by drop to each electrode surface of the three groups and incubated for 30 min at 4 °C, 25 °C, and 37 °C, respectively, and then soaked for three times with PBS, 3 min for each time. Finally, IT method was applied for determination after washing with ultrapure water and drying with N2.
Establishment of standard curve of detection of influenza A (H1N1) virus based on electrochemical immune biosensor and its detection performance evaluation
IT method was applied for the determination of 64 HA unit/ml diluted A (H1N1) influenza virus of chick embryo allantoic fluid standards with a titer of 0, 4, 8, 16, and 32 on SPCE electrode based on influenza A (H1N1) virus immune sensor. Then, a linear-regression analysis was carried out on data and the standard curve of detection of influenza A (H1N1) virus was established.
Specificity test of influenza A (H1N1) virus electrochemical immunosensor
Influenza A (H1N1) virus immune sensor was used for the detection of six antibodies of A (H1N1), influenza A (H3N2) virus protein, A (H7N9) HA protein, influenza B virus, adenovirus, and EV71 virus with a same dilution degree on the SPCE electrode, so as to detect the specificity of the established detection method.
Recovery (accuracy) test of influenza A (H1N1) virus electrochemical immunosensor
Influenza A (H1N1) virus immune sensor was used for the detection of A (H1N1)/BJ501 chick embryo allantois saliva dilution simulated samples with a titer of 5, 10, and 50 HA unit on the SPCE electrode. Each group was repeated for four times. Through the standard curve, corresponding virus titer of current I was calculated as well as the recovery rate and standard deviation, so as to determine the accuracy of the detection method.
Repeatability (precision) test of influenza a (H1N1) virus electrochemical immunosensor
Influenza A (H1N1) virus immune sensor was used for the detection of A (H1N1)/BJ501 chick embryo allantois saliva dilution simulated samples with a titer of 0, 4, and 8 HA unit on the SPCE electrode. Each group was repeated for four times. Through calculating the current value, standard deviation between groups was obtained, so as to determine the repeatability (precision) of the detection method.
Stability test of influenza A (H1N1) virus electrochemical immunosensor
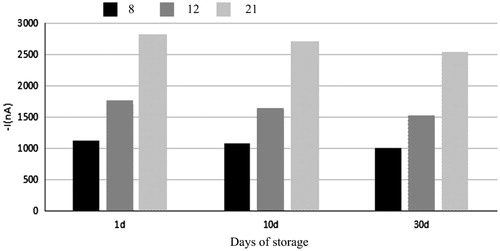
The three groups of SPCE electrodes with their surfaces adsorbed with capture antibody H1–24 SPCE were stored for 1, 10, and 30 days at 4 °C. Then, influenza A (H1N1) virus immune sensor was used for the detection of influenza A (H1N1) virus dilution simulated samples with a titer of 8, 12, and 21 HA unit, so as to determine the stability of the detection method.
Results and discussion
Establishment of standard curve of detection of influenza A (H1N1) virus based on electrochemical immune biosensor and its sensitivity analysis
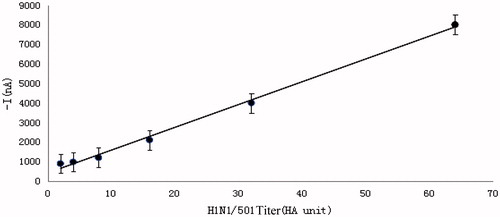
The standard curve is shown in . The detected five data points were basically in a straight line. The linear equation was y = 121.33x + 168; the slope of the linear equation was 121.33 nA/HA unit, representing the sensitivity; correlation coefficient was R2 =0.9921 > 0.90. The results showed that the curve presented excellent linearity within 4–64 HA unit, which is to say, the current signal produced by the influenza A (H1N1) virus immune sensor was positively related with the antigen titer with which it combined. Also, accurate titer of the detected antibody can be obtained through calculation with the measured current signal value according to the linear equation of the standard curve. The lower detection limit of the standard curve is based on three times of standard deviation (16.84 nA) of the detected value (177.74 nA) at blank point (0 HA unit) of virus titer. Through calculation, the value is 0.43 HA unit, i.e., the lowest virus titer which can be detected by the standard curve is 0.43 HA unit. Based on this standard working curve, a quantitative analysis on the detected samples can be realized.
Figure 1. Standard working curve of detection of influenza A (H1N1) virus based on electrochemical immunosensor.
Specificity test of influenza A (H1N1) virus electrochemical immunosensor
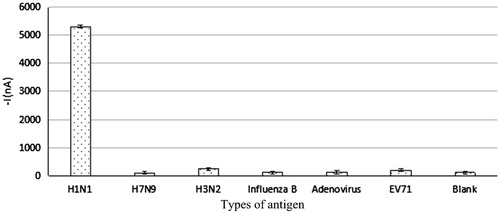
According to , influenza A (H1N1) virus generated strong positive signal on the immune sensor, which was significantly different from the other five antigens and current signal generated by the blank point. Whereas, the signal difference between the five antigens and the blank point was not significant. Through applying Statistical Analysis System (SAS), the following results were obtained: the W values of seven sets of data after Shapiro–Wilk detection were 0.853, 0.991, 0.901, 0.906, 0.825, 0.974, and 0.992, respectively; P values were 0.247, 0.831, 0.386, 0.405, 0.174, 0.691, and 0.821, respectively, all of which were greater than 0.05, suggesting that normality was met. The results of homogeneity test for variance were as follows: F = 2.44, P = 0.0775 > 0.05, suggesting that homogeneity of variance was met. The parametric test results were as follows: F = 19114.0, P < 0.0001, suggesting that there were obvious differences between testing data of the seven groups. The SNK (q test) pairwise comparison results showed that there was significant difference on antigen and blank values between H1N1 group and other five groups while no difference was found on the detected value between H3N2, Influenza B, EV71, adenoviruses, and blank points. However, though H7N9 showed difference from the blank points, its detected mean values were lower than blank values and presented negative signals. Thus, it can be concluded that influenza A (H1N1) virus electrochemical immune biosensor has good specificity, with its detection results free from interference of other viruses of the same type.
Figure 2. Signal response of different target antigens based on influenza A (H1N1) virus electrochemical immune biosensor detection.
Recovery (accuracy) test of influenza A (H1N1) virus electrochemical immunosensor
The immunosensor was used for determination of the simulated sample of A (H1N1) influenza virus with different titers of 5 HA unit, 10 HA unit, and 50 HA unit and each titer was determined for four times, the results are shown in . Relative Standard Deviation (RSD) values were all less than 10%, indicating the high precision of testing results. For the four samples of each titer, current values were measured and converted to titer based on the fitting equation of the standard curve. Then, recovery rates were calculated to be between 80% and 110% based on Equation (1), suggesting that the established immunosensor has good accuracy in detecting A (H1N1) influenza virus and thus can realize the accurate determination in real detection of A (H1N1) influenza virus.
Table 1. Determination of recovery rate based on electrochemical immunosensor.
Repeatability (precision) test of influenza A (H1N1) virus electrochemical immunosensor
The immunosensor was used for determination of the simulated sample of A (H1N1) influenza virus with different titers of 0 HA unit, 4 HA unit, and 8 HA unit and each titer was determined for four times, the results are shown in . The RSD values were 7.74%, 3.54%, and 2.01%, respectively, which were all below 10%, suggesting that the determination results have good repeatability. This shows that the established immunosensor has high precision in detecting A (H1N1) influenza virus and thus can realize the precise determination in real detection of A (H1N1) influenza virus.
Table 2. Determination of repeatability based on electrochemical immunosensor.
Stability test of influenza A (H1N1) virus electrochemical immunosensor
As can be seen from , there were no differences between signal after 10 days of storage and after 1 day of storage and the former one was lower than the latter one. Then, the mean current values of the samples with different titers of 8, 12, and 21 HA unit after 10 days of storage and after 1 day of storage were measured and compared with those measured in the first day and percentage was calculated. The results showed that the percentages of samples with different titers after 10 days of storage were 94.03%, 96.85%, and 98.56%, respectively, and those of samples with different titers after 30 days of storage were 88.47%, 90.23%, and 92.04%, respectively. The data suggest that signal response of H1N1 electrochemical immune biological sensor can still maintain more than 85% of the original signal within 30 days of storage. Thus, the immune sensor has good stability and can be used in actual detection.
Figure 3. Impact of storage time of immune sensor on determination.
Conclusion
In recent years, with the maturing of microelectronic processing technology, miniaturization has been a trend for electrochemical biosensors, which has laid a foundation for the application of biosensors in on-site quick testing of pathogens of infectious diseases (Cao Citation2014, Hao et al. Citation2011, Kaewphinit et al. Citation2012, Wang et al. Citation2015). When building immune sensors, nanometer materials are usually adopted for modification of electrodes in order to improve the detection sensitivity. Kheiri et al. (Citation2011) built an HIV detection sensor, of which, HIV-1 p24 antibody was fixed on the gold electrode surface with GNP/CNT/AEP nanocompound modification, which can produce response signal on target detection objects within 18 s, with a limit of detection of 0.018 muA/ng/ml. Wang et al. (Citation2012) built a sensor which can realize the one-time rapid detection of Mycobacterium tuberculosis with gold nanoparticles on SPCE electrode. Under the signal amplification of gold nanoparticles, the sensor can detect Mycobacterium tuberculosis with a lowest limit 5.3 ng/ml. Ma et al. (Citation2013) used gold nanoparticles and graphene–methylene blue (GMCs–MB) nanometer compound materials to reinforce signal and combine with the capture antibody so as to construct a specific sensor to detect hepatitis C (HCV), which can realize detection of HCV within the range of 0.25–300 pg/ml, with a detection limit of 0.01 pg/ml.
The results of this study show that H1N1 electrochemical immune biosensor has good specificity and the test results are not affected by other viruses of the same type. Besides, it has good accuracy which can realize the accurate determination of A (H1N1) influenza virus in actual detection. Thus, the requirement of precision measurement of A (H1N1) flu virus detection can be met. Therefore, H1N1 electrochemical immune biosensors can be used in actual detection with good stability.
Acknowledgements
The authors would like to thank The National Natural Science Foundation of China (NSFC), Medical Building Network System Construction of Emergent Infectious Disease Prevention and Control 51078104.
Disclosure statement
The authors report no conflicts of interest. The authors alone are responsible for the content and writing of this article.
References
- Ahn I, Jeong BJ, Bae SE, Jung J, Son HS. 2006. Genomic analysis of influenza A viruses, including avian flu (H5N1) strains. Eur J Epidemiol. 21:511–519.
- Bruns AM, Horvath CM. 2014. Antiviral RNA recognition and assembly by RLR family innate immune sensors. Cytokine Growth Factor Rev. 25:507–512.
- Cao X. 2014. Ultra-sensitive electrochemical DNA biosensor based on signal amplification using gold nanoparticles modified with molybdenum disulfide, graphene and horseradish peroxidase. Microchim Acta. 181:1133–1141.
- Chen YH, Chen YF. 2014. Evidence of selection pressures of neuraminidase gene (NA) of influenza A virus subtype H5N1 on different hosts in Guangxi Province of China. Saudi J Biol Sci. 21:179–183.
- Chomel BB. 2008. Control and prevention of emerging parasitic zoonoses. Int J Parasitol. 38:1211–1217.
- Chowdhury AD, De A, Chaudhuri CR, et al. 2012. Label free polyaniline based impedimetric biosensor for detection of E. coli O157: H7 bacteria. Sens Actuators B Chem. 171:171–172.
- Emmanouil AM, Sotirios ET, Polymnia PA, Epaminondas JP, Eleftherios CT. 2009. Symptom development, pathogen isolation and Real-Time QPCR quantification as factors for evaluating the resistance of olive cultivars to Verticillium pathotypes. Eur J Plant Pathol. 124:603–611.
- Gao DX, Wu JX, Wu YT, Du FH, Aroh C, Yan N, Sun LJ, Chen ZJ. 2013. Cyclic GMP-AMP synthase is an innate immune sensor of HIV and other retroviruses. Science (New York, N.Y.). 341:903–906.
- Grzegorz M. 2015. Study on the structure of pitch-polymer compositions by fluorescence microscope. Colloid Polym Sci. 293:297–301.
- Guo S, Dong S. 2009. Biomolecule-nanoparticle hybrids for electrochemical biosensors. Trends Anal Chem. 28:96–109.
- Hao RZ, Song HB, Zuo GM, et al. 2011. DNA probe functionalized QCM biosensor based on gold nanoparticle amplification for Bacillus anthracis detection. Biosens Bioelectron. 26:3398–3404.
- Ivan B, Jelena M, Servaas AM. 2014. Biobanking and translation of human genetics and genomics for infectious diseases. Appl Transl Genomics. 3:30–35.
- Kaewphinit T, Santiwatanakul S, Chansiri K. 2012. Gold nanoparticle amplification combined with quartz crystal microbalance DNA based biosensor for detection of Mycobacterium tuberculosis. Sens Transducers. 146:156–163.
- Kheiri F, Sabzi RE, Jannatdoust E, et al. 2011. A novel amperometric immunosensor based on acetone-extracted propolis for the detection of the HIV-1 p24 antigen. Biosens Bioelectron. 26:4457–4463.
- Ma C, Liang M, Wang L, et al. 2013. MultisHRP-DNA-coated CMWNTs as signal labels for an ultrasensitive hepatitis C virus core antigen electrochemical immunosensor. Biosens Bioelectron. 47:467–474.
- Matthieu H, Jean-François G, Ismail A, Mathieu N. 2014. Disentangling the complexity of infectious diseases: time is ripe to improve the first-line statistical toolbox for epidemiologists. Infect Genet Evol J Mol Epidemiol Evol Genet Infect Dis. 21:497–505.
- Peh AEK, Li SFY. 2013. Dengue virus detection using impedance measured across nanoporous alumina membrane. Biosens Bioelectron. 42:391–396.
- Rizzi M, D'Aloia M, Castagnolo B. 2009. High sensitivity and noise immune method to detect impedance cardiography characteristic points using wavelet transform. J Appl Sci. 9:1412–1421.
- Saleh S, Moreno-Molek S, Perera I, et al. 2013. Domain decomposition and model order reduction methods applied to the simulation of multi-physics problems in MEMS. Anal Bioanal Chem. 122:113–127.
- Starodub VM, Fedorenko LL, Starodub NF. 2000. Optical immune sensors for the monitoring protein substances in the air. Sens Actuators: B Chem. 68:40–47.
- Wang L, Leng C, Sheng T, et al. 2012. Enzyme-free signal amplification for electrochemical detection of Mycobacterium lipoarabinomannan antibody on a disposable chip. Biosens Bioelectron. 38:421–424.
- Wang K, Yun L, Zhong GX, et al. 2015. Dual-probe electrochemical DNA biosensor based on the “Y” junction structure and restriction endonuclease assisted cyclic enzymatic amplification for detection of double-strand DNA of PML/RARα related fusion gene. Biosens Bioelectron. 71:463–469.
- Zhang DG, Fu Q, Yi MF, Wang XX, Chen YK, Wang P, Ming H. 2012. Contrast enhancement in fluorescence microscope by plasmonic coupling. Plasmonics. 7:209–214.