
Abstract
Herein, a nanoemulsion-based organogel (NEOG) system loaded with acyclovir has been developed for the effective treatment of herpes simplex virus infection via topical delivery. Pseudo-ternary phase diagram exhibited increase in non-birefrigent, optically isotropic region of organogel with Smix (Kw) ratio. The NEOG C showed good storage (G′) and loss moduli (G″), and more compact network structures. Gel-sol transition temperature (Tg) and fractal dimension (Df) of NEOG system revealed increased density of the tubular network with Kw. Hence, high gelling ability of the developed NEOG system may attribute to the combination of sustained and site-specific delivery of drugs.
Introduction
Over the past three decades, organogels (OGs) have emerged as extremely effective drug delivery system. A wide variety of OGs have been developed and investigated for various applications namely in transdermal drug delivery (Boddu et al. Citation2014, Upadhyay et al. Citation2007), oral drug delivery (Yu and Huang Citation2012), cosmetics (Kirilov et al. Citation2014), separation sciences (Fu et al. Citation2007, Rizkov et al. Citation2010) and templates (Marr et al. Citation2013). OGs are opaque, semisolid, thermoreversible organic gel system having inverted bilayers of surfactant molecules (Murdan et al. Citation1999c). From pharmaceutical perspective, OG systems have been extensively explored by using three major types of gelator namely gelatin (Kantaria et al. Citation1999, Sagiri et al. Citation2015), lecithin (Boddu et al. Citation2014, Bramwell and Williams Citation2012, Peacock et al. Citation2014) and sorbitan esters (Murdan et al. Citation1999b, Upadhyay et al. Citation2007). Especially, sorbitan esters as a gelator in pharmaceutical application were first reported by Florence and coworkers (Murdan et al. Citation1999a, Murdan et al. Citation1999b, Murdan et al. Citation1999c). Afterward, Pisal et al. (Citation2004) reported the effect of polyoxyethylene sorbitan ester on strength and drug release profile of OG system and highlighted three-dimensional network as an essential factor for controlling diffusional drug release.
Characterization data existing on rheological study of OG systems is still insufficient in the available literature. In current scenario, an exhaustive rheological characterization of OG system is needed. A detailed evaluation of rheological properties during sol-gel processing can be a useful tool to the manufacturer when designing and formulating a stable formulation. During large-scale development of semisolid products, various equipments are employed to impart high shear, which enhance the temperature of semisolids that affect the gelation by causing delay or destruction of gelation effect in OG system. Therefore, a sound understanding of gelation behavior and temperature is essential for constructing a stable OG system (Upadhyay et al. Citation2007).
Acyclovir (ACV), a guanosine analogue antiviral drug that has extensive application in the treatment of various ailments such as herpes simplex virus (HSV) (Elia et al. Citation2015, Monavari et al. Citation2014), varicella zoster (chickenpox) (Carcao et al. Citation1998, Swaika et al. Citation2012), herpes zoster (shingles) (Wagstaff et al. Citation1994), cutaneous herpes (Collins and Oliver Citation1982, Mitchell et al. Citation1981), herpes keratitis (Jwala et al. Citation2011) and genital herpes (Baeten et al. Citation2012, Kern et al. Citation1983) infections. However, its use is limited due to two main reasons: primarily, it has highly variable bioavailability (10–30%) via oral route with dose dependent absorption (de Miranda and Blum Citation1983) and secondly, it has less mean plasma half-life (t1/2) of 3.25 h only. Hence, it requires frequent administration of high dose (200 mg; 5 times daily for 10 days) for effective management of HSV infections (Bryson et al. Citation1983). In addition, oral administration of ACV is associated with some side effects like nausea, diarrhea, rash or headache, which make it a potential candidate for topical application. Accepting these challenges, an attempt has been made to develop an OG system for topical delivery of ACV that could deliver the drug in a constant and controlled manner at desired site of action topically and protect the drug from presystemic metabolism to achieve maximum drug utilization.
Hence, working on this rationale, current article describes the development and characterization of sorbitan ester-based OG for topical drug delivery. First, a pseudo-ternary phase diagram was constructed to find out the existence region of OG system by taking different ratios of sorbitan esters. Then, the effect of water on turbidity and viscosity of optimized formulations was monitored. Later, rheological characteristics of OG was determined and correlated with the observed gel microstructural properties. Finally, the relationship between OG microstructure, in vitro drug release profile and drug permeation through skin was investigated.
Materials and methods
Materials
Acyclovir was generously gifted by Zydus cadila (Ahmedabad, India). Isopropyl myristate (IPM), sorbitan monostearate (Span 60) and poly (oxyethylene) sorbitan monooleate (Tween 80) were purchased from CDH Laboratory Pvt. Ltd., Mumbai, India. Double-distilled water (DDW) was used as an aqueous phase during experiments. All other chemicals and solvents were of analytical reagent grade and used as received.
Methods
Construction of pseudo-ternary phase diagram
In order to find out the existence range of nanoemulsion, pseudo-ternary phase diagrams were constructed using aqueous titration method (Upadhyay et al. Citation2007). Span 60 and Tween 80 in different ratios were used as surfactants. Three ternary systems were constructed by mixing Span 60 and Tween 80 (Smix, Kw, 1:1, 1:2 and 1:3). Further, for each phase diagram, Smix was dissolved in IPM, in ratios of 0.5:9.5, 1:9, 1.5:8.5, 2:8, 2.5:7.5, 3:7, 3.5:6.5, 4:6, 4.5: 5.5, 5:5, 5.5:4.5, 6:4, 6.5:3.5, 7:3, 7.5:2.5, 8:2, 8.5:1.5, 9:1 and 9.5:0.5 in glass vials at 60 °C. In succession, above preparations were subjected for titration with DDW at high speed using a magnetic stirrer with constant stirring until it turned turbid. The phase behavior of each ternary system was assessed visually during titration. The percentage composition of the constituent in each ternary system was determined and the experimental data were plotted on triangular co-ordinates to construct phase diagram. The pseudo ternary phase diagrams were constructed using SigmaPlot V 12.5 software (Build 12.5.0.38, Systat Software Inc., UK).
Correlation between turbidity and viscosity as a function of water
The turbidity and viscosity of solution was determined by turbidity meter (Brinkmann-910, Brinkmann Instruments, Riverview, FL) and Sine-wave Vibro Viscometer SV-10 (A & D Company Ltd, Tokyo, Japan), respectively. The IPM and Smix ratios representing maximum water solubilization in pseudo-ternary phase diagram was selected for study. Solutions representing IPM and Smix ratios 8:2 (Kw, 1:1), 7.5:2.5 (Kw, 1:2) and 6:4 (Kw, 1:3) were titrated drop by drop with DDW using microburette with constant stirring at 60 °C and instantaneously, samples were examined for change in turbidity and viscosity after each interval. Finally, results were plotted.
Preparation of drug-loaded formulations
Drug-loaded nanoemulsion organogel (NEOG) formulations were prepared using aqueous titration method (). First, IPM and Smix was mixed at 60 °C to form an oil phase and then drug solution, prepared in DDW was added drop by drop to the oil phase with constant stirring by using hot plate magnetic stirrer. After that, the formulation was left for 24 h at room temperature (25 °C) to reach complete equilibrium.
Table 1. Composition of various formulations.
Characterization of OGs
Rheological behavior.
Gel-sol transition temperature and fractal dimension study was performed using an AR500 stress controlled rheometer (TA Instruments, UK). The dynamic rheology of formulation was carried out by using steel parallel plate geometry with radius 20 mm, angle 0° and truncation gap 58 μm.
Gel-sol transition temperature.
To specify the viscoelastic range, frequency and strain sweep tests were performed. Gel-sol transition studies were performed under the temperature ramp. NEOG formulations (0.2 g) were applied on the platform of the rheometer fixed at a constant angular frequency (ω = 6.283 rad/s), and temperature was varied from 20 °C to 35 °C. The storage modulus (elastic), G′ and loss modulus (viscous), G″ were recorded and graphically plotted against temperature. The Gel-sol transition temperature in the curve was recorded as the minima of the Tan δ (G″/G′) versus temperature (°C).
Fractal dimension.
Fractal dimension of formulation was determined by varying angular frequency (ω) in range from 1 to 200 rad/s, at fixed temperature 20 °C. The relaxation exponent (Δ) was calculated by fitting the curve to the power law or a linear logarithmic equation (EquationEquation 1(1) and EquationEquation (2)
(2) (Mohanty and Bohidar Citation2005).
(1)
And,
(2)
where G(ω) is the modulus, ω is angular frequency (rad/s), Δ is the relaxation exponent and α is a constant. Relaxation exponent was calculated by using above equation and a correlation between relaxation exponent and fractal morphology of the gel network was established (EquationEquation (3)
(3) using the equation as described by Muthukumar (Citation1989).
(3)
where D is dimension, Df is fractal dimension. After putting values of D = 3 (for gel), EquationEquation 3
(3) can be written as:
(4)
In vitro drug release study
The ACV-loaded NEOG formulations were subjected for in vitro drug release study. 1.0 g of formulation was placed in a pretreated dialysis bag (MWCO = 14 kDa) and tied with thread on both sides. The dialysis bag was immersed in 50 ml of phosphate buffer saline (PBS, pH 5.5) in a beaker maintained at 37 ± 1 °C using hot plate-magnetic stirrer with constant stirring at low speed using the magnetic bar. The samples were withdrawn from beaker at a specific time interval for 24 h and replaced instantly with an equal amount of PBS. Subsequently, the samples were analyzed spectrophotometrically at 252.3 nm after suitable dilutions. Finally, the drug release (M) with time (t) was determined by applying power law equation (Peppas and Brannon-Peppas Citation1994).
(5)
where
is a fraction of drug released at time t, k is the constant and n is the release exponent representing different type of release mechanisms.
Skin permeation study: in vitro
Skin permeation of ACV from NEOG was performed through isolated pig abdominal skin via Franz diffusion cell. The skin was prepared (Panigrahi et al. Citation2005) by complete removal of hair and fatty material followed by checking skin integrity by microscopy. The skin was carefully placed between the donor and receptor compartments of the Franz diffusion cell. The stratum corneum was trimmed such as it faced toward donor compartment and dermal side bathed in receptor media with effective surface area (≈2.0 cm2) available for diffusion. The ACV-loaded formulations (1.0 g) was placed over the dermal side of the skin and receptor compartment was filled with 10 ml of PBS (pH 7.4). The temperature of cell content was maintained at 37 °C using thermostatic circulating water bath and the receptor solution was continuously stirred at 50 rpm with the help of magnetic stirrer during the experiment. Sample (1.0 ml) was withdrawn from the receptor compartment at time intervals 0.5, 1–8 and 24 h. The withdrawn volume was adjusted with fresh PBS, pH 7.4. The drug contents were determined by high-performance liquid chromatography (Bahrami et al. Citation2005) and diffusion coefficient, permeability coefficient and partition coefficient were determined by the reported methods (Aslani and Kennedy Citation1996, Pefile et al. Citation1998, Saket et al. Citation1984).
Stability study
NEOG C formulation was subjected to mechanical stress by centrifuging (Remi Centrifuge, India) at 2000–10,000 rpm for different time intervals and the separated phase volume was recorded. Viscosity of NEOG C was determined by using Brookfield Digital Viscometer model LVDVI + (Brookfield AMETEK Labs. Inc., Middleboro, MA), with spindle “TD” at shear rate 0.3–6 rpm for 10 days intervals: 0, 10, 20 and 30 days.
(6)
where TD factor = 1872n− 1 (n = rpm).
Results and discussion
Effect of Kw on phase behavior of OG system
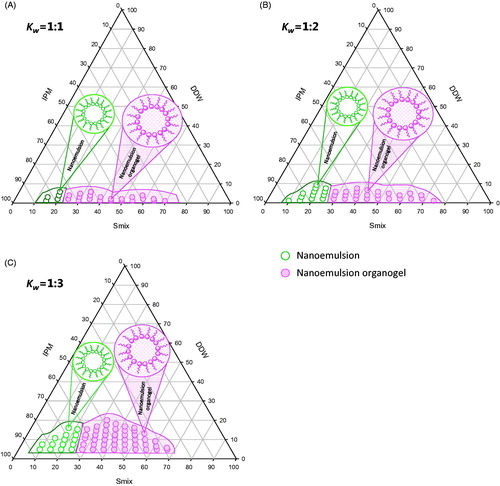
Surfactant and co-surfactant in an appropriate weight ratio (Kw) facilitate the formation of emulsion by enhancing solubilization of oil in water (o/w) or water in oil (w/o) phase and thus, augment self-emulsification performance of two immiscible phase by improving nanoemulsifying area in ternary phase diagram. In addition, they also boost the penetration effect of drugs when applied topically (Kogan and Garti Citation2006, Sallam et al. Citation2015). Therefore, this is important to determine a specific weight ratio (Kw) of surfactants/cosurfactants that represent maximum area of nanoemulsion in ternary system. In this article, an OG system comprising IPM, water and Smix (Span 60/Tween 80) was investigated by plotting pseudo-ternary phase diagrams. During the experiment, Smix ratio (Kw) was kept fixed at ratios 1:1, 1:2 and 1:3, with HLB values 9.85, 11.56 and 12.4, respectively. An increase in area of OG region was observed when value of Kw varied from 1:1 to 1:3 (). The OG existence region was observed maximum at Kw∼1:3, which is an indicative of high amount of aqueous phase solubilized. This may be the effect of increase in ratio of Tween 80 (a hydrophilic surfactant) in the Smix, which raised HLB value of resulting surfactant mixture, as expected. Interestingly, during initial phase of titration, the mixture of IPM and Smix (Kw, 1:1, 1:2 and 1:3) produced nanoemulsion region without gelling property (i.e. Span 60 < 10% w/w), but above this concentration (Span 60 ≥ 10%w/w), it start to form nanoemulsion with gelling effect at room temperature, as it was expected (Murdan et al. Citation1999a). Thus, pseudo-ternary phase diagram highlighted two regions, representing the formation of nanoemulsion (NE) and NEOG as shown in . Formation of organogel might be due to cooling of the sol phase, which reduced the solubility of the Span 60 (gelator) and dropped the affinity between IPM and Span 60 by facilitating the surfactant molecules to self-assemble into aggregates, and formed a 3-dimensional network which immobilized the IPM and produced gelation (Murdan et al. Citation1999a).
Figure 1. Pseudo-ternary phase diagrams indicating w/o nanoemulsion and organogel region at diffierent Smix ratios (A) Kw = 1:1, (B) Kw =1:2 and (C) Kw = 1:3, where Kw = Smix ratio (Span 60/Tween 80).
Correlation between turbidity and viscosity as a function of water
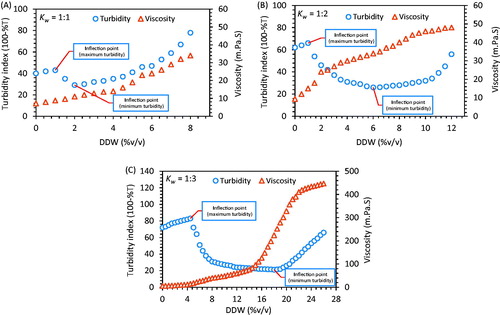
Mixture of IPM and Smix was titrated with aqueous phase as formulation variable, while turbidity and viscosity was assumed as response variables. The effect of water on turbidity and viscosity was monitored by titrating the solution of IPM and Smix (Kw 1:1, 1:2 and 1:3) at 60 °C and a ternary graph was plotted in between turbidity, viscosity and water. The level of intermolecular interactions of water with surfactants and oil phase was monitored via quantitative measurement of turbidity. The variation in percent transmittance (%T) of various Smix solutions was monitored constantly using a turbidity meter (Brinkmann-910, Brinkmann Instruments, Riverview, FL). Study revealed that, the first solution (prior to titration) (Kw, 1:1) in the absence of water (0% v/v), recorded least turbidity as compared to other solutions and upon addition of little amount of water (2% v/v), it registered clear solution suggesting solubilization of water by forming w/o globules. However, turbidity of second solution (Kw, 1:2) was observed decreasing continuously upon titration and indicated maximum clarity at 6% v/v of water. Whereas, third solution (Kw, 1:3) registered high turbidity during initial phase of treatment (0–5% v/v of water), and afterward it turned into transparent solution (5–20% v/v of water) which predicted the formation of nanoemulsion, and recorded maximum clarity at 18% v/v of water. Shifting of turbid solution into transparent indicates rearrangement of surfactant molecules by forming inverse micellar structure to solubilize the water molecules and confirm the formation of w/o type nanoemulsion. Titration was continued until maximum turbidity was recorded. Change in viscosity behavior upon treatment with water was also recorded for all the mixtures simultaneously. Different mixtures of IPM and Smix further witnessed the constant augmentation in viscosity upon titration. Especially third solution, which showed sigmoid curve of viscosity in which middle portion representing sudden rise in viscosity (at 15–20% v/v of water) suggested gelling effect due to Span 60 (Murdan et al. Citation1999c). Solutions upon further titration attributed in the swelling of surfactant tubules, which result in to higher viscosity to transform viscous gel into thick gel (Murdan et al. Citation1999c). A relation between turbidity and viscosity as a function of water has been represented in .
Figure 2. Graph showing variation in turbidity and viscosity as a function of DDW for w/o nanoemulsion at difierent Smix ratios (A) Kw = 1:1, (B) Kw =1:2 and (C) Kw = 1:3, where, Kw = Smix ratio (Span 60/Tween 80).
Rheological behavior
Gel-sol transition temperature
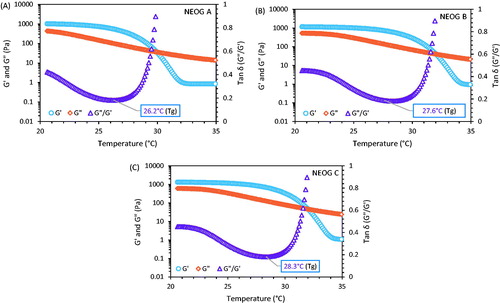
Gel-sol transition temperature (Tg) of NEOG formulations was determined from the loss of storage modulus (G′) and loss modulus (G″) versus temperature (T). The curves present three domains: high and nearly constant values of G″ corresponding to gel state, a sharp decrease corresponding to gel microstructure break-up and a last domain with a tendency to a plateau that could be linked to sol formation. The curve between Tan δ (G″/G′) and T was plotted and the Tg was determined from the minima of the curve, i.e. the point where the viscoelasticity of the gel changes abruptly (). NEOG C showed high Tg value (28.3 °C) over NEOG A (26.2 °C) and NEOG B (27.6 °C). This change in Tg (Gel-sol) value can be explained by alteration in the arrangement of gel network and formation of more stiff gel owing to addition of increased ratio of Span 60 (Murdan et al. Citation1999b, Murdan et al. Citation1999c).
Figure 3. Temperature dependent loss of elastic modulus, G′ (circles), and viscous modulus, G″ (diamonds), and a curve between Tan δ versus Temperature (triangles), with minima at Tg of (A) NEOG A, (B) NEOG B and (C) NEOG C. The curves are plotted by the best sigmoidal fit of the data points.
Fractal dimension
The viscoelastic nature of gels, which is a function of the microstructure network, was evaluated from the G′ and G″ versus angular frequency (ω) curve (). The elastic and viscous modulus shows an apparently asymptotic increase in values. Elastic modulus component [G′(ω)] having always a higher values than the viscous modulus component [G″(ω)] suggesting predominantly elastic nature of the NEOG within the indicated frequency range. The elastic behavior in this case reflects the presence of entangled network of aqueous phase (Mahjour et al. Citation1990, Quellet and Eicke Citation1986, Scartazzini and Luisi Citation1988), which tempted to evaluate the value of fractal dimension (Df). The relaxation exponent (Δ) was calculated by fitting the power law equation to the G′(ω) and G″(ω) versus ω or by plotting logarithm of [G′(ω)] and [G″(ω)] versus logarithm of [ω] curves and determined the slope from the linear fit equation. The Df value was calculated and it is presented in .
Figure 4. Frequency (ω) dependence of G′ (circles) and G″ (diamonds) in three organogel systems (A) NEOG A, (B) NEOG B and (C) NEOG C. Relaxation exponents were calculated from their slopes.
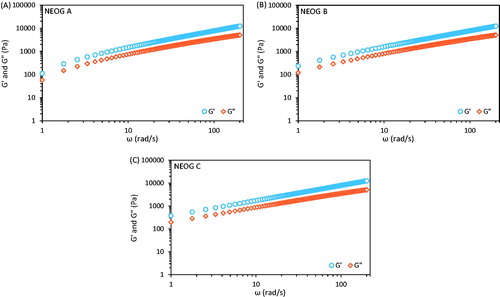
Table 2. Rheological characterization of ACV-loaded NEOG formulations.
In vitro drug release study
The in vitro drug release profile and skin permeation study of NEOG formulations was performed using dialysis bag and pig abdominal skin, respectively. The drug release kinetics from NEOG were established by plotting a graph between log of percent cumulative drug release against log (t) and the value of the diffusional release exponent (n) was calculated from the slope. The value of n was found to be ∼0.7 (0.45 < n < 0.89), which indicate non-Fickian diffusion of ACV from the NEOG (Peppas and Brannon-Peppas Citation1994). At n = 0.45, the drug release is Fickian, at 0.45 < n < 0.89, it is diffusion-controlled and swelling-controlled transport mechanisms (non-Fickian transport), at n = 0.89, it is zero-order (case II transport) and the value of n > 0.89 indicate super case II transport (Ritger and Peppas Citation1987). A graph was plotted between percent cumulative drug release versus tn (not shown) and release rate was determined from the slope of linear curve fit. The in vitro drug release from the formulation NEOG A, exhibited faster (11.04%/h0.7/cm2) over other (), as it has less stiff microtubular network. While, NEOG C formulation demonstrated slower release (10.18%/h0.7/cm2), owing to its more stiff gel structure ().
Figure 5. Percent drug released versus time curve. The inset shows log (% drug released) versus log T to obtain a power law exponent, which correlates well with direct fitting of the curve to the power law equation.
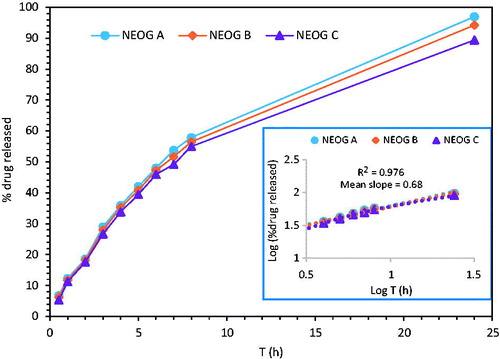
Table 3. In vitro release rate and skin permeation of ACV from various NEOG formulations.
Skin permeation study: in vitro
Franz diffusion cell was used to evaluate the in vitro skin permeation of ACV. The skin permeation ability of ACV from various NEOG formulation was monitored by sampling rat from 0 to 24 h (). Investigations revealed maximum skin permeation flux for NEOG A (6.91 μg/h/cm2), while NEOG C showed minimum drug skin permeation (6.34 μg/h/cm2) (). This slow permeation through NEOG C formulation could be due to slow release of drug on skin (Upadhyay et al. Citation2007). The flux (J) was calculated from the slope of the curve. The permeability coefficient (P) and diffusion coefficient (D) was determined as (Aslani and Kennedy Citation1996).
(7)
(8)
where J is steady state flux, C is concentration of drug, h is the thickness of skin and L is lag time.
Figure 6. Cumulative drug permeated through hairless pig skin versus time curve.
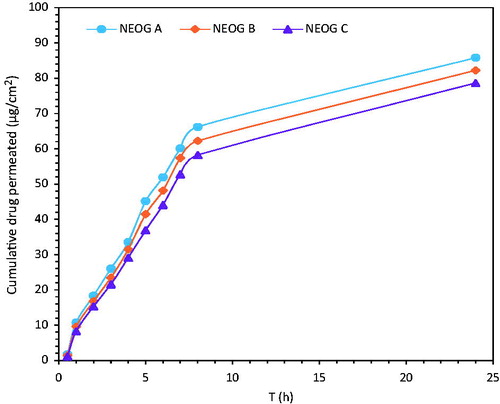
The thickness of the skin was 460 ± 40 μm. The results of NEOG suggested sustained release of ACV for 24 h and showed its potential for topical delivery of ACV.
Stability studies
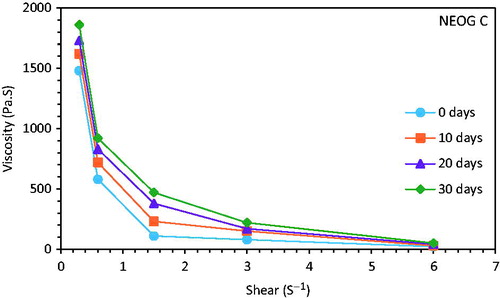
NEOG formulations were subjected to mechanical stress to test their stability. For NEOG C, there was no phase separation even after centrifugation at 10,000 rpm for 10 min, while for NEOG A and NEOG B the phase was separated after 5 and 10 min at 10,000 rpm, respectively. The viscosity of the NEOG C formulations was found to rise with time, which suggests the rearrangement of the tubular network into further dense conformation (Upadhyay et al. Citation2007). A typical shear versus viscosity curve for NEOG C formulation is shown in .
Figure 7. A typical flow curve in between viscosity versus shear of ACV-loaded NEOG C formulation at 0 days (circle), 10 days (squares), 20 days (triangles) and 30 days (diamonds).
Conclusion
In this study, NEOG system of ACV was successfully developed using IPM, Span 60/Tween 80, and doubled-distilled water, as an oil, surfactants and aqueous phase, respectively. Pseudo-ternary Phase diagrams depending on surfactant ratio (Kw) and oil to surfactant ratio (Kw) was plotted. Phase diagrams revealed increase in optically isotropic region of OG system with surfactant ratio (Kw). The non-birefringent, clear isotropic solution exhibited the inverse micellar nature of the organogel. The NEOG C formulation showed good storage (G′) and loss (G″) moduli with more compact network structures. Gel-sol transition temperature (Tg) and fractal dimension (Df) results highlighted increased density of the tubular network with surfactant ratio (Kw). However, in vitro drug release result showed slower drug release rate (10.18%/h0.7/cm2) for NEOG C as compared to NEOG A and NEOG B. Skin permeation results revealed maximum drug skin permeation flux for NEOG A (6.91 μg/h/cm2), while NEOG C (6.34 μg/h/cm2) showed minimum. Therefore, developed NEOG system of ACV suggested high gelation property with good stability. The high gelling ability of the developed NEOG system may attribute to the combination of sustained and site specific delivering properties which can overcome the problems associated with conventional therapy and can be used as a potential drug reservoir system for the topical delivery of other drugs.
Funding information
The author Kuldeep Rajpoot is grateful to AICTE, New Delhi, India, for financial support in the form of Junior Research Fellowship.
Disclosure statement
The author declares no conflict of interest. The author alone is responsible for the content and writing of the article.
References
- Aslani P, Kennedy RA. 1996. Studies on diffusion in alginate gels. I. Effect of cross-linking with calcium or zinc ions on diffusion of acetaminophen. J Control Release. 42:75–82.
- Baeten JM, Reid SE, Delany-Moretlwe S, Hughes JP, Wang RS, Wilcox E, et al. 2012. Clinical and virologic response to episodic acyclovir for genital ulcers among HIV-1 seronegative, herpes simplex virus type 2 seropositive African women: a randomized, placebo-controlled trial. Sex Transm Dis. 39:21–24.
- Bahrami G, Mirzaeei S, Kiani A. 2005. Determination of acyclovir in human serum by high-performance liquid chromatography using liquid-liquid extraction and its application in pharmacokinetic studies. J Chromatogr B Analyt Technol Biomed Life Sci. 816:327–331.
- Boddu SH, Bonam SP, Wei Y, Alexander K. 2014. Preparation and in vitro evaluation of a pluronic lecithin organogel containing ricinoleic acid for transdermal delivery. Int J Pharm Compd. 18:256–261.
- Bramwell BL, Williams LA. 2012. The use of Pluronic lecithin organogels in the transdermal delivery of drugs. Int J Pharm Compd. 16:62–63.
- Bryson YJ, Dillon M, Lovett M, Acuna G, Taylor S, Cherry JD, et al. 1983. Treatment of first episodes of genital herpes simplex virus infection with oral acyclovir. A randomized double-blind controlled trial in normal subjects. N Engl J Med. 308:916–921.
- Carcao MD, Lau RC, Gupta A, Huerter H, Koren G, King SM. 1998. Sequential use of intravenous and oral acyclovir in the therapy of varicella in immunocompromised children. Pediatr Infect Dis J. 17:626–631.
- Collins P, Oliver NM. 1982. Acyclovir treatment of cutaneous herpes in guinea pigs and herpes encephalitis in mice. Am J Med. 73:96–99.
- de Miranda P, Blum MR. 1983. Pharmacokinetics of acyclovir after intravenous and oral administration. J Antimicrob Chemother. 12:29–37.
- Elia G, Camero M, Decaro N, Lovero A, Martella V, Tempesta M, Buonavoglia C, Crescenzo G. 2015. In vitro inhibition of caprine herpesvirus 1 by acyclovir and mizoribine. Res Vet Sci. 99:208–211.
- Fu X, Yang Y, Wang N, Wang H, Yang Y. 2007. A novel chiral separation material: polymerized organogel formed by chiral gelators for the separation of D- and L-phenylalanine. J Mol Recognit. 20:238–244.
- Jwala J, Boddu SH, Shah S, Sirimulla S, Pal D, Mitra AK. 2011. Ocular sustained release nanoparticles containing stereoisomeric dipeptide prodrugs of acyclovir. J Ocul Pharmacol Ther. 27:163–172.
- Kantaria S, Rees GD, Lawrence MJ. 1999. Gelatin-stabilised microemulsion-based organogels: rheology and application in iontophoretic transdermal drug delivery. J Control Release. 60:355–365.
- Kern ER, Richards JT, Overall JC, Jr, Glasgow LA. 1983. Acyclovir treatment of experimental genital herpes simplex virus infections. I. Topical therapy of type 2 and type 1 infections of mice. Antiviral Res. 3:253–267.
- Kirilov P, Rum S, Gilbert E, Roussel L, Salmon D, Abdayem R, et al. 2014. Aqueous dispersions of organogel nanoparticles – potential systems for cosmetic and dermo-cosmetic applications. Int J Cosmet Sci. 36:336–346.
- Kogan A, Garti N. 2006. Microemulsions as transdermal drug delivery vehicles. Adv Colloid Interface Sci. 123–126:369–385.
- Mahjour M, Mauser B, Rashidbaigi Z, Fawzi MB. 1990. Effect of egg yolk lecithins and commercial soybean lecithins on in vitro skin permeation of drugs. J Control Release. 14:243–252.
- Marr PC, McBride K, Evans RC. 2013. Sugar-derived organogels as templates for structured, photoluminescent conjugated polymer-inorganic hybrid materials. Chem Commun (Camb). 49:6155–6157.
- Mitchell C, Gentry S, Boen J, Bean B, Groth K, Balfour H. Jr. 1981. Acyclovir therapy for mucocutaneous herpes simplex infections in immunocompromised patients. Lancet. 1:1389–1392.
- Mohanty B, Bohidar HB. 2005. Microscopic structure of gelatin coacervates. Int J Biol Macromol. 36:39–46.
- Monavari SH, Mirzaei Parsa MJ, Bolouri B, Ebrahimi SA, Ataei-Pirkooh A. 2014. The inhibitory effect of Acyclovir loaded nano-niosomes against herpes simplex virus type-1 in cell culture. Med J Islam Repub Iran. 28:99.
- Murdan S, Gregoriadis G, Florence AT. 1999a. Inverse toroidal vesicles: precursors of tubules in sorbitan monostearate organogels. Int J Pharm. 183:47–49.
- Murdan S, Gregoriadis G, Florence AT. 1999b. Novel sorbitan monostearate organogels. J Pharm Sci. 88:608–614.
- Murdan S, van den Bergh B, Gregoriadis G, Florence AT. 1999c. Water-in-sorbitan monostearate organogels (water-in-oil gels). J Pharm Sci. 88:615–619.
- Muthukumar M. 1989. Screening effect on viscoelasticity near the gel point. Macromolecules. 22:4656–4658.
- Panigrahi L, Pattnaik S, Ghosal SK. 2005. The effect of pH and organic ester penetration enhancers on skin permeation kinetics of terbutaline sulfate from pseudolatex-type transdermal delivery systems through mouse and human cadaver skins. AAPS PharmSciTech. 6:E167–E173.
- Peacock GF, Sauvageot J, Addo RT. 2014. Evaluation of the stability of ketoprofen in pluronic lecithin organogel and the determination of an appropriate beyond-use date. Int J Pharm Compd. 18:348–350.
- Pefile SC, Smith EW, Albrecht CF, Kruger PB. 1998. Release of rooperol tetra-acetate from topical bases: in vitro studies using silicone membrane. Int J Pharm. 161:237–243.
- Peppas NA, Brannon-Peppas L. 1994. Water diffusion and sorption in amorphous macromolecular systems and foods. J Food Eng. 22:189–210.
- Pisal S, Shelke V, Mahadik K, Kadam S. 2004. Effect of organogel components on in vitro nasal delivery of propranolol hydrochloride. AAPS PharmSciTech. 5:e63.
- Quellet C, Eicke HF. 1986. Mutual gelation of gelatin and waterin-oil microemulsion. Chimia. 40:233–238.
- Ritger PL, Peppas NA. 1987. A simple equation for description of solute release. II. Fickian and anomalous release from swellable devices. J Control Release. 5:37–42.
- Rizkov D, Mizrahi S, Cohen S, Lev O. 2010. beta-Amino alcohol selectors for enantioselective separation of amino acids by ligand-exchange capillary zone electrophoresis in a low molecular weight organogel. Electrophoresis. 31:3921–3927.
- Sagiri SS, Singh VK, Kulanthaivel S, Banerjee I, Basak P, Battachrya MK, Pal K. 2015. Stearate organogel-gelatin hydrogel based bigels: physicochemical, thermal, mechanical characterizations and in vitro drug delivery applications. J Mech Behav Biomed Mater. 43:1–17.
- Saket MM, James KC, Kellaway IW. 1984. Partitioning of some 21-alkyl esters of hydrocortisone and cortisone. Int J Pharm. 21:155–166.
- Sallam MA, Motawaa AM, Mortada SM. 2015. An insight on human skin penetration of diflunisal: lipogel versus hydrogel microemulsion. Drug Dev Ind Pharm. 41:141–147.
- Scartazzini R, Luisi PL. 1988. Organogels from lecithins. J Phys Chem. 92:829–833.
- Swaika A, Paulus A, Miller KC, Sher T, Almyroudis NG, Ball D, et al. 2012. Acyclovir prophylaxis against varicella zoster virus reactivation in multiple myeloma patients treated with bortezomib-based therapies: a retrospective analysis of 100 patients. J Support Oncol. 10:155–159.
- Upadhyay KK, Tiwari C, Khopade AJ, Bohidar HB, Jain SK. 2007. Sorbitan ester organogels for transdermal delivery of sumatriptan. Drug Dev Ind Pharm. 33:617–625.
- Wagstaff AJ, Faulds D, Goa KL. 1994. Aciclovir. A reappraisal of its antiviral activity, pharmacokinetic properties and therapeutic efficacy. Drugs. 47:153–205.
- Yu H, Huang Q. 2012. Improving the oral bioavailability of curcumin using novel organogel-based nanoemulsions. J Agric Food Chem. 60:5373–5379.