
Abstract
Objective Mineral trioxide aggregate (MTA) cements contain two types of particles, namely Portland cement (PC) (nominally 80% w/w) and bismuth oxide (BO) (20%). This study aims to determine the particle size distribution (PSD) of PC and BO found in MTA.
Materials and methods The PSDs of ProRoot MTA (MTA-P) and MTA Angelus (MTA-A) powder were determined using laser diffraction, and compared to samples of PC (at three different particle sizes) and BO. The non-linear least squares method was used to deconvolute the PSDs into the constituents. MTA-P and MTA-A powders were also assessed with scanning electron microscopy.
Results BO showed a near Gaussian distribution for particle size, with a mode distribution peak at 10.48 μm. PC samples milled to differing degrees of fineness had mode distribution peaks from 19.31 down to 4.88 μm. MTA-P had a complex PSD composed of both fine and large PC particles, with BO at an intermediate size, whereas MTA-A had only small BO particles and large PC particles.
Conclusions The PSD of MTA cement products is bimodal or more complex, which has implications for understanding how particle size influences the overall properties of the material. Smaller particles may be reactive PC or unreactive radiopaque agent. Manufacturers should disclose particle size information for PC and radiopaque agents to prevent simplistic conclusions being drawn from statements of average particle size for MTA materials.
Introduction
Mineral trioxide aggregate (MTA) cement has a range of uses in endodontics.[Citation1–3] A typical MTA cement contains one part bismuth oxide (BO) and four parts Portland cement (PC).[Citation4,Citation5] While essential for radiographic identification of the material, the inclusion of BO extends the setting time [Citation6–10] and influences the physical properties of the set cement, altering its microhardness,[Citation6] compressive strength,[Citation10–12] porosity,[Citation11] biocompatibility [Citation13] and the speed of formation of reaction products such as calcium silicate hydrate.[Citation14]
The particle sizes of both the BO and PC components can vary widely, which has implications for the performance of the cement. For example, cements with smaller particles of PC will be more likely to penetrate into dentinal tubules, set quickly and give greater initial release of calcium hydroxide.[Citation15,Citation16] There are also effects of the particle size of BO on the cement, with nano-sized BO particles contributing positively to the properties of the set cement, and BO particle sizes of 10 μm or more having the opposite effect.[Citation5]
In past studies, the particle size distribution (PSD) of common MTA cements has been examined using laser diffraction, a rapid, accurate and reproducible measurement method that is used widely to assess the PSD of materials with fine particles, including industrial PC.[Citation17] In this technique, as individual particles pass through a laser beam they scatter light at angles that are inversely related to their size.[Citation18] A recent study of the particle size of ProRoot MTA (Dentsply Maillefer, Ballaigues, Switzerland) (MTA-P) revealed a bimodal distribution with 10% of particles below (d10) 1.13 μm, 50% of particles below (d50) 1.99 μm, and 90% of particles below (d90) 4.30 μm. By comparison, MTA-Angelus (Angelus Soluções Odontológicas, Londrina, Brazil) (MTA-A) showed a bimodal distribution with much larger particle sizes overall, with the d10 at 4.15 μm, d50 at 12.72 μm and d90 at 42.66 μm.[Citation17]
Given that a bimodal distribution implies the presence of at least two components of differing particle size, it was of interest to determine the respective contributions of PC and BO to the PSDs of the two commercial MTA cements, MTA-P and MTA-A.
Materials and methods
Particle size assessment
Particle size analysis of MTA-P, MTA-A, PC and BO was performed using laser diffraction, as described in Ha,[Citation17] using a MicroPlus Analyzer (Malvern Instruments, Worcestershire, UK). This instrument can measure the size of particles from 0.05 to 500 μm in diameter.[Citation19]
For MTA, the refractive index (RI) used was 1.844, which was calculated as the weighted mean of 80% PC (RI = 1.68) and 20% BO (RI = 2.5). The Mie model was used for calculating particle size.[Citation20] The particle absorption index used was 0.1. One liter of distilled water was used to disperse 1 g of particles from each material. Agglomeration of particles during testing was prevented by the combination of sodium hexametaphosphate in the water (1 g/l) together with continuous ultrasonic agitation.
MTA-P (lot 09001921), MTA-A (lot 21381) and BO samples (lot F02U033, Alfa Aesar®, MA) were analyzed, together with three samples of PC. PC1 (lot SI0702, SiPowders, Toowoomba, Australia) was unmodified and was representative of common general purpose PC. PC2 (lot UFGP1707, SiPowders, Toowoomba, Australia) was derived from PC1 and had undergone jet milling to reduce the mean particle size to <14 μm. PC3 (lot UFGP2307, SiPowders, Toowoomba, Australia) in turn was derived from PC2 using selective particle filtration, and had a mean particle size <8 μm.
Statistical analysis
Data from PC1, PC2, PC3 and BO served as a reference for the deconvolution of the PSD curves of MTA-A and MTA-P using a non-linear least squares fit method. For both MTA-A and MTA-P, the normalized frequency (F) at a given particle size was defined as F = (A × PC1) +(B × PC2) + (C × PC3) + (D × BO), where A, B, C and D are all constant coefficients for either MTA-A or MTA-P. The equations were solved to minimize the sum of squared residuals between actual and predicted values, using values for A–D which were either positive or zero (component not present). The data was then expressed as the actual constant coefficients were solved to predict those tested standard components present within MTA-P and MTA-A.
Scanning electron microscopy
Dry MTA-P (lot 201404–01) and MTA-A (lot 21934) powders were lightly poured onto carbon adhesive discs on scanning electron microscopy (SEM) specimen stubs and left uncoated. Excess powder was removed using compressed air. Samples were placed into a Phenom ProX (Malvern Instruments, Worcestershire, UK) with images taken at 10 kV with a magnification of 1900 × under vacuum conditions. Energy-dispersive X-ray spectroscopy (EDX) was performed on the same field of view to determine the elements present in the MTA powder.
Results
All pure materials (BO, PC1, PC2 and PC3) showed a near Gaussian distribution for particle size, with mode distribution peaks at 10.48, 19.31, 6.64 and 4.88 μm, respectively (). In order from largest to smallest, the three PC materials followed the expected trend. BO particles were on an average smaller than PC1 but larger than PC2 and PC3. shows PSD for BO and the three PC samples, summarized according to the d10, d50 and d90.
Figure 1. Normalized particle size distributions for BO and three PC samples of differing size.
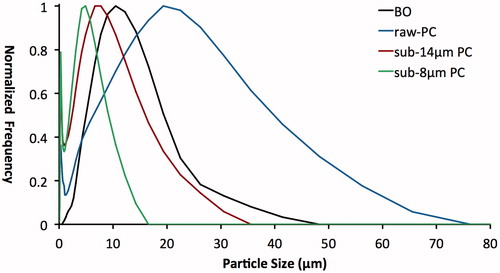
Table 1. Particle size distribution of PC and BO libraries, MTA-P and MTA-A.
Table 2. Energy-dispersive X-ray spectroscopy (EDX) on points in .
The PSD for MTA-P had six peaks (0.42, 3.09, 5.69, 12.21, 22.49 and 41.43 μm). These correspond well to PC3, BO and PC1 as its components (). In contrast, the PSD for MTA-A had only two maxima (9.0 and 30.53 μm), which corresponded to BO and PC1 as its two components ().
Figure 2. Particle size distribution of MTA-P and MTA-A and the associated deconvoluted components.
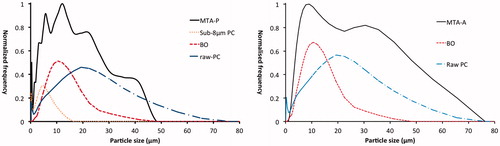
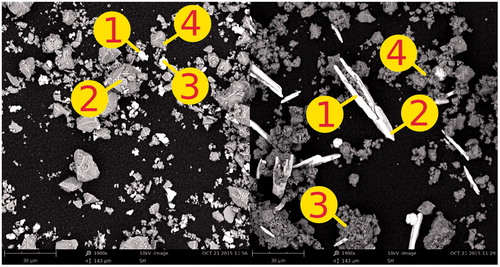
Figure 3. SEM images of MTA-P (left) and MTA-A (right). Bismuth oxide (white) and Portland cement particles (grey) particles can be seen. Refer to for EDX of four points from each image.
Backscatter SEM
Backscattered SEM with EDX images of MTA-P and MTA-A revealed two predominant crystalline structures in both powders. For both MTA-P and MTA-A, one component of the powder was bright indicating a high atomic number, and displayed a different morphology.
Energy-dispersive X-ray spectroscopy
Energy-dispersive X-ray spectroscopy was performed on both powders on the SEM field of view. This established that the strongly bright high atomic number component contained bismuth and oxygen (thus BO) while the other powder component contained calcium and silicon (thus PC). Thus, MTA-P illustrated smaller BO and smaller PC particles than MTA-A. This corresponds to the deconvolution results.
Discussion
An understanding of the particle size of MTA is fundamental to appreciating the influence of this parameter on its setting reactions, physical properties when mixed and after setting, and extent of penetration into dentin tubules. The results of this study show that there is a bimodal distribution for both MTA-P and MTA-A. For MTA-P, both fine and larger particles of PC are present, and BO is intermediate in size by comparison. In contrast, MTA-A is simpler in composition, with finer BO particles and larger PC particles.
Our results agree with a Komabayashi that MTA-A has a wider range, and that MTA-P has fewer large particles, however, our results as differ as Komabayashi says that MTA-A also has a high number of small particles.[Citation21] This difference could be attributed the methods of testing as flow particle analysis data have been presented in high power and low power fields. Neither of which are able to completely assess the full range of the PSD found in MTA and PC.
The findings that MTA-A had larger particles than MTA-P are similar to another laser diffraction study,[Citation22] however, differences in PSD between MTA-A and MTA-P are more marked in this study. The variance between studies could be attributed to the use of water as the testing medium instead of alcohol as well as differences between testing batches.
The present findings provide insight into variations in performance between different MTA products. Particles of MTA can penetrate into and obstruct dentinal tubules, which explains the ability of MTA to provide an effective seal.[Citation23] MTA-P is more resistant to bacterial leakage than vertically condensed gutta percha and sealer,[Citation24] a fact which could be due in part to its smaller PC particles, which will penetrate further into dentinal tubules.
As with many other dental materials, the handling properties of PC varies according to particle size and particle shape.[Citation15] Particle size modification is a common method to accelerate setting reactions through increased surface area.[Citation22] For MTA, only the PC particles contribute to the setting reaction, since BO is an inert filler. Adding BO to PC separates the PC particles by diffusion and prolongs the setting reaction, with the material taking longer to reach its final set. Increasing BO enhances radiopacity but at the expense of slower setting,[Citation9,Citation12] reduced compressive strength and increased water uptake.[Citation12] The same will be true if other radiopaque agents are substituted for BO.[Citation25,Citation26]
The PSD of MTA-P and MTA-A can be compared against Biodentine (Septodont, Saint-Maur-des-Fossés) illustrating that its largest and median particles are smaller than MTA-P and MTA-A.[Citation22] From communications with the manufacturer, the composition of Biodentine features the replacement PC with calcium silicate powder, various additives and zirconium oxide instead of BO as its radiopaque agent. Although the smaller PSD of Biodentine may account for a faster setting time than MTA, the ingredients are different and therefore comparisons relating to the PSD of the products are speculative.[Citation22]
It is recommended that any advertising by manufacturers around the topic of particle size should state as a minimum the d10, d50 and d90 parameters of the product as well as the particle size of the radiopaque agent used. This would avoid simplistic interpretations of one product being superior on the basis of having a lower mean particle size (which would infer faster setting), since the smaller particles could well be the radiopaque agent rather than the PC, as is the case for MTA-A. This point could well become more important in the future with the possible inclusion of nano-sized fillers rather than micro-sized fillers in future to enhance the physical properties of MTA.[Citation5]
Declaration of interest
The authors declare they have no conflict of interest.
Acknowledgements
We thank Gunz Dental (Sydney, Australia) and Dentsply Maillefer (Ballaigues, Switzerland) for providing MTA samples for the study. The expert assistance of SiPowders Pty Ltd, for assistance in particle size analysis and ATA Scientific for assistance with SEM imaging is acknowledged gratefully.
Funding
This study was supported by grants from the Australian Dental Research Foundation (Grant 2011001653) and the Australian Society of Endodontology.
References
- Parirokh M, Torabinejad M. Mineral trioxide aggregate: a comprehensive literature review – part I: chemical, physical, and antibacterial properties. J Endod. 2010;36:16–27.
- Torabinejad M, Parirokh M. Mineral trioxide aggregate: a comprehensive literature review – part II: leakage and biocompatibility investigations. J Endod. 2010;36:190–202.
- Parirokh M, Torabinejad M. Mineral trioxide aggregate: a comprehensive literature review – part III: clinical applications, drawbacks, and mechanism of action. J Endod. 2010;36:400–413.
- Torabinejad J, White DJ. Inventors; tooth filling material and method of use. US patent publication US 5,415,547. 1995.
- Saghiri MA, Gutmann JL, Orangi J, et al. Radiopacifier particle size impacts the physical properties of tricalcium silicate-based cements. J Endod. 2015;41:225–230.
- Grazziotin-Soares R, Nekoofar MH, Davies TE, et al. Effect of bismuth oxide on white mineral trioxide aggregate: chemical characterization and physical properties. Int Endod J. 2014;47:520–533.
- Chiang TY, Ding SJ. Comparative physicochemical and biocompatible properties of radiopaque dicalcium silicate cement and mineral trioxide aggregate. J Endod. 2010;36:1683–1687.
- Camilleri J. Evaluation of the physical properties of an endodontic Portland cement incorporating alternative radiopacifiers used as root-end filling material. Int Endod J. 2010;43:231–240.
- Hungaro Duarte MA, Minotti PG, Rodrigues CT, et al. Effect of different radiopacifying agents on the physicochemical properties of white Portland cement and white mineral trioxide aggregate. J Endod. 2012;38:394–397.
- Formosa LM, Mallia B, Camilleri J. The effect of curing conditions on the physical properties of tricalcium silicate cement for use as a dental biomaterial. Int Endod J. 2012;45:326–336.
- Coomaraswamy KS, Lumley PJ, Hofmann MP. Effect of bismuth oxide radioopacifier content on the material properties of an endodontic portland cement-based (MTA-like) system. J Endod. 2007;33:295–298.
- Camilleri J. The physical properties of accelerated Portland cement for endodontic use. Int Endod J. 2008;41:151–157.
- Min KS, Chang HS, Bae JM, et al. The induction of heme oxygenase-1 modulates bismuth oxide-induced cytotoxicity in human dental pulp cells. J Endod. 2007;33:1342–1346.
- Chen CC, Ho CC, David Chen CH, Ding SJ. Physicochemical properties of calcium silicate cements for endodontic treatment. J Endod. 2009;35:1288–1291.
- Bentz DP, Garboczi EJ, Haecker CJ, Jensen OM. Effects of cement particle size distribution on performance properties of portland cement-based materials. Cem Concr Res. 1999;29:1663–1671.
- Bishnoi S. Vector modelling of hydrating cement microstructure and kinetics [PhD thesis]. Tokyo: University of Tokyo 2008; [cited 2013 Jan 30]. Available from: http://web.iitd.ac.in/∼bishnoi/files/ShashankBishnoiPhDThesis.pdf.
- Ha WN, Kahler B, Walsh LJ. Particle size changes in unsealed mineral trioxide aggregate powder. J Endod. 2014;40:423–426.
- Wedd MW. Determination of particle size distributions using laser diffraction. Educ Reso Part Techn. 2003;4:1–4.
- SelectScience. Malvern Mastersizer: Malvern Instruments [Internet]. 2013; [cited 2013 Jan 31]. Available from: http://www.selectscience.net/products/mastersizer-microplus/?prodID=9785.
- International Organization for Standardization. Particle size analysis – laser diffraction methods. International Standard; ISO 13320:2009. Geneva: ISO; 2009.
- Komabayashi T, Spangberg LS. Comparative analysis of the particle size and shape of commercially available mineral trioxide aggregates and Portland cement: a study with a flow particle image analyzer. J Endod. 2008;34:94–98.
- Ha WN, Bentz DP, Kahler B, Walsh LJ. D90: the strongest contributor to setting time in mineral trioxide aggregate and Portland cement. J Endod. 2015;41:1146–1150.
- Luketic SF, Malcic A, Jukic S, et al. Coronal microleakage of two root-end filling materials using a polymicrobial marker. J Endod. 2008;34:201–203.
- Al-Hezaimi K, Naghshbandi J, Oglesby S, et al. Human saliva penetration of root canals obturated with two types of mineral trioxide aggregate cements. J Endod. 2005;31:453–456.
- Ginebra MP, Albuixech L, Fernandez-Barragan E, et al. Mechanical performance of acrylic bone cements containing different radiopacifying agents. Biomaterials. 2002;23:1873–1882.
- Mitchell W, Bridget Matthews J, Stone MH, et al. Comparison of the response of human peripheral blood mononuclear cells to challenge with particles of three bone cements in vitro. Biomaterials. 2003;24:737–748.