Abstract
Objectives:
The aim of this analysis was to assess the cost-effectiveness of tapentadol PR (prolonged release) compared with oxycodone CR (controlled release) in severe non-malignant chronic pain patients in whom controlled release morphine was ineffective or not tolerated.
Methods:
A Markov model was developed to assess costs and benefits over a 1-year time horizon from the National Health Service perspective in the UK. Patients could either continue on 2nd line therapy or switch to 3rd line opioid due to lack of efficacy or poor tolerability. Patients failing also 3rd line therapy entered the final absorbing health state (4th line). Data on tolerability, efficacy, and utilities for tapentadol and oxycodone were obtained from the three comparative phase III clinical trials. Costs of resource consumption associated with opioid treatment were derived from a retrospective database analysis of anonymized patient records.
Results:
The model results predicted that initiating 2nd line therapy with tapentadol leads to higher effectiveness and lower costs vs oxycodone. For the overall population included in the clinical trials, mean annual costs per patient when treated with tapentadol and oxycodone were £3543 and £3656, respectively. Treatment with tapentadol, while cheaper than oxycodone, was more effective (0.6371 vs 0.6237 quality-adjusted life years (QALYs) for tapentadol and oxycodone, respectively), meaning that tapentadol dominated oxycodone. For the sub-group of opioid-experienced patients with severe pain at baseline the ranking in terms of costs and QALYs remained unchanged. Extensive sensitivity analyses showed that conclusions about the cost-effectiveness are consistent.
Conclusions:
The cost-effectiveness study suggested that initiating 2nd line treatment in patients with severe non-malignant chronic pain in the UK with tapentadol instead of oxycodone improves patients’ quality-of-life and is less costly. Key limitations when interpreting the results are the use of different sources to populate the model and restricted generalizability due to data extrapolation.
Introduction
The International Association for the Study of Pain (IASP) defines chronic pain as pain persisting beyond the normal tissue healing time, usually up to 3 months. One in eight (13%) adults in the UK suffers from moderate-to-severe chronic pain, with osteoarthritis (OA) (34%), pain from deteriorated or herniated disks (15%), and traumatic injury (12%) as the most common causesCitation1.
Chronic pain has a major impact on quality-of-life. The presence of ‘any’, ‘significant’, and ‘severe’ chronic pain had progressively more marked adverse associations with employment, interference with daily activities, and all measured dimensions of general healthCitation2. According to a secondary analysis including over 15,000 patients, musculoskeletal pain (i.e., osteoarthritis, rheumatoid arthritis, and back pain) has a larger negative impact on quality-of-life compared to other chronic disease (e.g., cardiovascular, cerebrovascular, gastrointestinal conditions, and psychiatric disorders)Citation3. The impact on activities of daily living is large (i.e., measured as impact on quality-of-life)Citation4 and of long duration (i.e., the mean duration of pain is 5.9 years according to a European survey)Citation1. For neuropathic pain and diabetic neuropathy reductions in quality-of-life measures have been shown as pain severity increasesCitation5,Citation6.
In patients with OA, chronic pain may cause walking disability. This again is associated with a doubling of cardiovascular mortalityCitation7, as well as a substantial increase in all-cause mortality. In addition, a survival analysis in ∼6000 individuals found that chronic pain itself is associated with increased risk of mortality, independent of socio-demographic factorsCitation8.
Chronic pain is often accompanied by a significant behavioural response and varying degrees of disability. Physiological and psychological comorbidities such as impaired sleep, fatigue, and depression impair the quality-of-life of chronic pain patients. Also, individual suffering chronic pain brings substantial economic burden from medical expenses, lost wages, and reduced productivityCitation9,Citation10. Effective therapy providing major pain reduction improves sleep, reverses depression, and provides significant improvement in quality-of-lifeCitation11, as well as delivering increased ability to work and reducing work interferenceCitation12.
The aim of chronic pain treatment is to reduce pain and improve functionality and quality-of-life. To reduce refractory chronic non-malignant pain effectively, the use of strong analgesics such as opioids is recommended by multiple medical societies and organizations and the prescriptions of opioids for chronic non-malignant pain are increasing accordinglyCitation13–15.
In the UK, 62% of pain management specialists indicated that they prescribe opioids for non-malignant pain in a survey from 2001Citation1Citation6. Recent figures on opioid use in the UK and US confirm a rapid increase in prescriptionsCitation17. The common first choice of strong opioid for the treatment of chronic pain conditions is morphine due to its low cost. However, not all patients have good pain relief with any individual drug, or discontinue because of intolerable adverse eventsCitation18. A substantial number of patients receiving opioids do not feel satisfied with their treatment and even stop therapy against medical adviceCitation19–23. As a consequence discontinuation rates with opioids in chronic non-malignant pain are highCitation24. This evidence highlights the need for a strong opioid with an improved tolerability.
Tapentadol is a novel, strong, centrally acting analgesic which combines two mechanisms of action, μ-opioid receptor agonism and noradrenaline re-uptake inhibition, in a single molecule, targeting both nociceptive and neuropathic pain pathwaysCitation25,Citation26. Its two mechanisms of action provide analgesia at similar levels to potent narcotic analgesics such as oxycodone or morphine with an improved side-effect profileCitation27–30. In phase III randomized controlled trials in patients with OA or chronic low back pain (LBP), tapentadol PR (prolonged-release tablet) demonstrated pain relief comparable to oxycodone controlled release (CR), but with significantly less nausea, vomiting and constipation and fewer treatment discontinuationsCitation31–33.
The aim of this pharmacoeconomic analysis was to assess whether tapentadol is a cost-effective treatment option compared with oxycodone in severe non-malignant chronic pain patients in whom controlled release morphine was ineffective or not tolerated.
Methods
Model structure and assumptions
A Markov state transition model was developed to compare the cost-effectiveness of initiating therapy with tapentadol PR (referred to tapentadol hereafter) vs oxycodone CR (referred to oxycodone hereafter) in the United Kingdom (UK) in patients with severe chronic non-malignant pain in whom controlled release morphine was ineffective or not tolerated. Oxycodone was chosen as a comparator because it was both the active comparator in the clinical trials and, according to sales figures (IMS database, MAT/9/2011), the most commonly used oral opioid in the UK.
The model’s cycle length is 4 weeks, i.e., 28 days. The model was run for a time horizon of 13 cycles (equal to 1 year). The model comprises four main health states—‘withdrawal due to adverse events (AEs)’, ‘withdrawal due to lack of efficacy’, ‘AEs not leading to withdrawal’, and ‘no withdrawal and no AEs’. These states determine whether a patient continues with the treatment or switches to another opioid therapy.
Patients enter the model at the start of a 2nd line therapy (‘2nd line titration’) as they are assumed to have failed treatment with morphine due to ineffectiveness or intolerability. After the titration phase (4 weeks), patients may withdraw from the treatment either due to severe AEs or due to lack of efficacy. Withdrawal would result in a switch to another opioid treatment (oxycodone, transdermal fentanyl (TDF), transdermal buprenorphine (TDB), or oxycodone/naloxone combination). Patients who experience mild-to-moderate AEs (‘AEs not leading to withdrawal’) are assumed to remain on the current therapy and continue their treatment in the subsequent cycle (maintenance). Patients tolerating the treatment (‘no withdrawal and no AEs’) also remain on the current opioid therapy. These sequences are repeated for 3rd line therapy ().
Figure 1. Simplified Markov model structure. AEs, adverse events; TDF, transdermal fentanyl; TDB, transdermal buprenorphine.
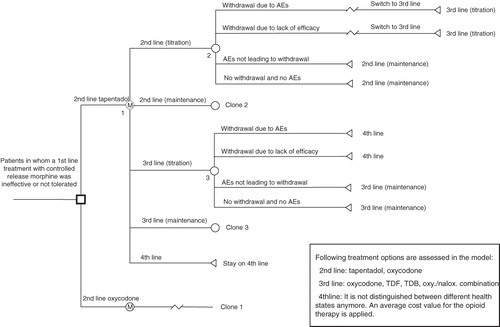
Patients who withdraw from a 3rd line treatment, due to severe AEs or a lack of efficacy, switch to a 4th line opioid treatment which is the final absorbing, undifferentiated health state.
Since the model comprises a relatively short timeframe of 1 year, death was not considered in the analysis.
Specific costs and effects are assigned to each health state. Effects are measured in utilities which reflect the health-related quality-of-life. Costs are expressed in British Pounds (GBP, £) and were calculated from the perspective of the National Health Service (NHS).
The model computes costs and quality-adjusted life years (QALYs) for two analyses that differ in terms of the clinical data applied for tapentadol and oxycodone. In the total population analysis model inputs were derived from the results of the total population of patients in the three phase III clinical trials in OA and LBP, containing almost 3000 patients with moderate-to-severe pain at baseline (87% with severe pain). A pooled analysis of the three trials was conducted as they all had the same study design. The objective of pooling was to provide a broad assessment of efficacy of tapentadol depot compared to oxycodone CR and placebo across studies of identical design in different pain conditions. Patient characteristic as well as pooling methods are described in detail elsewhereCitation33. For the sub-group analysis, only data for opioid-experienced patients with severe pain at baseline were used. The sub-group consisted of 311 out of 980 patients receiving tapentadol and 285 out of 1001 patients receiving oxycodoneCitation34.
Data sources
Tolerability and efficacy
To model the transition of patients between health states as precisely as possible, probabilities of withdrawal due to AEs, withdrawal due to lack of efficacy, and AEs not leading to withdrawal were derived directly from the clinical studies of tapentadol and oxycodone for each model cycle (28 days) separatelyCitation33,Citation34. These 28-days probabilities were available for the first four cycles, which corresponds to the trials’ duration of 112 days (15 weeks). As no data beyond 112 days were available, the average probabilities of tapentadol and oxycodone in the fourth cycle were applied to the remaining cycles 5–13 ().
Table 1. Probabilities of withdrawal due to AEs, withdrawal due to lack of efficacy, and AEs not leading to withdrawal for tapentadol and oxycodone.
The probability of ‘no withdrawal and no AEs’ (see ) was calculated as: probability of ‘withdrawal due to AEs’ − probability of ‘withdrawal due to lack of efficacy’ − probability of ‘AEs not leading to withdrawal’. Patients who discontinued due to reasons unrelated to the treatment (e.g., violation of study protocol) were not considered in the analysis as a specific outcome. However, those patients were removed from the total number of patients starting in each cycle. It is expected that the proportions of such patients are equal in the treatment arms (subject to random chance), as the drop out was due to reasons other than opioid medication.
As there is no head-to-head trial comparing all opioids assessed in the model, data for TDF, TDB and oxycodone/naloxone combination were obtained from several trials which were identified via a systematic search for randomized, placebo-controlled trials with at least 2-weeks duration, performed in MEDLINE database. However, only one study for oxycodone/naloxone combinationCitation35 was identified that met these criteria. Although the study had an enriched-enrolment design, including only patients who had tolerated oxycodone in the pre-treatment phase, it was considered in the model as no other data source was available. For TDF and TDB, studies that otherwise did not meet the inclusion/exclusion criteria had to be selected. Open-label studies were chosen to obtain probabilities for these comparators because these studies fit best to the analysis framework. The study for TDFCitation36 was an open-label, non-randomized, 12-month study in patients with chronic non-malignant pain who were pre-treated with a strong opioid and had at least moderate pain relief. The study for TDBCitation37 was an open-label, long-term study (6 months) evaluating the efficacy and tolerability of TDB in the management of moderate-to-severe chronic cancer and non-cancer pain, whereby the data for non-cancer pain were considered.
In these trials, data on tolerability and efficacy of the respective opioids were reported for the whole study duration only. To derive transition probabilities per model cycle, it was assumed that TDF, TDB, and oxycodone/naloxone combination have the same ratio between the probability of the outcome in each specific cycle vs the probability for the whole trial period as observed for tapentadol and oxycodone. First, ratios were calculated by dividing the probability in each cycle, observed for tapentadol and oxycodone, by the probability for the whole trial period. For TDF, TDB, and oxycodone/naloxone, these cycle-specific ratios were then applied to the probability of the specific health state for the whole study duration. Thus, the diminishing rate of the probabilities of withdrawal or AEs over time could also be applied to other opioids. The resulting cycle-specific probabilities for TDF, TDB, and oxycodone/naloxone are listed in .
Table 2. Probabilities of withdrawal due to AEs, withdrawal due to lack of efficacy, and AEs not leading to withdrawal for TDF, TDB, and oxycodone/naloxone combination.
Opioid doses and associated costs
For both analyses, the mean initial and maintenance daily doses of tapentadol and oxycodone are taken from published sources (Lange et al.Citation33 for the total population, Obradovic et al.Citation34 for the sub-group population). To calculate the total daily doses (TDDs) for the other opioids, equianalgesic dose ratios (EDRs) were usedCitation38,Citation39. EDR refers to the ratio of the dose of two opioids required to produce the same analgesic effect. The resulting TDDs for the opioids () were relevant for the subsequent calculation of the associated opioid costs during titration and maintenance phase.
Table 3. Total daily opioid doses applied in the model.
To derive daily drug costs, the healthcare payer relevant costs per mg were multiplied by the respective TDD. Drug costs were obtained from the British National Formulary (BNF), version 61 (March 2011), and the Monthly Index of Medical Specialities (MIMS) June 2011. Daily total costs were based on average NHS cost per mg ()Citation40.
Table 4. Model relevant daily drug costs.
Resource consumption and costs
Costs for resource consumption, i.e., physician visits and co-medication, such as laxatives and anti-emetics, were derived from a UK medical research database of anonymised patient records from information entered by general practices (GP) in the ViSion system. The retrospective database was created by The Health Improvement Network (THIN). The algorithm used in the cohort study was validated to generate costs adjusted to 2007 prices, but these were updated to 2009/2010 values by applying the GDP deflator supplied by Her Majesty’s (HM) TreasuryCitation41.
To estimate the average model relevant regular treatment costs for a 2nd line therapy, patients who failed a 1st line monotherapy with a strong opioid and switched to a 2nd line therapy with oxycodone were selected in the database analysis. For the model, it was assumed that the regular treatment costs, including administration and co-medication costs but excluding opioid costs, are the same across the treatment alternatives considered. Further, in the database it was only possible to distinguish between patients either with or without adverse events. Therefore, it was assumed that patients incur the same costs regardless of the severity of AEs and as a result of insufficient pain relief. Average 3rd line treatment costs were calculated likewise, based on patients who failed a 2nd line monotherapy with a strong opioid. Since no cost data for a 4th line therapy were available at time of creation of this publication, it was conservatively assumed that these costs are reflected by the average costs of the 3rd line therapy (). The assumptions around treatment and adverse event cost add uncertainty to the model results and the impact of uncertainty was therefore explored in sensitivity analyses.
Table 5. Model relevant costs for physician visits and co-medication.
Utilities
The EQ-5D indices were obtained from the clinical trials of tapentadol. To fit the model structure, utilities were analysed post hoc for each health state separatelyCitation34. As there were insignificant differences between tapentadol and oxycodone within each health state the average values were used. Therefore, it was assumed that utility values depend on the respective health state and not the opioid administered.
Utility values for the total population and sub-group are presented in . Utilities for health states were obtained from the weighted average of tapentadol and oxycodone values at end-point. A summary of utilities values used in the model is presented in .
Table 6. Model relevant utility weights for the total population and sub-group.
Table 7. Summary of model relevant utility weights.
As the causative disease is not treated by the pain medication, the best outcome a patient can reach is an annual utility weight for ‘no withdrawal and no AEs’ which was estimated to be 0.695 and 0.622 for total population and sub-group, respectively. While patients receive 2nd and 3rd line opioid treatments, they pass different health states during each model cycle. If a health state (e.g., ‘withdrawal due to AEs’) is associated with a negative impact on HRQoL, this is reflected by a lower utility weight.
It was assumed that patients who initiate a 4th line therapy have the worst possible utility since they failed (either due to severe AEs or to a lack of efficacy) on three prior opioid therapies. Therefore, the baseline utilities of ‘withdrawal’ (weighted average of withdrawal due to AEs and lack of efficacy), equating to 0.422 and 0.310 for total and sub-group population, respectively, were attributed the 4th line treatment.
Switch rates
Due to a lack of published data, switch rates from oxycodone to another opioid therapy were estimated by UK clinical experts within the frame of a two-step Delphi panel (). The panel included physicians with substantial experience in treating pain patients. As tapentadol was not launched at the time the panel was convened (November 2009), the switch rates identified for oxycodone were used.
Table 8. Model relevant treatment switches.
Sensitivity analyses
Probabilistic sensitivity analysis (PSA) was performed to assess the overall effect of parameter uncertainty in the model. In each simulation run, a value for each parameter was sampled from an appropriate distribution. This was repeated 5000 times and generated a random sample of incremental cost and effect estimates of tapentadol vs oxycodone, visualized in a scatterplot. Additionally, a cost-effectiveness acceptability curve (CEAC) was produced to show the probability of tapentadol being cost-effective compared to oxycodone at different values of the WTP (willingness-to-pay). The resulting probability represents the percentage of model simulations where tapentadol shows an ICER below a given ICER threshold compared to oxycodone.
Cost parameters followed a gamma distribution, utility parameters, and transition probabilities beta distributions. The shape of the distributions was determined by the expected values and the standard errors (SE) of the respective parameters. SEs for utilities were derived from the phase III clinical trials. SEs were not available for the cost of resource consumption. It was assumed that the SEs amount to 20% of the respective mean value. This produces relatively broad distributions of costs and can therefore be considered as a valid approach. The SE of transition probabilities were calculated applying the standardized Wald formula. Wald formula is the simplest and most commonly used formula for calculating binomial standards errors (SE): SE = SQRT(p*(1 − p)/N); p is the proportion of an event (corresponding probability) and N is the number of patients.
Deterministic one-way sensitivity analyses were additionally carried out to assess the effect on the incremental cost-effectiveness ratio when selected variables are varied within a certain range, i.e., cost parameters were changed by ±50%, probabilities by ±20%, and utilities by ±20%.
Furthermore, the impact of alternative methods to extrapolate probabilities beyond the clinical trial period was evaluated. In one scenario no withdrawal after the 4th cycle (end of trial) was assumed, in another the discontinuation rate was estimated from the long-term, open-label trial of tapentadol and oxycodoneCitation42.
Results
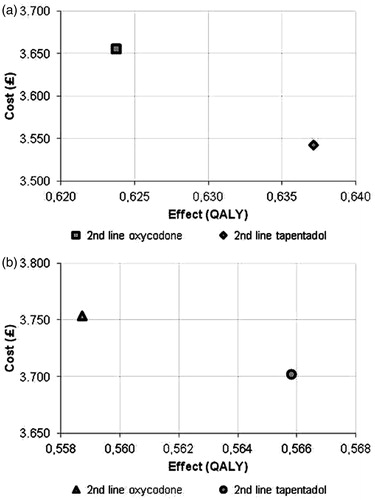
lists the outcomes for the overall population and the sub-group in terms of costs and QALYs. Modelling the 1-year cost consequences of severe chronic pain treatment with tapentadol in patients who do not tolerate morphine indicates the mean costs per patient for the total population were £3542.83 from the NHS perspective. Mean cost per patient with oxycodone amounted to £3656.23. Treatment with tapentadol, while being cheaper than oxycodone, was more effective (0.6371 QALYs vs 0.6237 QALYs for tapentadol and oxycodone, respectively), meaning that tapentadol dominated oxycodone.
Table 9. Outcomes (total costs and QALYs), total population, and sub-group.
For the sub-group, the ranking in terms of costs and QALYs remained unchanged. However, mean costs per patients increased whereas the amount of QALYs decreased for both treatment alternatives.
For the total population and sub-group costs were lower with tapentadol by £113 and £51, respectively. Incremental effects (tapentadol vs oxycodone) for the total population and sub-group were 0.0134 QALYs and 0.0072 QALYs, respectively. Cost-effectiveness planes for base-case analysis are shown in .
Figure 2. Cost-effectiveness planes for base-case analysis, total population (a), and sub-group (b). GBP, British pound sterling; QALY, quality adjusted life year.
Sensitivity analyses
One-way sensitivity analyses on costs of resource use (±50%), utilities (±20%), and probabilities of outcomes (±20%) showed that starting a 2nd line therapy with tapentadol remained a dominant strategy both for total population and sub-group, yielding more QALYs at lower total costs compared to oxycodone.
presents the three variables with the highest impact on the ICER and the resulting incremental costs and incremental effectiveness of 2nd line tapentadol vs 2nd line oxycodone.
Table 10. Impact on the incremental costs and effectiveness in one-way sensitivity analyses, three most influential variables (2nd line tapentadol vs 2nd line oxycodone).
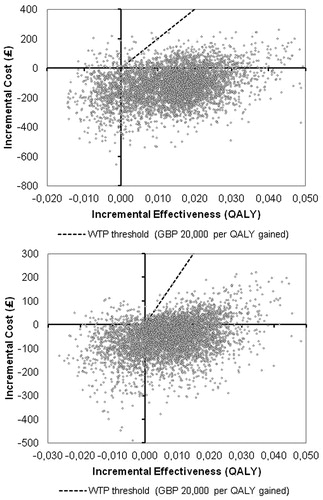
Incremental cost-effectiveness (ICE) scatterplots of tapentadol vs oxycodone as 2nd line therapy confirmed the robustness of the results: The ICE scatterplot of 5000 simulation runs for tapentadol vs oxycodone showed that 2nd line tapentadol is more effective and less costly in 85% and 77% of the simulations for the total population and sub-group, respectively, and hence dominates 2nd line treatment with oxycodone ().
Figure 3. ICE scatter plots of 2nd line tapentadol vs 2nd line oxycodone; total population (a) and sub-group (b); 5000 simulation runs. QALY, quality-adjusted life year; WTP, willingness to pay.
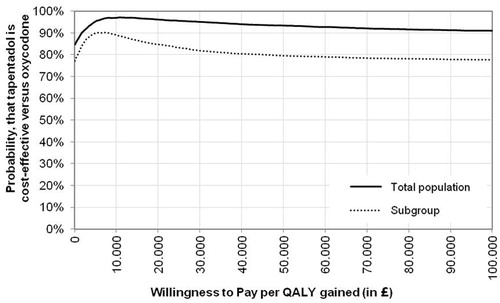
CEACs () visualized that the probability of 2nd line tapentadol being a cost-effective treatment strategy vs 2nd line oxycodone is >90% and >80% at a threshold value of £20,000 per QALY gained for the total population and sub-group, respectively.
Figure 4. CEACs for 2nd line tapentadol vs 2nd line oxycodone. QALY, quality-adjusted life year; WTP, willingness to pay.
Further scenario analyses were conducted to assess the impact of a change in selected input parameters on the model’s conclusions. The impact of alternative extrapolation methods for cycle-specific probabilities after trial end-point, one with no further discontinuation after 4th cycle and the other with discontinuation after the 4th cycle based on long-term data from Wild et al.Citation42, was tested. The alternative extrapolation methods had little impact on incremental costs and outcomes, tapentadol remained the dominant treatment strategy.
Discussion
This paper presents the first health economic analysis of tapentadol in the UK setting. Tapentadol was compared to oxycodone for the treatment of patients with severe chronic non-malignant pain in whom morphine was ineffective or not well tolerated. Two analyses were performed, one used results of the total population of patients included in the three phase III tapentadol trials, whereas the other applied the data for the sub-group of opioid experienced patients with severe pain at baseline.
An important clear observation was that, for tapentadol and oxycodone, major utility gains (around 0.25) were found for those patients who both tolerated the treatment and completed the trial. These utility gains are similar to benefits found with good pain relief in fibromyalgiaCitation11, and gains with joint replacement in arthritisCitation43.
In both analyses, tapentadol was a superior treatment compared to oxycodone. According to the model results, tapentadol generates more QALYs and is less costly. The differences stem from an improved tolerability profile of tapentadol, which leads to fewer treatment discontinuations and thus avoidance of their detrimental clinical and economic consequences. When applying sub-group clinical data, costs for both treatment strategies rise, whereas effects are lower. This is related to a poorer general constitution of the patients (lower utilities due to severe pain). Extensive sensitivity analyses were performed to test the robustness of results. Across all one-way sensitivity analyses, tapentadol remained the dominant strategy. A probabilistic sensitivity analysis showed a high probability of tapentadol being cost-effective across the wide range of threshold values.
The current analysis has several advantages. The model aims to represent a realistic patient pathway as it follows the patient from the initiation of a 2nd line therapy up to the 4th line therapy. Clinical data for tapentadol and oxycodone were directly extracted from head-to-head clinical trials and the reliability of the data was further backed by the large sample size of the underlying clinical trials with ∼1000 patients in tapentadol and oxycodone arms. EQ-5D values applied in the model were gathered along the clinical trials and have not been integrated from an external source, ensuring that the EQ-5D values represent the health state-specific utilities correctly and are not subject to a bias. Transition probabilities for the first four cycles, where most of the treatment switches occur, were directly derived from the clinical trials for tapentadol and oxycodone. This ensures that clinical data have been applied as precisely as possible.
Furthermore, data on resource use (costs of physician visits, co-medication, AE treatment) were obtained from a UK medical research database, providing a more accurate estimate of costs related to pain patients compared to using expert panel estimates. Although some assumptions had to be made due to the lack of detailed data (e.g., assuming the same costs due to treating AEs regardless of the severity and to be equal to costs due to insufficient pain relief), resource use was broadly varied in the sensitivity analysis.
In general, the results of cost-effectiveness studies rely on the quality of the included data and the underlying assumptions. In the present model, clinical data for tapentadol and oxycodone were taken from head-to-head randomized controlled trials (RCTs), whereas for TDF, TDB and oxycodone/naloxone combination input data were based on separate trials. This might have introduced potential bias due to, for example, different trial design or patient population, but in the absence of direct comparisons data from various sources have to be used. Because other opioids were not directly compared with tapentadol but were used as treatment options after failure of oxycodone or tapentadol, the impact of this potential bias is small, as demonstrated in the sensitivity analysis.
The model follows patients as they transit from 2nd to 4th line therapy. Clinical data that are available might not accurately reflect the population at each line. For the 2nd line, data from tapentadol trials were analysed post hoc to best represent this population (sub-group analysis). For the 3rd line, no data (for TDF, TDB, and oxycodone/naloxone combination) specific for this population were available. However, the impact of this potential bias is small, for the same reasons as stated above.
Additionally, due to the limited duration of the clinical trials on tapentadol and oxycodone (15 weeks), data on tolerability and efficacy needed to be extrapolated to 1 year. This implies the assumption of stable tolerability and efficacy over time. The impact of this assumption was tested in sensitivity analyses and was minor. As neuropathic and other non-malignant pain syndromes usually require long-term treatment, the model results, which are based on extrapolations, may therefore lack in generalizability.
Utility values were not available for each opioid and treatment line separately and hence were based on the average value reported for tapentadol and oxycodone for the respective health state. In reality, utilities of health states in the 3rd line could be lower than in the 2nd line because patients experience additional treatment failure. However, no adjustment on utilities in the 3rd line was made in order to keep the model simpler and conservative.
The analysis also did not model the potential dose adjustment due to analgesic tolerance, i.e., a diminishing analgesic effect of an opioid because of physiological adaptation to the opioid. A pre-clinical study indicates that time to onset of analgesic tolerance was observed to be half that with tapentadol compared to morphineCitation26, however the finding has not yet been validated in long-term use in humans. This potential additional benefit of tapentadol would lead to more favourable cost-effectiveness results.
The onset of action in the treatment of chronic pain has less relevance compared to the level and sustainability of pain relief as patients are treated on a long-term basis. Nevertheless, data in three phase III trials on change in pain intensity from baseline were collected on a weekly basis and are published in Lange et al.Citation33. Although a pre-planned statistical comparison addressed only comparison of tapentadol with placebo and oxycodone with placebo, no major difference in the onset of action was noticeable between tapentadol and oxycodone.
Compared to the population in clinical trials, patients in a real-life setting have in general more co-morbidities and have to take several medications concomitantly, especially older patients. Potential drug interactions may cause severe health problems and lead to replacement of some drugs. It was shown recently that the economic impact of drug–drug interactions in opioid therapy is not negligibleCitation44. According to clinical and pre-clinical data, differences between tapentadol and other opioids occur in this respect, with tapentadol having less potential for drug interactionsCitation26. The model did not consider differences in drug interactions and related clinical and economic consequences because no real-life data are available.
Last but not least, the analysis was performed from the NHS perspective and, therefore, no indirect costs were included. However, substantial indirect costs occur due to chronic pain. A large European survey found that the presence of severe daily pain is associated with a 20-point reduction in the probability of being employed full-timeCitation45. A pain drug with better tolerability profile prevents patients from discontinuing treatment and may lead to large savings due to higher labour force participation.
Conclusions
Based on the results of the cost-effectiveness study it can be considered that tapentadol is less costly and provides better quality-of-life compared to oxycodone in patients with severe non-malignant chronic pain.
Transparency
Declaration of funding
This study was funded by Grünenthal GmbH, Aachen, Germany.
Declaration of financial/other relationships
Nadine Hertel and Robert Ikenberg are employees of IMS Health which received funding from Grünenthal GmbH to conduct this research. Garth Baxter, Pete Conway, Marko Obradovic, and Hiltrud Liedgens are employees of Grünenthal GmbH. R. Andrew Moore is a member of the Grünenthal International Clinical Advisory Board and has not received any financial support regarding his contribution to the manuscript.
References
- Breivik H, Collett B, Ventafridda V, et al. Survey of chronic pain in Europe: prevalence, impact on daily life, and treatment. Eur J Pain 2006;10:287–333
- Smith BH, Elliott AM, Chambers WA, et al. The impact of chronic pain in the community. Fam Pract 2001;18:292-9
- Sprangers MA, de Regt EB, Andries F, et al. Which chronic conditions are associated with better or poorer quality of life? J Clin Epidemiol 2000;53:895-907
- Crichton B, Green M. GP and patient perspectives on treatment with non-steroidal anti-inflammatory drugs for the treatment of pain in osteoarthritis. Curr Med Res Opin 2002;18:92-6
- Doth AH, Hansson PT, Jensen MP, et al. The burden of neuropathic pain: a systematic review and meta-analysis of health utilities. Pain 2010;149:338-44
- Zelman DC, Dukes E, Brandenburg N, et al. Identification of cut-points for mild, moderate and severe pain due to diabetic peripheral neuropathy. Pain 2005;115:29-36
- Nuesch E, Dieppe P, Reichenbach S, et al. All cause and disease specific mortality in patients with knee or hip osteoarthritis: population based cohort study. BMJ 2011;342:d1165
- Torrance N, Elliott AM, Lee AJ, et al. Severe chronic pain is associated with increased 10 year mortality. A cohort record linkage study. Eur J Pain 2010;14:380-6
- Phillips C. Economic burden of chronic pain. Expert Rev Pharmacoecon Outcomes Res 2006;6:591-601
- Katz WA, Barkin RL. Dilemmas in chronic/persistent pain management. Am J Ther 2008;15:256-64
- Moore RA, Straube S, Paine J, et al. Fibromyalgia: moderate and substantial pain intensity reduction predicts improvement in other outcomes and substantial quality of life gain. Pain 2010;149:360-4
- Straube S, Moore RA, Paine J, et al. Interference with work in fibromyalgia - effect of treatment with pregabalin and relation to pain response. BMC Musculoskelet Disord 2011;12:125
- Kalso E, Edwards JE, Moore RA, et al. Opioids in chronic non-cancer pain: systematic review of efficacy and safety. Pain 2004;112:372-80
- Rowbotham MC, Lindsey CD. How effective is long-term opioid therapy for chronic noncancer pain? Clin J Pain 2007;23:300-2
- Trescot AM, Helm S, Hansen H, et al. Opioids in the management of chronic non-cancer pain: an update of American Society of the Interventional Pain Physicians' (ASIPP) Guidelines. Pain Physician 2008;11(2 Suppl):S5-S62
- Collet B-J. Chronic opioid therapy for non-cancer pain. Br J Anaesth 2001;87:133-43
- Snidvongs S, Mehta V. Recent advances in opioid prescription for chronic non-cancer pain. Postgrad Med J 2012;88:66-72
- Moore RA, Eccleston C, Derry S, et al. ACTINPAIN Writing Group of the IASP Special Interest Group on Systematic Reviews in Pain Relief; Cochrane pain, palliative and supportive care systematic review group editors. “Evidence” in chronic pain–establishing best practice in the reporting of systematic reviews. Pain 2010;150:386-9
- McDermott AM, Toelle TR, Rowbotham DJ, et al. The burden of neuropathic pain: results from a cross-sectional survey. Eur J Pain 2006;10:127-35
- Eriksen J, Sjogren P, Bruera E, et al. Critical issues on opioids in chronic non-cancer pain: an epidemiological study. Pain 2006;125:172-9
- OPEN Minds. The white paper on opioids and pain: a pan-European challenge. 2005. http://www.dgss.org/fileadmin/pdf/50616_White_Paper.pdf. Accessed December 21, 2011
- Nicholson B. Responsible prescribing of opioids for the management of chronic pain. Drugs 2003;63:17-32
- Nicholson B, Passik SD. Management of chronic non-cancer pain in the primary care setting. South Med J 2007;100:1028-36
- Moore RA, Straube S, Derry S, et al. Chronic low back pain analgesic studies -- a methodological minefield. Pain 2010;149:431-4
- Tzschentke TM, De Vry J, Terlinden R, et al. Tapentadol HCI. Drugs Future 2006;31:1053-61
- Tzschentke TM, Christoph T, Kogel B, et al. (−)-(1R,2R)-3-(3-dimethylamino-1-ethyl-2-methyl-propyl)-phenol hydrochloride (tapentadol HCl): a novel mu-opioid receptor agonist/norepinephrine reuptake inhibitor with broad-spectrum analgesic properties. J Pharmacol Exp Ther 2007;323:265-76
- Upmalis D, Okamoto A, Van Hove I, et al. Efficacy and tolerability data supporting the use of tapentadol immediate release for the relief of pain from end-stage joing disease [abstract]. Paris: 9th Annual European Congress of Rheumatology (EULAR 2008), 2008
- Oh C, Upmalis D, Okamoto A, et al. Flexible use of tapentadol immediate release for 90 days for the treatment of low back pain and osteoarthritis pain: a safety study [abstract]. Paris: 9th Annual European Congress of Rheumatology (EULAR 2008), 2008
- Hartrick C, Van Hove I, Stegmann JU, et al. Efficacy and tolerability of tapentadol immediate release and oxycodone HCl immediate release in patients awaiting primary joint replacement surgery for end-stage joint disease: a 10-day, phase III, randomized, double-blind, active- and placebo-controlled study. Clin Ther 2009;31:260-71
- Tzschentke TM, Jahnel U, Kogel B, et al. Tapentadol hydrochloride: a next-generation, centrally acting analgesic with two mechanisms of action in a single molecule. Drugs Today (Barc) 2009;45:483-96
- Afilalo M, Etropolski M, Kuperwasser B, et al. Efficacy and safety of tapentadol extended release compared with oxycodone controlled release for the management of moderate to severe chronic pain related to osteoarthritis of the knee: a randomized, double-blind, placebo- and active-controlled Phase III study. Clin Drug Investig 2010;30:489-505
- Buynak R, Shapiro DY, Okamoto A, et al. Efficacy and safety of tapentadol extended release for the management of chronic low back pain: results of a prospective, randomized, double-blind, placebo- and active-controlled Phase III study. Expert Opin Pharmacother 2010;11:1787-804
- Lange B, Kuperwasser B, Okamoto A, et al. Efficacy and safety of tapentadol prolonged release for chronic osteoarthritis pain and low back pain. Adv Ther 2010;27:381-99
- Obradovic M, Baxter G, Conway P, et al. Cost effectiveness of tapentadol PR compared with oxycodone CR for the treatment of severe chronic pain. Poster presented at the British Pain Society and Canadian Pain Society Joint Annual Scientific Meeting. 21–24th June 2011, Edinburgh, Scotland
- Vondrackova D, Leyendecker P, Meissner W, et al. Analgesic efficacy and safety of oxycodone in combination with naloxone as prolonged release tablets in patients with moderate to severe chronic pain. J Pain 2008;9:1144-54
- Milligan K, Lanteri-Minet M, Borchert K, et al. Evaluation of long-term efficacy and safety of transdermal fentanyl in the treatment of chronic noncancer pain. J Pain 2001;2:197-204
- Likar R, Kayser H, Sittl R. Long-term management of chronic pain with transdermal buprenorphine: a multicenter, open-label, follow-up study in patients from three short-term clinical trials. Clin Ther 2006;28:943-52
- Electronic Medicines Compendium (eMC). Summary of Product Characteristics of OxyContin tablets. 2011. http://www.emc.medicines.org.uk/medicine/2579/SPC/OxyContin%20tablets/#POSOLOGY. Accessed December 8, 2011
- Donner B, Zenz M, Tryba M, et al. Direct conversion from oral morphine to transdermal fentanyl: a multicenter study in patients with cancer pain. Pain 1996;64:527-34
- NHS England. Prescribing Support Unit. 2011, Health and Social Care Information Centre, prescription cost analysis England, 2010. http://www.ic.nhs.uk/webfiles/publications/007_Primary_Care/Prescribing/Prescription_Cost_Analysis_England_2010/Prescription_Cost_Analysis_2010.pdf. Accessed December 21, 2011
- Gross Domestic Product (GDP) deflators. HM Treasury. http://www.hm-treasury.gov.uk/data_gdp_index.htm. Accessed March 1, 2011
- Wild JE, Grond S, Kuperwasser B, et al. Long-term safety and tolerability of tapentadol extended release for the management of chronic low back pain or osteoarthritis pain. Pain Pract 2010;10:416-27
- Bachmeier CJ, March LM, Cross MJ, et al. Arthritis Cost and Outcome Project Group. A comparison of outcomes in osteoarthritis patients undergoing total hip and knee replacement surgery. Osteoarthritis Cartilage 2001;9:137-46
- Summers KH, Amy Puenpatom R, Rajan N, et al. Economic impact of potential drug-drug interactions in opioid analgesics. J Med Econ 2011;14:390-6.
- Langley P, Müller-Schwefe G, Nicolaou A, et al. The impact of pain on labor force participation, absenteeism and presenteeism in the European Union. J Med Econ 2010;13:662-72