Abstract
Objective:
To evaluate the cost-effectiveness of biphasic insulin lispro mix 75/25 (LM75/25) and mix 50/50 (LM50/50) compared with a long-acting analog insulin (LAAI) regimen from the perspective of a US healthcare payer.
Methods:
A published computer simulation model of diabetes was used to evaluate the cost-effectiveness of LM75/25 and LM50/50 vs a LAAI (insulin glargine) from the perspective of a US healthcare payer. Treatment effects in terms of HbA1c benefits were taken from a recent meta-analysis. Direct medical costs including pharmacy, complication, and patient management costs were obtained from published sources. All costs were expressed in 2010 US dollars and future costs and clinical benefits were discounted at 3% per annum. Sensitivity analyses were performed.
Results:
LM75/25 and LM50/50 were associated with improvements in life expectancy of 0.08 and 0.09 years, improvements in quality-adjusted life expectancy of 0.07 quality-adjusted life years (QALYs) and 0.08 QALYs and increases in cost of US$ 1724 and US$ 1720, respectively, when compared with LAAI.
Limitations:
The base case analysis did not capture mild or serious hypoglycemia on the grounds that the hypoglycemia rate odds ratios failed to reach statistical significance in the meta-analysis. In addition, the baseline cohort characteristics were based on an insulin-naïve population, as opposed to the cohorts in the meta-analysis, which were heterogeneous with regard to insulin treatment history.
Conclusions:
Based on a recently published meta-analysis, biphasic analog insulins are likely to improve clinical outcomes and reduce costs vs LAAIs in the long-term treatment of type 2 diabetes patients in the US.
Introduction
The chronic and progressive nature of type 2 diabetes, the increasing incidence and prevalence of the condition, and the numerous comorbidities associated with the disease have resulted in a significant clinical and economic burden worldwide. A recent study by Zhang et al.Citation1 estimated the total global economic burden of diabetes to be US$ 376 billion in 2010 (expressed in 2005 US$), representing ∼12% of global healthcare expenditure. The study predicted that diabetes expenditure in the US alone would constitute 52.7% of the global healthcare spend on diabetes, with the US incurring the highest expenditure in both absolute and per capita terms (US$ 198 billion total and US$ 7383 per diabetes patient, respectively). Accounting for differences in the respective costing methodologies, these US figures are in line with 2007 estimates from the American Diabetes Association (ADA), which placed total US expenditure on diabetes at US$ 174 billionCitation2. The ADA study also reported that diabetes complications are the largest single driver of costs in patients with type 2 diabetes, incurring an estimated US$ 58 billion in 2007, exactly one-third of the total estimated US expenditure on diabetes. In comparison, ∼12% of expenditure was attributable to diabetes medications.
The progressive nature of diabetes means that, whilst patients can often be initially managed with diet and exercise alone, there is generally a need to add glucose-lowering medications over timeCitation3. In the majority of cases, patients will ultimately initiate insulin therapy having failed to achieve or sustain glycemic targets with lifestyle modifications and one or more oral anti-diabetic agents (OADs). Insulin and insulin analogs therefore remain as a cornerstone of diabetes treatment.
Although US data suggest that the proportion of diabetes patients receiving insulin therapy decreased between 1997–2007 (a phenomenon that is likely attributable to the increasing incidence of the condition, which inflates the number of patients in the early stages of diabetes therapy), a high proportion of insulin-using patients in the US are using analog insulin as opposed to human insulinCitation4. A recent study by Bonafede et al.Citation5 reported that 88.1% of patients initiating a basal insulin regimen in the US started therapy using analog insulin. Whilst the proportion of patients initiating a biphasic regimen with analog insulin was lower, the costs associated with prescription of the insulin analogs are significant. Given the substantial expenditure on basal and biphasic insulins and the ongoing demand for analog insulins, we sought to compare the cost-effectiveness of two commonly-used analog insulin regimens in the US. Numerous health economic analyses have been published comparing different basal analog insulin regimens and their human insulin counterpartsCitation6–10. In the present analysis, we therefore sought to focus on an area where there is currently a paucity of health economic data, namely the comparison of long-acting analog insulin (LAAI) with biphasic analog insulin. Specifically, the analysis is focused on the comparison of Humalog® Mix75/25™ (biphasic insulin lispro mix 75/25; Eli Lilly and Company, Indianapolis, IN) and Humalog® Mix 50/50™ (biphasic insulin lispro mix 50/50; Eli Lilly and Company) with a LAAI regimen (insulin glargine; Lantus®; Sanofi-Aventis, Paris, France). Biphasic insulin lispro mix 75/25 (LM75/25) is comprised of a 75/25 mix of insulin lispro protamine suspension and insulin lispro mix injection, whereas biphasic insulin lispro mix 50/50 (LM50/50) is comprised of the same basal and prandial insulin components, but in a 50/50 mix.
Cohort and methods
Model
The analysis was performed using the CORE Diabetes Model (CDM; IMS Health, Basel, Switzerland), a published and validated model of type 1 and 2 diabetes. A detailed overview of the model is provided by Palmer et al.Citation11,Citation12 In summary, the CDM is a web-based, product-agnostic diabetes policy analysis tool which simulates the progression of diabetes, taking into account intensive or conventional insulin therapy, screening and treatment strategies for microvascular complications, end-stage complications, and multifactorial interventions. The model comprises a series of inter-dependent semi-Markov sub-models that simulate mortality and diabetes-related complications (including angina, myocardial infarction, congestive heart failure, stroke, peripheral vascular disease, diabetic retinopathy, macula edema, cataract, hypoglycemia, ketoacidosis, lactic acidosis, nephropathy and end-stage renal disease, neuropathy, foot ulcer, and amputation). Each sub-model uses time, state, time-in-state, and diabetes type-dependent probabilities derived from published sources. The memory-less properties of standard Markov models are overcome using Monte Carlo simulation with tracker variables, which also allows inter-connectivity and interaction between the individual complication sub-models.
Simulation cohort and treatment effects
For the base case analysis, baseline cohort characteristics were derived from published sources to represent a typical US diabetes cohort taking OADs, but ready to initiate insulin as per ADA/European Association for the Study of Diabetes (EASD) consensus guidelines ()Citation13. Data were sourced primarily from a 2008 study by Tunis and MinshallCitation14, which investigated the cost-effectiveness of self-monitoring of blood glucose (SMBG) in the USCitation14–23. In cases where no US-specific data were available (systolic blood pressure and proportion of patients with neuropathy at baseline), UK-centric or global data were used as a surrogate.
Table 1. Baseline cohort demographics and characteristics.
Treatment effects in the base case were taken from a systematic review and meta-analysis published by Qayyum et al.Citation24 in 2008 (). The meta-analysis reported weighted mean differences in changes in post-prandial glucose (PPG), fasting-plasma glucose (FPG), and HbA1c for LAAI and premixed human insulin in comparison with three premixed analog insulins (LM75/25, LM50/50, and biphasic insulin aspart 70/30). The present analysis focused on the comparison of LM75/25 and LM50/50 with LAAI.
Table 2. Treatment effects used in the base case analysis (Qayyum et al.Citation24)Citation19.
The Qayyum et al.Citation24 meta-analysis also reported odds ratios for the incidence of hypoglycemia (classified as serious, mild, symptom-only, and unclassified). However, owing to the nature of hypoglycemia reporting in the studies included in the meta-analysis (and the lack of statistical significance in the odds ratios for severe hypoglycemia), only changes in HbA1c were factored into the base-case analysis (the CDM does not have the ability to model long-term risk based on PPG or FPG). A series of sensitivity analyses were performed to establish the impact of minor/mild hypoglycemia on cost-effectiveness outcomes.
Costs, discounting, and time horizon
The analysis was performed from the perspective of a US healthcare payer (e.g. a managed care organization). Direct medical costs including pharmacy costs, costs associated with diabetes-related complications, and concomitant patient management costs (e.g. aspirin, statins, and angiotensin-converting enzyme inhibitors) were obtained from published sources or, in the case of insulin costs, provided by the study sponsor ()Citation25,Citation26. Where necessary, costs were inflated to 2010 US dollar (USD) values using the medical component of the consumer price index for all urban consumers, as published by the US Bureau of Labor Statistics (). In the base case analysis it was assumed that the cost of insulin glargine was representative of the cost of a LAAI. It was also assumed that patients took an average of 40 IU per day, regardless of insulin regimen, in line with the defined daily dose published by the World Health Organization (WHO)Citation27 for long-acting insulins and analogs. The base case analysis omitted costs of OADs, as their inclusion would have no effect on incremental outcomes.
Table 3. Direct medical costs associated with complications, treatment, and patient management.
The base case analysis was run over a time horizon of 35 years to capture all relevant long-term complications and associated costs and to assess their impact on life expectancy and quality-adjusted life expectancy. All future costs and clinical outcomes were discounted at a rate of 3% per annum in line with published guidance in the US settingCitation28.
Sensitivity analyses
A series of univariate sensitivity analyses were performed to assess the robustness of the base case findings. The influence of time horizon on the outcomes projected by the model was investigating by running analyses over 5, 10, 20, and 30 years (from the 35-year base case analysis). Similarly, the effect of discount rates on future costs and clinical outcomes were investigated through analyses in which they were set (symmetrically) to 0 and 6% per annum. As hypoglycemia was not included in the base case analyses, sensitivity analyses were performed in which minor hypoglycemia rates in the long-acting basal analog arm were set to representative values from the Qayyum et al.Citation24 meta-analysis. Rates in the LM75/25 and LM50/50 arm were then set to a value derived from these using the odds ratios presented in the Qayyum et al.Citation24 meta-analysis (1.83 [95% confidence interval 0.92–3.67] for LAAI compared with premixed analog insulin). While minor hypoglycemic events were not assumed to incur any cost from the healthcare payer perspective, a disutility of −0.0033 was applied for each eventCitation29. In terms of clinical effectiveness, another two sensitivity analyses were performed in which the HbA1c change was set to either end of the 95% confidence intervals from the meta-analysis (from the mean HbA1c change used in the base case).
Two sensitivity analyses were performed to evaluate the effect of over- or under-estimating the unit costs of diabetes complications used in the analysis, which increased and decreased the values used by 10% from the base case costs. Pharmacy costs were not altered in these sensitivity analyses. However, two separate analyses were performed in which the pharmacy costs (excluding patient management such as aspirin and statins) in both arms were increased and decreased by 10%. This was to establish the magnitude of the effect of variations in insulin pricing on model outcomes. All other costs remained the same as in the base case.
Finally, the base case analysis used the default method of quality-adjusted life expectancy estimationCitation6. Two sensitivity analyses were performed in which the estimation method was switched to use the tariff-based UKPDS tobit model estimation formula or a multiple regression formula from the University of Michigan (based on the self-administered quality of well-being (QWB-SA) instrument)Citation30,Citation31.
Results
Long-term clinical outcomes
Using effectiveness data from the Qayyum et al.Citation24 meta-analysis, the base case analysis found both LM75/25 and LM50/50 to be associated with improvements in life expectancy and quality-adjusted life expectancy when compared with LAAI (). Specifically, Mix25 and Mix50 were found to increase life expectancy by 0.08 years and 0.09 years relative to LAAI over a 35-year time horizon, respectively. In terms of quality-adjusted life expectancy, Mix25 and Mix50 resulted in increases of 0.07 quality-adjusted life years (QALYs) and 0.08 QALYs relative to LAAI, respectively. The mean time until onset of all modeled diabetes complications was higher with Mix25 and Mix50 than with LAAI. Consequently, the mean time alive and free of complications increased to 0.39 years with Mix25 and Mix50, from 0.37 years with LAAI.
Table 4. Long-term economic and clinical outcomes associated with the use of LM75/25 and LM50/50 vs long-acting analog insulin.
Costs and cost-effectiveness
Direct medical costs were higher in the LM75/25 and LM50/50 arms in comparison with the LAAI arm over the 35-year time horizon (). Overall costs were US$ 1724 higher with LM75/25 than with LAAI and US$ 1720 higher with LM50/50 than with LAAI. The higher costs were driven by increased costs of insulin treatment and patient management in the LM75/25 and LM50/50 arms relative to LAAI. However, these increased costs were partially offset by reductions in costs associated with cardiovascular, renal, and ocular complications and costs of treating ulcer and neuropathy.
Table 5. Direct medical costs associated with LM75/25 and LM50/50 vs long-acting analog insulin over patient lifetimes.
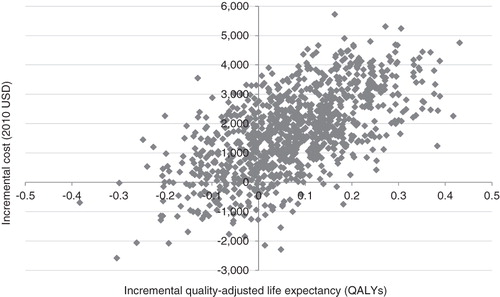
Evaluation of cost-effectiveness showed that LM75/25 and LM50/50 would yield incremental cost-effectiveness ratios of US$ 28,580 and 23,150 per QALY gained relative to LAAI, respectively. Incremental cost-effectiveness scatter plots for the LM75/25 and LM50/50 comparisons are shown in and , respectively. The scatterplots present the incremental costs vs incremental effectiveness (QALYs gained) for LM75/25 and LM50/50 vs LAAI and show 1000 mean values, each representing a cohort of 1000 patients run through the model. Data from the scatter plots were used to generate acceptability curves, which showed that, at a willingness to pay threshold of US$ 50,000 per QALY gained, there was an 84% probability that both LM75/25 and LM50/50 would be considered cost-effective in comparison with LAAIs.
Figure 1. Scatter plot of incremental costs vs incremental effectiveness of LM75/25 vs long-acting analog insulin.
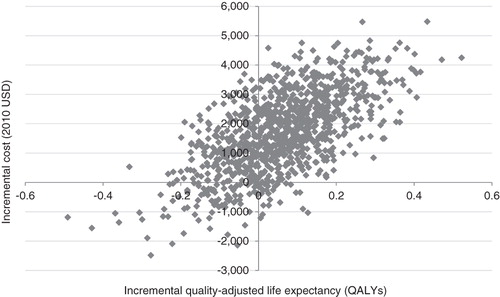
Figure 2. Scatter plot of incremental costs vs incremental effectiveness of LM50/50 vs long-acting analog insulin.
Sensitivity analyses
A series of sensitivity analyses were performed to assess the robustness of the base case findings and determine the key drivers of the results. For both LM75/25 and LM50/50, the only scenarios in which the mean LM75/25 and LM50/50 cost-effectiveness outcome (relative to LAAI) did not fall in the upper right of the cost-effectiveness plane were the scenarios in which the incidence of mild hypoglycemia was altered ( and ). Using the mean and upper limit of the 95% confidence intervals for the odds ratio of mild hypoglycemic events for LM75/25 and LM50/50 treatment arms vs LAAI (1.83 and 3.67, respectively) negated the incremental benefit in quality-adjusted life expectancy observed in the base case analysis. However, using the lower bound of the 95% confidence interval (0.92) led to an increased incremental effectiveness in comparison with the base case (0.08 QALYs compared with 0.07 QALYs in the base case) in the LM75/25 vs LAAI comparison. Similarly, in the LM50/50 vs LAAI comparison the corresponding improvement was 0.09 QALYs, vs 0.07 QALYs in the base case.
Table 6. Results of sensitivity analyses comparing LM75/25 with long-acting analog insulin.
Table 7. Results of sensitivity analyses comparing LM50/50 with long-acting analog insulin.
Sensitivity analyses were also performed around the HbA1c benefit associated with LM75/25 and LM50/50. Specifically, the HbA1c change was varied between the upper and lower bounds of the 95% confidence intervals reported by Qayyum et al.Citation24 With LM75/25, the lower bound of the 95% confidence interval (i.e., the ‘worst case’ scenario) yielded an improvement in quality-adjusted life expectancy of 0.04 QALYs relative to LAAI, accompanied by an increase in lifetime direct medical costs of US$ 1820, giving an ICER of US$ 54,164 per QALY gained. The upper bound of the 95% confidence interval resulted in an improvement in quality-adjusted life expectancy of 0.09 QALYs with LM75/25 on increased costs of US$ 1610, giving an ICER of US$ 18,623 per QALY gained when compared with LAAI. With LM50/50, the lower bound yielded an ICER of US$ 48,769 per QALY gained, whilst the upper bound resulted in an ICER of US$ 12,533 per QALY gained.
A number of sensitivity analyses were run in which the time horizon was shortened relative to the base case analysis. Performing the analyses over shorter time horizons reduced the cost-savings and effectiveness benefits observed with both LM75/25 and LM50/50 vs LAAI, but only the 5-year analysis with LM75/25 vs LAAI resulted in an ICER higher than US$ 50,000. Increasing the time horizon of the simulations led to greater cost savings in the LM75/25 and LM50/50 treatment arms, primarily due to a reduction in the number of end-stage complications with LM75/25 and LM50/50 vs LAAI.
The impact of using different methods of quality-adjusted life expectancy estimation was also investigated in sensitivity analyses. Using the University of Michigan QWB-SA-based method resulted in higher ICERs than the base case analyses in the case of LM75/25 (US$ 32,042 per QALY gained) and LM50/50 (US$ 25,432 per QALY gained). Conversely, switching to the UKPDS tariff-based tobit model resulted in ICERs lower than the base case analyses of LM75/25 (US$ 27,182 per QALY gained) and LM50/50 (US$ 21,592 per QALY gained). Analyses around the annual cost and clinical discount rates showed that increasing the discount rate to 6% was less favorable to LM75/25 and LM50/50, increasing the ICER by US$ 2910 per QALY gained in the case of LM75/25 and US$ 1923 per QALY gained in the case of LM50/50. Conversely, setting the discount rate to 0% lowered the ICERs to US$ 26,033 per QALY gained for LM75/25 vs LAAI and to US$ 21,496 per QALY gained for LM50/50 vs LAAI. Finally, increasing and decreasing the cost of diabetes complications by 10% had a minimal effect on the ICER
Discussion
Based on effectiveness data from the Qayyum et al.Citation24 study, the present analysis indicated that, in the US setting, LM75/25 and LM50/50 would be associated with improved clinical outcomes in comparison with the basal-only LAAI regimen. A series of one-way sensitivity analyses showed that the base case results were largely insensitive to changes in a number of the key modeling assumptions. However, changes in assumptions regarding the incidence of minor hypoglycemic events had a considerable impact on patients’ quality-of-life (and ergo quality-adjusted life expectancy) in the analysis. Notably, in scenarios that used the mean and upper limits of the odds ratios for mild hypoglycemic event rates for LM75/25 and LM50/50 vs LAAI, the quality-of-life benefits observed in the base case analyses were negated and the biphasic mixes were dominated by LAAI. As has been noted in previous studies, any increase in the incidence of mild hypoglycemia associated with the biphasic mixes is likely driven by the rapid-acting component, which is responsible for the significantly improved postprandial glucose control observed with premixed insulin relative to LAAIsCitation24.
The current study has a number of limitations that should be acknowledged. Firstly, incidence of hypoglycemia was excluded from the base case analysis. The rationale for this omission was 3-fold. Firstly, the odds ratios for mild and serious hypoglycemia rates in LAAIs vs biphasic mixes, as reported in the Qayyum et al.Citation24 meta-analysis, failed to reach statistical significance. This finding is in line with a previous systematic literature review of LAAIs vs pre-mixed analog insulins, which reported similar severe and nocturnal hypoglycemia rates in the two regimensCitation32. Secondly, the meta-analysis only presented aggregate data for all pre-mixed analog insulins including, for example, biphasic insulin aspart as well as LM75/25 and LM50/50. Finally, the meta-analysis only examined the incidence of hypoglycemia in a small number of studies, which (as Qayyum et al.Citation24 noted) exhibited considerable heterogeneity in terms of their definitions and reporting of hypoglycemia. Indeed, a number of the studies were not statistically powered to detect differences in hypoglycemic event rates. This high prevalence of heterogeneity in hypoglycemia reporting has also been acknowledged by other study authors. For example, in a recent meta-analysis designed to identify optimal insulin regimens, Lasserson et al.Citation33 noted that it was not possible to perform a pooled analysis of hypoglycemia rates owing to variations in definitions and under-reporting of measures of dispersion.
A second limitation that should be noted is the use of data from a meta-analysis of short-term clinical data to make long-term projections. The aim of the present study was to generate a realistic estimate of the long-term value of patients taking LM75/25 or LM50/50 vs LAAI. To this end, we believe the Qayyum et al.Citation24 meta-analysis represents the most comprehensive review of the relative effectiveness of these modern analog insulins. In terms of the uncertainty around making long-term projections from short-term data, this remains an essential part of much health economic modeling and, in the absence of long-term clinical trial data, represents the best available option in the health economist’s arsenal. Whilst there may still be doubt around the accuracy of the clinical predictions, the use of an extensively published and validated model of type 2 diabetes goes some way to mitigating these concerns.
One final potential criticism of the present study lies in the simulation cohort, which was based primarily on a US cohort used in a recent cost-effectiveness analysis of SMBG by Tunis and MinshallCitation14. The mean baseline HbA1c, age, gender breakdown, and ethnicity distribution of the cohort used in the Tunis and MinshallCitation14 study were taken from an insulin-naïve cohort 2006 study into SMBG by Karter et al.Citation34 (other parameters came from US-specific sources such as the National Health and Nutrition Examination Survey). Of the 45 studies included in the Qayyum et al.Citation24 meta-analysis, only 10 trials were conducted exclusively in insulin-naïve patients (compared with 25 studies exclusively in insulin-treated patients, one study which enrolled a mix and nine in which the history of insulin treatment was not specified). However, the sensitivity analyses in which the modeled HbA1c benefit was set to either boundary of the 95% confidence intervals showed that LM75/25 and LM50/50 retained their cost-effective status relative to LAAI, suggesting that the fundamental findings of the present study would likely remain unchanged in cohorts with differing histories of diabetes medication use.
Conclusions
Based on the findings of a recent meta-analysis into the effectiveness of pre-mixed insulin analogs in type 2 diabetes, LM75/25 and LM50/50 were projected to increase life expectancy and quality-adjusted life expectancy relative to LAAI in the US. Whilst lifetime direct medical costs would also increase with LM75/25 and LM50/50, the increase in quality-adjusted life expectancy yielded ICERs of US$ 28,580 and US$ 23,150 per QALY gained, respectively. Based on commonly quoted willingness-to-pay thresholds, this would represent good value for money in the US setting and the increased costs associated with LM75/25 and LM50/50 should not represent a barrier to reimbursement.
Transparency
Declaration of funding
This study was supported by a grant from Eli Lilly and Company.
Declaration of financial/other relationships
BC is an employee of Eli Lilly and Company. RP and WV are employees of Ossian Health Economics and Communications GmbH, which has received consulting fees from Eli Lilly and Company.
The peer reviewers on this manuscript have disclosed that they have no relevant financial relationships.
Acknowledgments
The authors would like to thank Kristina Secnik-Boye for her thorough review of the manuscript.
References
- Zhang P, Zhang X, Brown J, et al. Global healthcare expenditure on diabetes for 2010 and 2030. Diabetes Res Clin Pract 2010;87:293-301
- American Diabetes Association. Economic costs of diabetes in the U.S. In 2007. Diabetes Care 2008;31:596-615
- U.K. Prospective Diabetes Study Group. U.K. Prospective Diabetes Study 16: overview of 6 years’ therapy of type II diabetes: a progressive disease. Diabetes 1995;44:1249-58
- Sarpong E, Miller E. Agency for Healthcare Research and Quality Statistical Brief #293: trends in the pharmaceutical treatment of diabetes: a comparison of utilization and expenditures, 1997 to 2007. 2010. http://www.meps.ahrq.gov/mepsweb/data_files/publications/st293/stat293.shtml. Accessed March 9, 2012
- Bonafede MM, Kalsekar A, Pawaskar M, et al. A retrospective database analysis of insulin use patterns in insulin-naïve patients with type 2 diabetes initiating basal insulin or mixtures. Patient Prefer Adherence 2010;4:147-56
- Valentine WJ, Palmer AJ, Erny-Albrecht KM, et al. Cost-effectiveness of basal insulin from a US health system perspective: comparative analyses of detemir, glargine, and NPH. Adv Ther 2006;23:191-207
- Pscherer S, Dietrich ES, Dippel FW, et al. Comparison of one-year costs of type 2 diabetes treatment with insulin glargine or insulin detemir in a basal supported oral therapy (BOT) in Germany. Int J Clin Pharmacol Ther 2010;48:129-37
- Guillermin AL, Samyshkin Y, Wright D, et al. Modeling the lifetime costs of insulin glargine and insulin detemir in type 1 and type 2 diabetes patients in Canada: a meta-analysis and a cost-minimization analysis. J Med Econ 2011;14:207-16
- Tunis SL, Minshall ME, Conner C, et al. Cost-effectiveness of insulin detemir compared to NPH insulin for type 1 and type 2 diabetes mellitus in the Canadian payer setting: modeling analysis. Curr Med Res Opin 2009;25:1273-84
- Brändle M, Azoulay M, Greiner RA. Cost-effectiveness and cost-utility of insulin glargine compared with NPH insulin based on a 10-year simulation of long-term complications with the Diabetes Mellitus Model in patients with type 2 diabetes in Switzerland. Int J Clin Pharmacol Ther 2007;45:203-20
- Palmer AJ, Roze S, Valentine WJ, et al. The CORE Diabetes Model: projecting long-term clinical outcomes, costs and cost-effectiveness of interventions in diabetes mellitus (types 1 and 2) to support clinical and reimbursement decision-making. Curr Med Res Opin 2004;20(1 Suppl):S5-26
- Palmer AJ, Roze S, Valentine WJ, et al. Validation of the CORE Diabetes Model against epidemiological and clinical studies. Curr Med Res Opin 2004;20(1 Suppl):S27-40
- Nathan DM, Buse JB, Davidson MB, et al; American Diabetes Association; European Association for Study of Diabetes. Medical management of hyperglycemia in type 2 diabetes: a consensus algorithm for the initiation and adjustment of therapy: a consensus statement of the American Diabetes Association and the European Association for the Study of Diabetes. Diabetes Care 2009;32:193-203
- Tunis SL, Minshall ME. Self-monitoring of blood glucose in type 2 diabetes: cost-effectiveness in the United States. Am J Manag Care 2008;14:131-40
- Jones S, Benroubi M, Castell C, et al. Characteristics of patients with type 2 diabetes mellitus initiating insulin therapy: baseline data from the INSTIGATE study. Curr Med Res Opin 2009;25:691-700
- Centers for Disease Control and Prevention. Cigarette smoking among adults—United States, 2004. JAMA 2006;295:749-51
- National Institute on Alcohol Abuse and Alcoholism (NIAAA). NIAAA 2006 http://www.niaaa.nih.gov/Resources/GraphicsGallery/consfigs4text.htm. Accessed March 9, 2012
- National Diabetes Data Group; National Institutes of Health; National Institute of Diabetes and Digestive and Kidney Diseases. Diabetes in America. 2nd ed. NIH Publication No. 95–1468, 1995
- Kannel WB, Wolf PA, Benjamin EJ, et al. Prevalence, incidence, prognosis, and predisposing conditions for atrial fibrillation: population-based estimates. Am J Cardiol 1998;82:2N-9N
- Phillips SJ, Whisnant JP, O’Fallon WM, et al. Prevalence of cardiovascular disease and diabetes mellitus in residents of Rochester, Minnesota. Mayo Clin Proc 1990;65:344-59
- Harris MI. Health care and health status and outcomes for patients with type 2 diabetes. Diabetes Care 2000;23:754-8
- Brandle M, Zhou H, Smith BR, et al. The direct medical cost of type 2 diabetes. Diabetes Care 2003;26:2300-4
- Moss SE, Klein R, Klein BE. The prevalence and incidence of lower extremity amputation in a diabetic population. Arch Intern Med 1992;152:610-6
- Qayyum R, Bolen S, Maruthur N, et al. Systematic review: comparative effectiveness and safety of premixed insulin analogues in type 2 diabetes. Ann Intern Med 2008;149:549-59
- O'Brien JA, Patrick AR, Caro J. Estimates of direct medical costs for microvascular and macrovascular complications resulting from type 2 diabetes mellitus in the United States in 2000. Clin Ther 2003;25:1017-38
- Pelletier EM, Smith PJ, Boye KS, et al. Direct medical costs for type 2 diabetes mellitus complications in the US commercial payer setting: a resource for economic research. Appl Health Econ Health Policy 2008;6:103-12
- World Health Organization Collaborating Centre for Drug Statistics Methodology. Anatomical Therapeutic Chemical/Defined Daily Dose Index 2010. http://www.whocc.no/atc_ddd_index/?code=A10AE. Accessed May 11, 2010
- Gold MR, Siegel JE, Russell LB, et al., eds. Cost-effectiveness in health and medicine. New York, NY: Oxford University Press, 1996
- Levy AR, Christensen TL, Johnson JA. Utility values for symptomatic non-severe hypoglycaemia elicited from persons with and without diabetes in Canada and the United Kingdom. Health Qual Life Outcomes 2008;29:73
- Clarke P, Gray A, Holman R. Estimating utility values for health states of type 2 diabetic patients using the EQ-5D (UKPDS 62). Med Decis Making 2002;22:340-9
- Coffey JT, Brandle M, Zhou H, et al. Valuing health-related quality of life in diabetes. Diabetes Care 2002;25:2238-43
- Ilag LL, Kerr L, Malone JK, et al. Prandial premixed insulin analogue regimens versus basal insulin analogue regimens in the management of type 2 diabetes: an evidence-based comparison. Clin Ther 2007;29:1254-70
- Lasserson DS, Glasziou P, Perera R, et al. Optimal insulin regimens in type 2 diabetes mellitus: systematic review and meta-analyses. Diabetologia 2009;52:1990-2000
- Karter AJ, Parker MM, Moffet HH, et al. Longitudinal study of new and prevalent use of self-monitoring of blood glucose. Diabetes Care 2006;29(8):1757-63