Abstract
Objectives:
To develop a claims-based severity index for rheumatoid arthritis (RA) using the Veterans Health Administration (VHA) database.
Methods:
Adult patients with at least two RA diagnoses 2 months apart were identified between 10/1/2008–09/30/2009. Patients were required to have at least 12 months continuous health plan enrollment before and after the index date (first RA diagnosis date) for an overall study period of 10/1/2007–09/30/2010. A severity index for rheumatoid arthritis (SIFRA, a proprietary algorithm of SIMR, Inc. [STATinMED Research]) was developed by calculating a weighted sum of 34 RA-related indicators assessed by an expert Delphi panel of six rheumatologists, including laboratory, clinical, and functional status, extra-articular manifestations, surgical history, and medications, during a 1-year pre-index period. Separate SIFRA versions were derived for patients with and without laboratory information. Correlations between SIFRA and previously validated claims-based indexes for RA severity (CIRAS), and other traditional comorbidity indexes were calculated during the pre-index period. The relationship between SIFRA and follow-up healthcare outcomes was also examined using histograms.
Results:
The Spearman’s rank correlations between SIFRA and CIRAS were 0.525 for SIFRA without and 0.539 with laboratory data. The correlations between SIFRA and the Charlson Comorbidity Index (CCI) (0.1503 without, 0.1135 with laboratory data), Elixhauser Index (ELIX) (0.105 without, 0.079 with laboratory data), and Chronic Disease Score (CDS) (0.255 without, 0.239 with laboratory data) were low. Histograms showed that patients in the upper tercile of SIFRA incurred $9123 more all-cause and $1326 more RA-related healthcare costs during the 1-year post-index period than patients in the lower tercile. Using SIFRA in combination with CCI, CDS, or ELIX significantly increased the percentage of variation explained in outcomes measures.
Limitations:
Patients in the VHA database may not represent typical RA patients since the database generally contains older, economically disadvantaged men with a high disease burden. Validity of the score is indirectly based on disease activity score 28 (DAS28), which measures disease activity rather than severity.
Conclusions:
SIFRA was found to have moderate correlations with the previously validated CIRAS score, and demonstrated evidence of being a significant determinant of total and RA-related healthcare costs for RA patients. This study suggests that SIFRA could be an important methodological tool to control for severity in RA-related outcomes research. The algorithm can be applied to any claims dataset.
Introduction
Rheumatoid arthritis (RA) affects more than one million people in the USCitation1 and has significant economic implications for individual patients as well as society as a whole. Prevalence is the highest in the elderly population, afflicting 2% of the population over age 60Citation1,Citation2. With US Census data showing a general aging of the US population, a growing part of the population is increasingly shouldering the majority of the burden of RACitation3,Citation4. RA is responsible for more than 250,000 hospitalizations and over 9 million physician visits each yearCitation1. Patients may endure loss of wages during productive years, high medical costs and reduction in quality-of-lifeCitation3. The costs associated with RA have been estimated at $8.7 billion annuallyCitation5. Therefore, the need for disease-specific techniques to estimate treatment effects and costs becomes inevitable.
Treatment for RA varies widely. Current management techniques range from physical therapy to medication to surgical intervention. Numerous randomized clinical trials (RCTs) have demonstrated the effectiveness of these treatments. RCTs are typically viewed as the ideal evaluation technique to estimate treatment effects because, when randomization works, both measurable and immeasurable differences between treatment and control groups are minimized. Often, however, randomization is not feasible. Rossi et al.Citation6 outline the difficulty of randomization under the titles of small sample size, generalizability, limited time, and money.
Small sample sizes prevent researchers from finding statistically meaningful differences between treatment and control groups. For example, although rare, RA patients are at an increased risk of mortality and severe adverse outcomes, such as infection and cancerCitation7,Citation8. Finding meaningful differences among these rare events requires high enrollment volume, which may not be feasible with limited budgets.
Real-world practice patterns vary widely, making generalization an especially important limitation. Treatment choices can be influenced by non-clinical factors, such as physician practice patterns. Practice patterns can be based on physicians’ rules of thumb, and experience and interactions with patients and colleagues, and thus not only comprehensive evidence from RCTs. Health plans also provide financial and non-financial incentives to doctors who prescribe or patients who undergo aggressive treatments.
Limited time allotments for RCTs can also provide insufficient information on beneficial or adverse effects of treatments. For example, it may take several years to determine the beneficial effects of relatively inexpensive treatments for RA patients and thereby decrease the rate of expensive elective surgeries.
Under these circumstances, observational studies using healthcare claims data can support clinical trials by providing a real-world picture of treatment effects. However, the key difficulty in observational studies is controlling for disease severity. Failure to control for disease severity can create a spurious association between treatment and outcome.
Since clinical variables are rarely available, investigators are using many proxy variables to control for disease severity. Flags for baseline complications or individual comorbidities, comorbidity indices (Charlson Comorbidity Index [CCI], Agency for Healthcare Research and Quality [AHRQ] Quality Indicators Comorbidity Index), Chronic Disease Score (CDS)Citation9–11, and baseline healthcare utilization and/or costs are common proxy variables used in outcomes research.
None of these variables, however, are disease-specific, and therefore fail to control for disease severity in RA. They do not control for the following factors specific to RA disease progression: presence of joint erosions, number of rheumatologist visits, pulmonary nodules, RA-related surgical history (ankle fusion, hip replacement, etc.), or RA-related therapies (disease-modifying anti-rheumatic drugs [DMARDs], biologic therapies, etc.).
Methods
We derived the severity index for rheumatoid arthritis (SIFRA, a proprietary algorithm of SIMR, Inc. [STATinMED Research]) using the US Department of Veterans Affairs, Veterans Health Administration (VHA) data, and a set of 34 RA-related indicators from a study by Cabral et al.Citation12. Applying the Delphi method to collect knowledge from an expert panel, three of the academic rheumatologists co-authoring the Cabral study provided 47 indicators to six board-certified, clinically active rheumatologists for assessment. This ‘Delphi panel’ was asked to review the list and rate the strength of relationship from 0 = no relationship to 6 = perfect relationship. Between each indicator and severity of RA, and by providing feedback from the mean scores of the others, each panel member was asked to reiterate their score before collaborating. The six panelists then gathered for a meeting to finalize their scores. The final 34 indicators and their associated scores are provided in .
Table 1. Final indicators and associated scores from Delphi panel of study by Cabral et al.Citation12.
Using the 34 indicators assessed by the Delphi panel and the VHA data, we examined the correlation of SIFRA scores with previously validated RA-based scores and compared their estimation power for healthcare outcomes. Healthcare outcomes were defined as total healthcare costs and utilization as well as RA-related healthcare costs and utilization. The latter was defined if the costs and utilization were on the claim where any of the diagnoses was RA.
In order to apply the indicators and their associated weights, we used data from the VHA, the largest integrated healthcare system in the US. The VHA provides care for more than 5 million veterans across the country annually, as well as ∼0.5 million other patients (i.e., employees, eligible dependents, and survivors of disabled veterans, etc.). Currently, the system includes 162 hospitals, 137 nursing homes, 43 domiciliaries, more than 850 community and facility-based clinics, 14,800 doctors, and 61,000 nurses.
Inpatient, outpatient, pharmacy, and laboratory information is available in the VHA dataset. Since laboratory data are not always available in claims data, we derived two forms of the severity score: with and without laboratory values. The study included VHA patients during the identification period from October 1, 2008 to September 30, 2009. With 1 year of baseline and 1 year of follow-up information, the overall study period was from October 1, 2007 through September 30, 2010.
Patients were required to be at least 18 years of age and have at least two RA diagnoses (International Classification of Diseases Ninth Revision Clinical Modification [ICD-9-CM] code 714.x) at least 60 days apart during the identification period. The first RA diagnosis date was designated as the index date. The SIFRA score was calculated during the 1-year pre-index period and outcome measures were calculated during the 1-year post-index period after RA diagnosis to identify the predictive effects of the SIFRA score.
Results
Twenty-five thousand and forty-two RA patients were identified, of which 1091 had missing laboratory claims. The SIFRA score, without requiring laboratory information, ranged between 0–160, with a mean value of 9.14, and a standard deviation (STD) of 8.77. As shown in , 5.60 (61.29%) of the mean was composed of clinical and functional status variables (number of rheumatologist visits), 3.30 (36.12%) of medications, 0.19 (2.10%) of extra-articular manifestations (pulmonary nodules, subcutaneous nodules, vasculitis ever, and Felty’s syndrome ever), and 0.05 (0.50%) of surgical history (cervical spine fusion, hand/foot joint replacement, foot joint/ankle/wrist fusion, and total hip/knee/elbow/shoulder replacement).
Table 2. SIFRA scores without laboratory distribution.
There were 23,951 RA patients with available laboratory values. The SIFRA score ranged from 0–160, with a mean value of 10.02, STD of 8.89, and median value of 9.1.
As shown in , 5.83 (58.16%) of the mean was composed of clinical and functional status, 3.39 (33.84%) of medications, and 0.56 (5.55%) of radiology and laboratory findings, including presence of rheumatoid factor (RF) ever, peak RF titer ever, peak erythrocyte sedimentation rate (ESR)/c-reactive protein (CRP) in the last year, presence of human leukocyte antigen (HLA) sub-type, presence of joint erosions, number of joint erosions, presence of joint space narrowing, C102 subluxation, and presence of cyclic citrullinated peptide (CCP) ever. In addition, 0.20 (1.97%) of the mean was composed of extra-articular manifestations, and 0.05 (0.48%) of surgical history.
Table 3. SIFRA scores with laboratory distribution.
Validity of the score
To assess the convergent validity of the score, we compared and validated our score with another severity score using a sub-set of the original 41 indicators. Ting et al.Citation13 developed a claims-based index for rheumatoid arthritis severity (CIRAS) from a previously validated medical records based index (RARBIS). In particular, CIRAS includes age, gender, inflammatory tests ordered, rehabilitation visits, rheumatoid factor tests, Felty’s syndrome, number of platelet counts ordered, number of chemistry platelets ordered, and number of rheumatologists visits.
SIFRA correlation results are illustrated in . Among the total study cohort, SIFRA with and without laboratory values were moderately correlated with the previously validated severity score, the CIRAS (r = 0.5252, 95% confidence interval [CI] 0.5162–0.5341 for SIFRA with no laboratory data and r = 0.5392, 95% CI 0.5302–0.5482 for SIFRA with laboratory data). In the sub-group analysis, we found statistically significant differences within age group and gender correlations between SIFRA and CIRAS.
Table 4. Spearman’s rank correlation of SIFRA score with previously validated severity score.
Association with healthcare outcomes
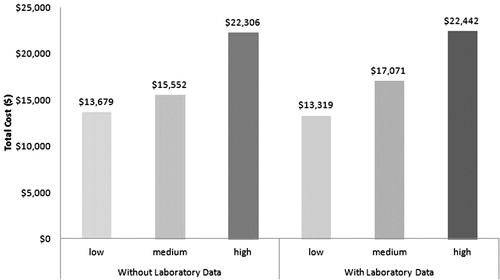
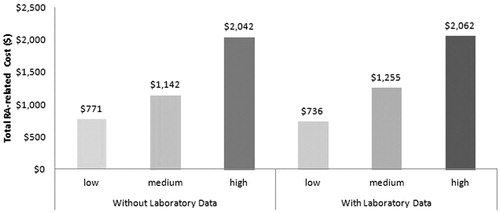
Total and RA-related healthcare costs were calculated for SIFRA scores with and without laboratory data during the 12-month follow-up period. shows the relationship between the SIFRA score terciles and the total all-cause healthcare costs. Histograms show that patients in the upper tercile of SIFRA incurred $9123 more all-cause healthcare costs and $1326 more RA-related healthcare costs than patients in the lower SIFRA tercile.
Figure 1. SIFRA scores and total healthcare costs.
As expected, patients in each successively higher tercile incurred more RA-related healthcare costs as well (). This pattern is evident both in the presence and absence of laboratory data, and suggests that SIFRA is a valid predictor for all-cause and RA-related total healthcare costs.
Figure 2. SIFRA dcores and RA-related healthcare costs.
We also analyzed SIFRA score terciles for the following cost sub-groups: inpatient, outpatient emergency room (ER), outpatient office, and pharmacy costs. Comparing the highest and lowest terciles for the healthcare cost sub-groups in patients without laboratory data, we found that patients with the highest SIFRA scores had higher costs in every sub-group. The same pattern was evident when comparing SIFRA scores to RA-related cost sub-groups in patients without laboratory data
Similar to patients without laboratory data, high SIFRA scores translated to higher healthcare costs incurred for all sub-groups in patients with laboratory data. The most dramatic cost differences between the highest and lowest SIFRA score terciles occurred with pharmacy ($6860 vs $1919, p < 0.001) and total costs ($22,442 vs $13,319, p < 0.001). RA-related sub-cost results among patients with laboratory data did not differ from patients without laboratory data. The trend of patients with the highest tercile of SIFRA scores spending more on inpatient ($213 vs $85, p < 0.001), office ($1848 vs $650, p < 0.001), and total costs ($2062 vs $736, p < 0.001) continued.
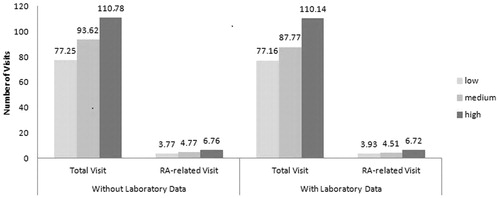
The trend of healthcare visits was similar to healthcare costs for SIFRA score terciles (). Higher SIFRA terciles resulted in higher total and RA-related healthcare utilization. Patients with and without laboratory data exhibited the same increasing utilization pattern.
Figure 3. SIFRA scores and healthcare visits.
Discussion
The high economic and clinical burden of RA calls for observational studies that require risk adjustment for severity. Current risk-adjustment tools such as comorbidity scores are suitable to measure comorbidity burden on outcomes but not RA severity. shows the correlation between SIFRA and commonly-used comorbidity scores in RA outcomes research. The correlations between SIFRA and CCI (0.1503 without laboratory data, 0.1135 with laboratory data), Elixhauser Index (ELIX) (0.105 without laboratory data, 0.079 with laboratory data), and CDS (0.255 without laboratory data, 0.239 with laboratory data) were low. Low correlations indicate that comorbidity measures can only be used to identify the comorbidity burden, but not as a proxy for disease severity.
Table 5. Correlation of SIFRA with commonly-used comorbidity scores in RA outcomes research.
Since there is a low correlation between existing comorbidity scores and SIFRA, both can be used in the same model. Controlling for both comorbidity and severity burden would increase the total variation explained in outcomes measures. In order to determine the contribution of SIFRA to the total variation explained in outcomes measures, we ran regression models and controlled for both SIFRA and each comorbidity index in addition to demographic factors such as age and gender. As evident from , the contribution of SIFRA to the models was remarkable. We compared the adjusted R2 to ensure the comparison was free of degrees of freedom change. The increase in adjusted R2 was as high as 156% when ELIX and SIFRA were used together relative to the model using only ELIX. For RA-related costs, models were more than 6-times (611%) superior in explaining the variation in outcomes.
Table 6. Additional percentage of variation explained by adding SIFRA to outcomes models.
In this paper, we developed the severity index for rheumatoid arthritis. Components of SIFRA include radiology and laboratory findings, clinical and functional status, extra-articular manifestations, surgical history, and medications. SIFRA scores demonstrated moderate correlation with a previously validated severity index score, CIRAS. The CIRAS score showed a high correlation with the medical records-based index, which had good construct validity and moderate convergent validity with Disease Activity Score (DAS) 28Citation14,Citation15. SIFRA was also shown to be a significant predictor of healthcare outcomes.
We applied SIFRA to the VHA patient population. If the SIFRA score can be found valid in other populations, it can be used as an important tool to control for disease severity in outcomes research models. We plan to assess the ability of the score in other commercial insurance claims files and national Medicaid and Medicare files.
Statistically omitting a variable that belongs to the population model provides biased and inconsistent estimates for every parameter in the model. Since disease severity is crucial in estimating treatment effects on outcomes, omitting this variable will provide biased estimates for treatment effects and misleading information. Since explanatory variables are limited in outcomes research, we need to use all information that can be derived from claims data. In this respect, SIFRA can be an important tool for researchers.
Limitations
The present study has some limitations. Although the VHA dataset contains uniquely integrated data, its beneficiaries are considered a vulnerable population. Research has shown that many veterans treated within the VHA system are older men who are economically disadvantaged and have a high disease burdenCitation16. Therefore, they may not represent typical RA patients.
Since some variables indicated by the Delphi panel cannot be derived from claims data (i.e., number of hours of morning stiffness, health assessment questionnaire score, etc.), SIFRA assumes those factors to be evenly distributed among the patient sample in the dataset. In addition, the validity score was indirectly based on DAS28, which measures disease activity rather than severity. However, there is no standard disease severity measure for RA.
Conclusion
Using national VHA data, we derived two severity scores for RA: with and without laboratory data. Both show they have a moderate correlation with previously validated severity scores. They are both also a significant determinant of future totals and RA-related healthcare costs for RA patients. Combined with existing comorbidity measures, SIFRA significantly increases the total variation explained in outcomes measures. Since omitting a variable (such as severity) belonging in a population model provides biased and inconsistent estimates, SIFRA can be an important methodological tool to control for severity in RA-related outcomes research.
Transparency
Declaration of funding
This study was not funded.
Declaration of financial/other interests
The authors have no relevant financial relationships to disclose. OB, JD, LX, AHD, and LW have disclosed that they are employees of STATinMED Research.
References
- Helmick CG, Felson DT, Lawrence RC, et al. Estimates of the prevalence of arthritis and other rheumatic conditions in the United States. Arthritis Rheum 2008;58:15-25
- Rasch E, Hirsch R, Paulose-Ram R, et al. Prevalence of rheumatoid arthritis in persons 60 years of age and older in the United States: effect of different methods of case classification. Arthritis Rheum 2003;48:917-26
- Hurst NP, Kind P, Ruta D, et al. Measuring health-related quality of life in rheumatoid arthritis: validity, responsiveness and reliability of euroqol (EQ-5D). Brit J Rheumatol 1997;36:551-9
- Woolf AD, Pfleger B. Burden of major musculoskeletal conditions. Bull World Health Organ 2003;81:646-56
- BioPortfolio. Study of people with rheumatoid arthritis who require joint surgery in the hand. http://www.bioportfolio.com/resources/trial/118386/Study-Of-People-With-Rheumatoid-Arthritis-Who-Require-Joint-Surgery-In-The.html. Accessed February 28, 2012
- Rossi P, Freeman H, Lipsey M. Evaluation: a systematic approach. Thousand Oaks, CA: Sage Productions, 1989
- Myasoedova E, Davis JM, Crowson CS, et al. Epidemiology of rheumatoid arthritis: rheumatoid arthritis and mortality. Curr Rheumatol Report 2010;12:379-85
- Mellemkjaer L, Linet MS, Gridley G, et al. Rheumatoid arthritis and cancer risk. Eur J Cancer 1996;32:1753-7
- Charlson M, Szatrowski TP, Peterson J, et al. Validation of a combined comorbidity index. J Clin Epidemiol 1994;47:1245-51
- de Groot V, Beckerman H, Lankhorst GJ, et al. How to measure comorbidity: a review of available methods. J Clin Epidemiol 2003;56:221-9
- Deyo RA, Cherkin DC, Ciol MA. Adapting a clinical comorbidity index for use with ICD-9-CM administrative databases. J Clin Epidemiol 1992;45:613-9
- Cabral D, Katz JN, Weinblatt ME, et al. Development and assessment of indicators of rheumatoid arthritis severity: results of a delphi panel. Arthritis Rheum 2005;53:61-6
- Ting G, Schneeweiss S, Scranton R, et al. Development of a healthcare utilisation data-based index for rheumatoid arthritis severity: a preliminary study. Arthritis Res Ther 2008;10:R95
- Ting G, Schneeweiss S, Katz JN, et al. Performance of a rheumatoid records-based index of severity. J Rheumatol 2005;32:1679-87
- Sato M, Schneeweiss S, Scranton R, et al. The validity of a rheumatoid arthritis medical records-based index of severity compared with the DAS28. Arthritis Res Ther 2006;8:R57
- Wilson NJ, Kizer KW. The VA healthcare system: an unrecognized national safety net. Health Affairs 1997;16:200-4