Abstract
Background and objectivess:
The cost effectiveness of pregabalin as an add-on to the standard treatment of Belgian patients with post-herpetic neuralgia (PHN) had been demonstrated in a previously published Markov model. The purpose of this study was to update that model with more recent cost data and clinical evidence, and reevaluate the cost effectiveness from the payer’s perspective of add-on pregabalin in a wider set of NeP conditions.
Methods:
The model, featuring 4-week cycles and a 1-year time horizon, consisted in four possible health states: mild, moderate or severe pain and withdrawn from therapy. Three versions of the model were developed, using transition probabilities derived from pain scores reported in three placebo-controlled studies. The two treatment arms were ‘usual care’ or ‘usual care + pregabalin’. Resource use and utility data were obtained from a chart review and unit costs from recent published data. The final outcome of the model was the incremental cost per quality-adjusted life-year (QALY) gained when adding pregabalin to standard care.
Results:
Based on 1000 simulations, two versions of the model showed that pregabalin was dominant respectively in 94.8% and 67.2% of the simulations, while the incremental cost per QALY was below €32,000/QALY in respectively 99.1% and 94.6% of the simulations. The third version did not show cost effectiveness, despite an incremental cost of only €300 after 1 year. However, in the corresponding study, patients seemed less responsive to GABA analogs, since 55% of them had failed to respond to gabapentin before study inclusion.
Limitations:
The studies upon which the model is based have a short follow-up time as compared to the model horizon. The endpoints of two studies were only provided at the aggregated level and do not necessarily reflect the real practice.
Conclusion:
Based on this analysis, it can be concluded that from a Belgium payer perspective pregabalin offers a slight increase in quality of life in the studied populations as compared to standard care. Pregabalin is cost effective in the majority of cases except in one published clinical study, despite a low incremental cost per year (€300).
Introduction
Neuropathic pain (NeP) may result from a wide range of clinical symptoms. Common NeP mechanisms include painful diabetic peripheral neuropathy (PDPN), post-herpetic neuralgia (PHN), trigeminal neuralgia (TN), complex regional pain syndrome (CRPS) and multiple sclerosisCitation1. It is generally chronic and disablingCitation2. The prevalence of neuropathic pain is estimated at 7–8% of the populationCitation3,Citation4.
The current treatment of peripheral neuropathic pain (PNeP) includes a wide range of drug and non-drug therapies. Guidelines from the European Federation of Neurological Societies (EFNS) considered that tricyclic antidepressants (TCAs), pregabalin, gabapentin, tramadol and opioids, duloxetine, venlafaxine, topical lidocaine and capsaicin patches (in restricted conditions) with level A evidence. The efficacy of combination like TCA-gabapentin and gabapentin-opioids was also acknowledgedCitation5. This variability in approach was confirmed in a cross-sectional assessment of the management of patients with neuropathic pain in BelgiumCitation6.
Pregabalin is currently approved for use in neuropathic pain in Belgium, including peripheral NeP conditions, such as the pain experienced by diabetic painful diabetic peripheral neuropathy (PDPN), post-herpetic neuralgia (PHN), phantom limb pain, post-traumatic neuralgia, cancer related NeP and post surgical NeP and central neuropathic pain, such as the pain experienced by patients with spinal cord injuryCitation7.
Annemans et al.Citation8 developed a cost-utility model comparing pregabalin as an add-on to ‘usual care’ versus ‘usual care’ alone in patients with PHN pain, where ‘usual care’ was defined as a mix of drug therapies excluding anti-epileptic drugs (AEDs). The structure of the model was based on a previous model published in 2002Citation9. The health outcomes of the 2008 model were expressed in quality-adjusted life years (QALYs). Clinical data had been obtained from a randomized trial reported by Van Seventer et al.Citation10 while cost and utility data had been obtained from an expert panelCitation6.
Since the publication by Van Seventer et al. and the model by Annemans, several other studies assessing the clinical efficacy of pregabalin as an add-on to usual treatment in different types of neuropathic pain were publishedCitation11–14. The purpose of this study was to adapt the model developed by Annemans to allow the evaluation of the cost effectiveness of add-on pregabalin versus usual care in the light of clinical evidence provided by the more recent studies in different neuropathic pain conditions (not only PHN).
Methods
Model structure
The model was an adaptation of a Markov model previously published by AnnemansCitation8. The Markov model applied cycles of 4 weeks and the time horizon was 1 year (i.e., 13 cycles) (). At the beginning of each cycle, patients could be in four possible health states: severe pain, moderate pain, mild pain, and withdrawn from therapy. There was no mortality specified in this model, since deceased patients were accounted for as ‘withdrawn from therapy’. The state ‘withdrawn from therapy’ was an absorbing state, meaning that patients could not leave this state. The definition of the other health states was based on the pain scores reported by the patient using an 11-points scoring instruments (from 0 to 10, with the highest score corresponding to maximum pain and 0 to no pain). Based upon a previous study a pain score below 4 was considered as ‘no-to-mild pain’, between 4 and 7 as moderate pain and from 7 on as severe painCitation15. Given that a minimum pain score of 4 at baseline was an inclusion criterion in all the clinical studiesCitation10–14, all the patients in the cohort started the simulation in the ‘moderate pain’ or ‘severe pain’ health states. At the end of each cycle, patients could move to a different health state according to the evolution of their pain score. If the patient did not achieve a level of mild pain after 12 weeks (= treatment failure), he/she was assumed to be non-responsive and to move to second-line therapy. The transition probabilities were calculated using the evolution of the patients in the different studiesCitation10–14.
Figure 1. Structure of the Markov model.
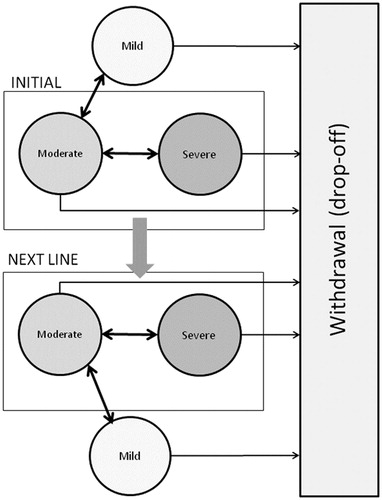
The purpose of the model was to define the value for money of adding pregabalin to ‘usual care’ (being defined as a mix of drug therapies). Therefore, the cohort was simulated following two treatment arms: either treated with ‘usual care only or pregabalin as add-on to ‘usual care’. The final outcome of the model was the incremental cost per quality-adjusted life-year (QALY) gained when adding pregabalin to standard care.
Sources for clinical data
The 2008 model developed by Annemans had used efficacy data from a study that included patients with PHN Van Seventer et al.Citation10. In that trial, double-blind study medication as pregabalin capsules, or matching placebo was administered orally (BID) for 12 weeks following a 1-week baseline phase. Patients were randomized to one of four treatment groups: placebo, 150, 300, or 300/600 mg/day pregabalin. Patients with a creatinine clearance rate (CLcr >30 and ≤60 mL/min (‘low’ CLcr) randomized to the 300/600 mg/day group received 300 mg/day; whereas, patients with a CLcr >60 mL/min (‘normal’ CLcr) randomized to the 300/600 mg/day group received 600 mg/day pregabalin. The concurrent use of different types of analgesics (narcotics, tricyclic antidepressants, SSRIs, non-opioid analgesics and NSAIDs) was allowed. Other anticonvulsants were not allowed. That study was considered as the reference study and used as first source of clinical efficacy data for the model.
Four recent clinical studies were identified as additional possible sources. Despite some differences in design and in populations, all the studies had in common that they evaluated pregabalin as an add-on to the standard treatment of neuropathic pain. However, one study (Xochilcal-Morales et al.)Citation11 was excluded as it was not comparative. A second study (Gilron et al.)Citation12 was rejected due to a different design: it consisted of a 4-week single-blind treatment phase, where pregabalin was administered to the whole sample (n = 256), followed by a 5-week double-blind phase where 77 of the remaining 157 patients were switched to placebo, while 80 remained on pregabalin treatment. The primary endpoint was the average pain score at the end of a 5-week double-blind period, so the study did not provide any baseline scores and the final pain scores were not comparable with the other study, since all patients benefited from the effect of pregabalin during the single-blind period.
The two remaining studies (Moon et al.Citation1Citation3; Van Seventer et al.Citation1Citation4) had a design comparable to the Van Seventer study, thus clinical data from these trials could be used in the model. The study by Moon et al.Citation13 followed a population of 241 Korean patients with a diagnosis of PDPN, PHN or post-traumatic neuralgia (PTN). This was a phase III, flexible-dose, 10-week, randomized, double-blind, placebo-controlled study with four phases: a 1-week screening period, a 4-week titration phase, a 4-week dose maintenance phase and a 1-week taper phase. Patients were randomized to one of five treatment groups: placebo, 150, 300, 450 or 600 mg/day pregabalin, with an average dose of 480 mg. A total 55% of the recruited patients had tried and failed to respond to gabapentin before study. Of the 240 patients who received study medication (either pregabalin or placebo, both with allowed co-medication), 200 completed the double-blind treatment phase. Even though the primary end-point was the difference in the week 8 least squares mean pain score between pregabalin and placebo, calculated using the average of the last seven available pain scores, clinical data comparable to those inputted in the first model (i.e., absolute mean pain score at baseline, week 4 and week 8 in both the placebo group and the ‘all dosages’ pregabalin group) could be obtained from the clinical data report (data on file). As an alternate scenario, the model was also run using the primary endpoint, since the study was powered for this.
In the flexible-dose study published by Van Seventer et al.Citation14, 254 patients with PTN pain were included. In all, 127 patients received pregabalin, and 127 patients received placebo. The trial consisted in a 4-week titration period followed by 4-week dose maintenance period. Doses of pregabalin used were 150 mg (30% at week 4 or the end of the titration period, 300 mg (46% at week 4) and 600 mg (24% at week 4), at a variable regimen. Medication was given in a BID schedule. The primary efficacy variable was the mean pain score in the intent-to-treat population at week 8, based on the last seven recorded daily pain scores, both in the placebo group and in the aggregated pregabalin group. The clinical data needed for the cost-effectiveness model, i.e. the average pain scores in both treatment arms at week 4 and week 8 among the patients still under treatment at that time, were obtained from the clinical study report (data on file). The characteristics of the populations from the three studies used in the model are shown in .
Table 1. Baseline characteristics from the three clinical trials retained as clinical source for the cost-effectiveness model.
shows the average pain scores collected from the three clinical trials and used to generate sets of transition probabilities.
Table 2. Clinical efficacy variables from the three trials.
Calculation of transition probabilities from the clinical efficacy variables
Starting from the absolute pain scores in the pregabalin and in the comparator arm at various time-points (every 4 weeks from baseline on, in order to match the cycles used in the model), a Monte CarloCitation16 simulation was run in order to calculate the proportion of patients being in each possible health state at each 4-weekly time-point (starting from baseline on) and for every dosage for which pain scores were available from the clinical studies. The simulation was based on the assumption that pain scores at each time-point fitted to a normal distribution, with the mean and the standard-deviation respectively equal to the average pain score and the standard deviation observed in the study sample at that time-point. An additional constraint was that no pain score could be lower than 4 at baseline (eligibility criterion in all the clinical studies). Finally, drop-off rates, i.e. the proportions of patients withdrawing from the study at each cycle, were also taken from the clinical studies and applied homogenously across health states.
Transition probabilities were derived from the proportions obtained from the Monte Carlo simulations assuming that patients would only transit between adjacent health states (i.e., no transition from mild to severe or from severe to mild). Transition probabilities between weeks 8 and 12 were assumed to be identical to the transitions between weeks 4 and 8 in the Moon et al.Citation13 and Van Seventer et al.Citation14 versions of the model (respectively, Model 2 and Model 3). In all three models, it was assumed that patients still in the moderate or severe health states after week 12 would be switched to a subsequent treatment line. A maximum effect should have been reached by then, unless the patient was non-responsive. Patients in the mild health state would remain on therapy, but the drop-off rates observed between week 8 and week 12 were applied until the end of the simulation horizon. Similarly, patients in the placebo arm pursue their ‘usual care’ but drop-off rates were also applied throughout the model. shows the transition probabilities applied in the three versions of the model.
Table 3. Transition probabilities in the model taking into account drop-offs.
Cost input
The resource use corresponding to the mild, moderate and severe health states were obtained from a chart review conducted in a sample of 88 Belgian patients with peripheral neuropathic pain recruited during a standard follow-up visit, with a neurologist, anesthesiologist or physiotherapy specialistCitation6. In order to serve as a possible benchmark against which a treatment with pregabalin could be compared, patients in that chart review were not allowed to be treated with other antiepileptics. Originally, 97 patients with peripheral NeP were included, of whom nine were taking other antiepileptics and were excluded from analysis. The study period was limited to 1 month as from study inclusion, during which participating patients had been reporting resource consumption on a daily basis in a diary. The monthly costs corresponding to the different health states in the cost-effectiveness model were obtained by multiplying the resources from the chart review with 2011 unit costs as available from public sources ().
Table 4. Cost per pain level in the observational one month study (unit costs 2011).
Patients withdrawing from treatment or switching to second-line therapy were assigned the cost corresponding to the severe health state.
The acquisition cost of pregabalin depends on the dose. shows the acquisition costs of the four different packages that are currently available on the Belgian market, from both the public and the INAMI perspective. Two packages are available for the 150-mg and the 300-mg doses (per 56 units and per 200 units); according to figures from the Belgian Pharmaco-Epidemiology Institute (IPhEB; data March 2011), for both dosages, the market shares are 55% and 45%, respectively for the 56 unit and 200-unit packages. These proportions were taken into account when calculating the acquisition cost of pregabalin in the model (). Since pregabalin is administered on a bi-daily regimen and caps are not divisible, patients receiving 150 mg are actually administered 75 mg BID. Similarly, patients receiving 300 mg are administered 150 mg BID and patients receiving 600 mg are administered 300 mg BID. When calculating the drug cost in Model 1, the fact that 28.9% of the patients in the 600 mg group actually use 300 mg due to their low CLcr level (30–60 mL/min) was taken into accountCitation8.
Table 5. Cost of available packages of pregabalin (€).
Table 6. Monthly and daily cost of pregabalin at various dosages.
In Model 1, the cost applied to the ‘all doses’ mix was calculated based on real-life proportions per dosage as provided by the Belgian Pharmaco-Epidemiology Institute, i.e. 36.5% of patients on 150 mg, 44.5% of patients on 300 mg and 19% of patients on 600 mg (May 2011). For Models 2 and 3, since the clinical outcomes were only reported at the aggregated level, the cost applied to the ‘all doses’ mix was calculated using the proportions of patients on each dosage at baseline in the corresponding study. In Moon et al.Citation2, the distribution after the titration phase was: 6.2% of patients on 150 mg, 21.9% on 300 mg, 16.4% on 450 mg, and 55.5% on 600 mg. In Van Seventer et al.Citation14, 30.2% of the patients were on 150 mg, 46.0% were on 300 mg and 23.8% were on 600 mg.
Utility input
The utility values associated to the different health states in the model () were drawn from the same source as the health states maintenance costsCitation5. In the Belgian cross-sectional study described above, patients were also asked to fill in a SF-36 questionnaire. Items from the questionnaires were converted into utilities using the SF-6D algorithmCitation17, a generic six-dimensional classification system for health states. Utilities are valued on a scale between 0 and 1, where 0 is the value for death and 1 the value for perfect health. The utility values decrease with an increasing pain severity, demonstrating the major impact of the pain on the NeP patients’ daily life.
Table 7. Utility values in the cross-sectional assessment of current therapy, per level of pain severity.
Model endpoint
By applying the transition probabilities, the costs per health state and the utility per health state as described above, the three versions of the model calculated the cumulative costs and utility over the full-year period (13 cycles) in both treatment arms and the incremental cost-effectiveness ratio (ICER, in €/QALY gained). All three models provided results for the aggregated pregabalin arm (all doses together); additionally, Model 1 calculated results per dose.
Sensitivity analysis
The key variables in the analysis were the cost and the utility per health state. It was observed that the average monthly maintenance cost increased with pain intensity, the more severe health states being clearly associated with higher maintenance costs.
As guidelines recently recommendCitation18, a probabilistic sensitivity analysis (PSA) was conducted in order to assess the robustness of the above reported results. In the PSA the cost data per pain level were assumed to follow a triangular distribution and the utility data per pain level were considered as beta-distributed. Clinical efficacy variables were not included in the sensitivity analysis since they were already obtained through a probabilistic method (Monte Carlo simulations).
Results
Results provided by the three versions of the model are shown in . Both Model 1 and 3 concluded that pregabalin was dominant (i.e. both cost savings and health benefit were obtained), confirming the conclusions from previous cost-effectiveness models (Annemans et al., 2008), and so did the version of Model 2 based on primary endpoints.
Table 8. Cost-effectiveness results.
shows the results of the probabilistic sensitivity analysis applied respectively to Model 1, Model 2 and Model 3, considering all doses of pregabalin together (pregabalin mix). In each graph, the 1000 points represent the results obtained with 1000 simulations. Points situated above the horizontal axis correspond to cases were pregabalin was shown to be more costly and points on the right side of the vertical axis correspond to cases were pregabalin provided health gains. Points in the right under quadrant correspond to cases were pregabalin was dominant (i.e., both cost-saving and gaining QALYs).
Figures 2–5 Distribution of the incremental cost effectiveness of add-on pregabalin(all doses) vs. usual care in the four versions of the model.
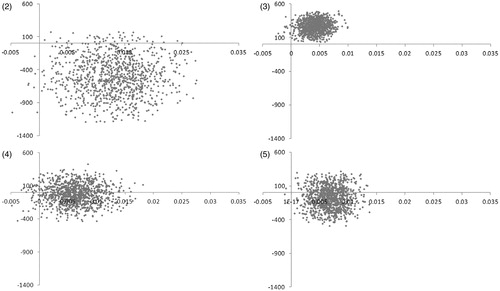
Model 1 concluded that pregabalin was cost effective in 99.1% of the simulations (using a reference threshold of 32,000 €/QALY), cost-saving in 95.5% of the simulations and dominant in 94.8% of the simulations. Model 2 reached cost effectiveness in 11.7% and 85.7% of the simulations respectively for the base case and the alternate version. The relatively weak result in the base case (as compared to the two other models) was due to the fact that, in the Moon study, the decrease in pain score reported at week 8 in the placebo arm was quite similar to the pregabalin arm, resulting in a very low incremental utility for the pregabalin arm. The average incremental cost of 1 year of treatment with add-on pregabalin, calculated on 1000 simulations, was below €300; however, since the average incremental utility was as low as 0.004, the ICER reached high values. Model 3 concluded that pregabalin was cost effective in 94.6% and dominant in 67.2% of the simulations.
Discussion
This paper presents the methodology and the results of the adaptation of a cost-utility model of pregabalin as an add-on option to the standard treatment of neuropathic pain. The comparator was the current usual care, including a wide range of drugs. The model horizon was 1 year and the results were presented from the Belgian healthcare payer’s perspective.
The model structure was taken from a previous cost-effectiveness model published by Annemans et al.Citation8. The clinical efficacy data inputted in the model were successively obtained from three recent clinical trials where pregabalin was compared with current usual care. Three versions of the model were adapted, corresponding to the three different sets of clinical data available. The three studies covered a wide scope of indications commonly defined as NeP: PHN, PDPN and PTN (including postsurgical neuralgia). The cost data were obtained from a sample of 88 Belgian PNeP patients who were followed during 1 month and were not treated with AEDs at the time of the observation, in order to match the characteristics of the population observed in the clinical trial described by Van Seventer et al.Citation10
There is currently no official guideline in Belgium regarding thresholds for cost effectiveness but some informal thresholds are often referred to: a threshold of €20,000 is commonly referred to in the Netherlands, while NICE usually considers £20,000–30,000 (≈€24,000–36,000) a ‘range of acceptable cost effectiveness’Citation19. In this study, we used a cost-effectiveness threshold of 32,000 €/QALY, which corresponds to the average GDP per capita in Belgium (as published by the Bureau Federal du Plan).
Two of the three studies showed that at any of the time-points, the percentage of patients in the mild and moderate health states was higher in the pregabalin arm than in the comparator arm. In the one study where the pregabalin cohort was further divided per dose (Van Seventer et al.Citation10), the same observation was made for each dose. Therefore, more patients in the pregabalin arm ended up in health states associated to lower costs and higher utilities. As a consequence, the two models based on clinical data from these two trials (Model 1 and Model 3) concluded that pregabalin was at least cost effective, if not dominant, in patients with PHN, PDPN and PTN pain.
The conclusions drawn from Model 2 were different, despite the fact that the indications were matching those observed in the other studies. This was due to the fact that, in the corresponding clinical trial (Moon et al.Citation13), the clinical benefit of pregabalin was less than what could be observed in other studies; the efficacy observed in the placebo arm was quite similar to the effect observed in the pregabalin arm, thus resulting in a small incremental utility associated to patients in the pregabalin arm. Even though the additional cost in the pregabalin arm after 1 year was less than €300, the extremely low incremental utility resulted in an ICER that was higher than the reference threshold of 32,000 €/QALY. Moreover, several specificities of that clinical trial have to be highlighted. First of all, 55% of the patients had failed to respond to gabapentin before study inclusion; that could indicate that at least a certain proportion of the population might have been less responsive to GABA analogs (the common group for gabapentin and pregabalin) though patients not responding to gabapentin can benefit from pregabalinCitation20. Secondly, co-medications were reported in 92.3% of the placebo patients, versus 79.6% of the pregabalin patients. Finally, the results may have been impacted by cultural factors conditioning attitude towards the reporting of pain scores; the study was conducted in an Asian population (South Korea) and patients in Asia tend to report less serious pain-related health problems than in other regionsCitation21.
More generally, comparisons between the three models should be made with caution. The three models were based upon data from three clinical trials in different types of peripheral NeP: PDPN (Moon et al.Citation13), PHN (Van Seventer et al.Citation10 and Moon et al.Citation13) and PTN (Van Seventer et al.Citation14). Whereas PDPN and PHN are associated with injury to the neural tissue, reflecting abnormal functioning of the pain system and considered as ‘pure’ NeP, PTN might have – besides the NeP component – a nociceptive pain component resulting from noxious stimuli and inflammation in otherwise intact tissueCitation22.
Except for the different types of peripheral NeP included and the prohibited use of AEDs in one clinical trial (Van Seventer et al.Citation10), the inclusion and exclusion criteria were similar for the three studies: patients needed to be 18 years of age, suffering from pain for at least 3 months and having a mean daily pain score of 4 or more; patients with abnormal blood cell counts, patients with unstable hepatic, respiratory, hematologic, cardiovascular and psychologic conditions (such as major depression), patients with drug and alcohol abuse were excluded from the studies.
A first limitation to this study lies in the short follow-up time, the longest follow-up available in the three studies being 12 weeks. Since the horizon of the model was a full year, an extrapolation had to be made to obtain transition probabilities from the fourth month onwards. In that extrapolation, patients who were still in the ‘severe’ health state after 3 months were switched to second line while the same transition probabilities as in the third cycle were applied until the end of the simulation for the other health states. A 15-month open-label study of pregabalin in neuropathic pain, with a recurrent ‘drug holiday period’ after every 3 months, demonstrated that the improvement in pain after the first 3-month treatment period was consistent throughout the five 3-month pregabalin treatment periods, demonstrating the sustained effect of pregabalin on pain relief beyond the 3-month time periodCitation20.
Another limitation results from the overlaps observed in the confidence intervals associated to the maintenance costs (between the moderate and the severe health states) and to the average utilities (between the mild and the moderate health states). However, there is a significant gain in utility from moving from severe to moderate and a significant reduction of cost when moving from moderate to mild. The combination of these two factors is enough to show the benefit of pregabalin.
The response to treatment varies a lot according to the dose. Therefore, the final ICER is expected to be sensitive to the proportions of patients in each dose group. A second limitation to this study comes from the fact that only one trial allowed an efficacy assessment per dose. In the version of the model based on that trial, the efficacy in the aggregated pregabalin arm (pooled doses) was calculated using proportions based on real-life figures provided by Pfizer (March 2011) REF. In the two other trials, endpoints were only provided at the aggregated level, i.e. pooled doses. In the corresponding models, proportions were taken directly from the studies and did not necessarily reflect the real practice in the Belgian settings. Nevertheless, it is impossible to estimate the result of a re-calculation of the ICER based on real-life proportions. Several other cost-effectiveness analyses of pregabalin versus gabapentin in NeP have been performed. A Canadian cost-effectiveness analysis in DPN and PHN concluded that a treatment with pregabalin was dominant versus a treatment with gabapentinCitation23. A Spanish cost-effectiveness analysis in DPN and PHN demonstrated that pregabalin was cost effective versus gabapentin (€20,535/QALY)Citation24, an Italian cost-effectiveness analysis resulted in an ICER of €468/QALYCitation25. In the HTA analysis performed by NICE, PHN pregabalin 150–600 mg/day was more cost effective than gabapentin 3600 and 1800 mg/day for PHN and pregabalin 300 and 600 mg/day was more cost effective than gabapentin 3600 mg/day in DPNCitation26.
Based on the analysis described here, add-on pregabalin offers a slight, but significant increase in quality of life in the studied populations as compared to standard care from a Belgium healthcare/payer perspective. Pregabalin can be considered cost effective in the majority of cases except in one published clinical study, despite a low incremental cost per year (€300).
Transparency
Declaration of funding
This study was sponsored by Pfizer. Pfizer Ltd provided funding to IMS HEOR Belgium to perform this study and to prepare the manuscript.
Declaration of financial/other relationship
Pierre Chevalier and Marc Lamotte were employees of IMS HEOR Belgium who were paid consultants to Pfizer Ltd in connection with the development of this manuscript. H.v.C and R.E. were employees of Pfizer Belgium at the time of the study. L.A. is an employee of Ghent and Brussels University who received financial support from Pfizer Ltd in connection with the development of this manuscript and for his contribution to this work. JME peer reviewers on this manuscript have no relevant financial relationships to disclose.
References
- Hans G, Masquelier E, De Cock P. The diagnosis and management of neuropathic pain in daily practice in Belgium. An observational study. BMC Public Health 2007;7:170 doi:10.1186/1471-2458-7-170
- Zelman DC, Dukes E, Brandenburg N, et al. Identification of cut-points for mild, moderate and severe pain due to diabetic peripheral neuropathy. Pain 2005;115:29-36
- Torrance N, Smith BH, Bennett MI, et al. The epidemiology of chronic pain of predominantly neuropathic origin. Results from a general population survey. J Pain, 2006;7:281-9
- Bouhassira D, Lantéri-Minet M, Attal N et al. Prevalence of chronic pain with neuropathic characteristics in the general population. Pain 2008;136:380-97
- Attal N, Cruccu G, Baron R, et al. EFNS guidelines on the pharmacological treatment of neuropathic pain: 2010 revision. Eur J Neurol 2010;17:1113-23
- Annemans L, et al. Prospective assessment of the health and economic burden of neuropathic pain. Value Health, 2004;7:726
- European Medicines Agency. European Public Assessment Report on pregabalin (EPAR). 10 April 2009. www.emea.europa.eu
- Annemans L, Caekelbergh K, Morlion B, et al. A cost-utility analysis of pregabalin in the management of peripheral neuropathic pain. Acta Clin Belg 2008;63:170-8
- Thompson D. Toward a pharmacoeconomic model of neuropathic pain. Clin J Pain 2002;18:366-72
- Van Seventer R, Feister HA, Young JP Jr, et al. Efficacy and tolerability of twice-daily pregabalin for treating pain and related sleep interference in postherpetic neuralgia: a 13-week randomized trial. Curr Res Med Opin 2006;22:375-84
- Xochilcal-Morales M, Castro EM, Guajardo-Rosas J, et al. A prospective open-label, multicentre study of pregabalin in the treatment of neuropathic pain in Latin America. Int J Clin Pract 2010;64:1301-9
- Gilron I, Wajsbrot D, Therrien F, et al. Pregabalin for peripheral neuropathic pain: a multicenter, enriched enrollment randomized withdrawal placebo-controlled trial. Clin J Pain 2011;27:185-93
- Moon D, Lee D, Lee S, et al. Efficacy and tolerability of pregabalin using a flexible optimized dose schedule in Korean patients with peripheral neuropathic pain: a 10-week, randomized, double-blind, placebo-controlled, multicenter study. Clin Ther 2010;32:2370-85
- Van Seventer R, Bach F, Toth C, et al. Pregabalin in the treatment of post-traumatic peripheral neuropathic pain: a randomized double-blind trial. Eur J Neurol 2010;17:1082-9
- Stacey BR, Dworkin RH, Murphy K, et al. Pregabalin in the treatment of refractory neuropathic pain: results of a 15-month open-label trial. Pain Med 2008;9;8;1202-8
- Metropolis N, Ulam S. The Monte Carlo Method. J Am Stat Assoc 1949;44:335-41
- Brazier J, Usherwood T, Harper R, et al. Deriving a preference-based single Index from the UK SF-36 Health Survey. J Clin Epidemiol 1998;51:1115-28
- Cleemput I, Van Wilder P, Vrijens F, et al. Richtlijnen voor farmacoeconomische evaluaties in België. Health Technology Assessment (HTA). Brussel: Federaal Kenniscentrum voor de Gezondheidszorg (KCE); 2008. KCE Reports 78A (D/2008/10.273/23)
- Towse A, Pritchard C, Devlin N. Cost-effectiveness thresholds: economic and ethical issues. King’s Funds/Office for Health Economics: London, 2002
- Toth C. Substitution of gabapentin therapy with pregabalin therapy in neuropathic pain due to peripheral neuropathy. Pain Med 2010;11:456-65
- Hoffman D, Sadosky A, Alvir J. Cross-national burden of painful diabetic neuropathy in Asia, Latin America, and the Middle East. Pain Pract 2008;9:35-42
- Aronoff GM. Evaluation and treatment of chronic pain. Pennsylvania: Williams & Wilkins, 1998
- Tarride J, Gordon A, Vera-Llonch M, et al. Cost-effectiveness of pregabalin for the management of neuropathic pain associated with diabetic peripheral neuropathy and post herpetic neuralgia. Clin Ther 2006;28;11;1922-34
- Rodriguez M, Diaz S, Vera-Llonch M, et al. Cost-effectiveness analysis of pregabalin versus gabapentin in the management of neuropathic pain due to diabetic polyneuropathy or post-herpetic neuralgia. Curr Med Res Opin 2007;23;10;2585-96
- Marchettini P, Da Deppo L, et al. Pregabalin versus gabapentin nel trattamento dei pazienti con neuropatia periferica: adattamento di un modello internazionale per la valutazione di costo/efficacia e costo/utilita all realta nazionale. Farmeconomia e percorsi therapeutici 2005;6:243-50
- NICE – National Institute for Health and Clinical Excellence – Clinical Guideline 96 - Neuropathic pain-The pharmacological management of neuropathic pain in adults in non-specialist settings - March 2010