Abstract
Background:
Analysis of EQ-5D data often focuses on changes in utility, ignoring valuable information from other parts of the instrument. The objective was to explore how the utility index, EQ-5D profile, and EQ-VAS captured change in clinical trials of mirabegron, a new treatment for overactive bladder (OAB).
Data:
Data were pooled from three phase III clinical trials that investigated the efficacy and safety of mirabegron vs placebo. Tolterodine ER 4 mg was included as an active control in one study: (1) placebo, mirabegron 50 mg and 100 mg, and tolterodine 4 mg ER; (2) placebo, mirabegron 50 mg and 100 mg; (3) placebo, and mirabegron 25 mg and 50 mg. Data were collected at baseline, week 4, 8, and 12.
Methods:
Analyses were performed on full analysis and modified intention to treat (ITT) data sets using UK utilities. Analysis controlled for relevant patient characteristics. Analysis of Covariance identified changes from baseline at each time point in utilities and EQ-VAS. Areas Under the Curve were estimated to summarize inter-temporal differences in effect. EQ-5D profile data were analysed using the Paretian Classification of Health Change.
Results:
In modified ITT analyses, mirabegron 50 mg was superior to tolterodine 4 mg in changes from baseline utilities after 12 weeks (p < 0.05); similarly, AUC results showed mirabegron 50 mg to be superior to tolterodine (p < 0.05) and placebo (p < 0.05) with the benefit already apparent at 4 weeks (p < 0.05). EQ-VAS more consistently indicated superior outcomes: all three mirabegron doses showed statistically significant greater effectiveness compared to tolterodine at 12 weeks. Individual EQ-5D dimensions and the overall profile showed no significant differences between study arms.
Conclusion:
Mirabegron showed quicker and superior improvement in HR-QoL compared to tolterodine 4 mg ER. A limitation of the study is that EQ-5D was a secondary outcome in the pivotal trials, which were not powered to measure differences on EQ-5D.
Keywords::
Introduction
New healthcare technologies face increasing pressure to demonstrate value for money. For the purposes of cost-effectiveness analysis, particularly where this involves the estimation of Quality Adjusted Life Years (QALYs) gained, it has become more common to include generic measures of health-related quality-of-life in clinical trials. The EuroQol five dimension questionnaire (EQ-5D) is a widely used instrument for this purpose—it is, for example, the patient reported outcome (PRO) measure preferred by the National Institute for Health and Clinical ExcellenceCitation1.
EQ-5D is a standardized simple, generic measure of health status developed by the EuroQol Group for use in clinical research, population health surveys, and economic evaluations, and is applicable to a wide range of health conditions and treatmentsCitation2. It consists of a simple descriptive system and a vertical visual analogue scale (VAS), or health thermometer, on which respondents assess their overall health. The descriptive system of the EQ-5D measures health-related quality-of-life (HRQoL) in five dimensions (mobility, self-care, usual activities, pain/discomfort, and anxiety/depression). In each dimension, respondents rate their health on one of three levels of severity (1 = no problems; 2 = some problems; and 3 = extreme problems or unable to). In this way, the respondent self-classifies themself in one of 243 unique health states defined by the instrument. Thus, the health state 11223 would represent a patient with no problems in the dimensions of mobility and self-care, some problems in the dimensions of usual activities and pain/discomfort, and extreme anxiety/depression.
Each EQ-5D health state can be converted into a single summary index (EQ-5D Index) by applying a formula that attaches values or preference weights to each level in each dimension. Index scores can then be calculated by deducting the appropriate weights from 1, which represents full health (i.e., state 11111). Respondents also rate their overall health status using the EQ-5D thermometer, a 0–100 hash-marked, vertical VAS on which 0 represents the worst imaginable health state and 100 represents the best possible imaginable health state.
Given the interest in estimating QALY gains, analysis of EQ-5D data from clinical trials tends to focus on utility-weighted EQ-5D profiles. Yet the data which are collected facilitate much richer analyses of the underlying changes in health-related quality-of-life. The instrument comprises both patients’ self-reported health on the EQ-5D dimensions (their profile) as well as patients’ overall assessment of their health on a visual analogue scale (the EQ-VAS). Understanding which aspects of health are changing can provide important, additional information into the effects of new treatments, which are missed by summarizing the overall changes by the index. Collapsing EQ-5D health profile data into a single value by means of weighting not only comes at the cost of information loss, but also introduces exogenous variation that can bias statistical inferenceCitation3. Further, given the possibility of differences between general public preferences and those of patientsCitation4,Citation5, analysis of changes on the EQ-VAS provides an important alternative way of summarizing the overall changes in health from the point of view of patients.
The aim of this paper is to demonstrate the insights possible from a range of statistical analyses of EQ-5D data collected in international clinical trials for mirabegronCitation6,Citation7, a treatment for overactive bladder. Our objectives are to examine the changes in utility suggested by those trial data; to investigate the underlying changes in EQ-5D profiles that drive those results; and the extent to which changes in utility are consistent with patients’ own views of their overall health on the EQ-VAS.
Objectives
The main objective of this pooled data analysis was to assess and estimate the effect of 12-week mirabegron 50 mg treatment vs placebo and tolterodine 4 mg Extended Release (ER) on overactive bladder (OAB) patients’ self-reported health, as measured by means of changes from baseline in utility weighted EQ-5D profiles and in patients’ self-rated health on the EQ-VAS, the number and percentage of patients reporting no, some, or extreme problems on each dimension of the EQ-5D profile, and the comparison of a patient’s EQ-5D profiles between each study time point and baseline evaluation, using the Paretian Classification of Health Change as defined in Devlin et al.Citation7. Secondary objectives included the comparison of the same variables between mirabegron 25 mg, 50 mg, and 100 mg arms with both placebo and tolterodine 4 mg ER arms at all time-points.
Overactive bladder syndrome
Overactive bladder (OAB) syndrome (also referred to as urgency syndrome or urgency-frequency syndrome), is a disorder of the filling phase of the bladder. It is characterized by symptoms of urinary urgency with associated frequency with or without incontinenceCitation8–11.
OAB is estimated to affect more than 400 million people worldwideCitation12. A community-based survey of 16,776 adult men and women ∼40 years of age in six European countries reported that 17% had symptoms of OABCitation13. Frequency was the most commonly reported symptom (85% of subjects) followed by urgency (54%) and urgency incontinence (36%). Similar prevalence rates have also been observed among adults in the USCitation14. The prevalence of OAB increases with age, affecting 30–40% of the population older than 75 years of ageCitation15,Citation16.
Over 60% of respondents indicated that their daily lives were adversely affected by OAB, and 60% had consulted a medical practitioner about their symptoms. The symptoms of OAB include frequent urination, urgency of urination, nocturia (urinating in the night), and urge incontinence. OAB may cause social, psychological, occupational, physical, and sexual problems, suggesting effects on a broad range of aspects of quality-of-lifeCitation17.
Treatment options include conservative management and pharmacotherapy consisting of muscarinic receptor antagonists, surgical intervention with botulinum toxin injection therapy, or neuromodulation in cases which fail conservative interventionCitation18.
The muscarinic receptor antagonists used in the treatment of OAB act via the nervous system to reduce muscle contraction. However, they are not selective for the bladder, but also affect the salivary gland, intestine, and eye, resulting in unwanted effects such as dry mouth, constipation, and blurred vision. While oral anti-muscarinic agents are the current pharmacological mainstay of treatment for OAB patientsCitation19 some patients have a sub-optimal response or experience the side-effects noted aboveCitation20,Citation21. In the absence of another class of therapeutic agent for the treatment of OAB symptoms, dissatisfied patients either persist with insufficient treatment or discontinue pharmacotherapy.
Mirabegron, a potent and selective beta 3 receptor agonist, is being developed for the treatment of OABCitation22,Citation23. It is the first representative of a new class of agents, and due to its new mode of action, the anti-muscarinic side-effects (dry mouth; constipation, and blurred vision) are not expected. Large-scale multi-centre phase 3 trials have recently been completed in Australia and Europe (178-CL-046, NCT00689104); USA and Canada (178-CL-047, NCT00662909); and US, Canada, and Europe (178-CL-074, NCT00912964). This paper reports analysis on data pooled from these trials, described in detail in the following section.
Methods
Data and study design
Data were available for analysis from three placebo-controlled clinical trials of mirabegron:
178-CL-046: A study conducted in Australia and Europe (Austria, Belarus, Belgium, Bulgaria, Czech Republic, Denmark, Finland, France, Germany, Greece, Hungary, Iceland, Ireland, Italy, Latvia, Lithuania, Netherlands, Norway, Poland, Portugal, Romania, Russian Federation, Slovakia, Spain, Sweden, Switzerland, Ukraine, and the UK). The trial used four treatment arms: placebo, mirabegron 50 mg, mirabegron 100 mg, and tolterodine 4 mg ER.
178-CL-047: A study conducted in the US and Canada, using three treatment arms: Placebo, mirabegron 50 mg, and mirabegron 100 mg; and
178-CL-074: A study conducted in the US, Canada, and Europe (Czech Republic, Denmark, Finland, Germany, Hungary, Norway, Poland, Portugal, Slovakia, Spain, Sweden, and Switzerland), using three treatment arms: placebo, mirabegron 25 mg, and mirabegron 50 mg.
Each of the three studies had a 12-week duration after the placebo run-in period of 2 weeks. Study designs were comparable across each of three clinical trials, making it possible to conduct analyses on pooled data.
In each study, patients were enrolled in a 2-week, single-blind, placebo run-in period. Upon completion of this run-in period, patients meeting inclusion criteria and not meeting exclusion criteria were randomly assigned in equal proportions to each of the relevant treatment arms. Randomization was accomplished using a computer-generated randomization scheme with stratification by country; allocation to treatment groups at each site was accomplished via an interactive response system. During the placebo run-in period, patients were blinded to the identity of the study drug. During the double-blind treatment and follow-up periods, the investigator, study site personnel, patients, sponsor, and the sponsor’s representatives were blinded to the identity of the randomized drug assignment.
All studies were conducted in accordance with the ethical principles that have their origin in the Declaration of Helsinki, Good Clinical Practice, International Conference on Harmonization Guidelines, and all applicable laws and regulations
Study population
The study population consisted of men and women aged ≥18 years with symptoms of OAB for ≥3 months. Following the run-in period, patients were selected for randomization if they met key inclusion criteria including an average micturition frequency of eight or more times per 24-h period and at least three episodes of urgency, with or without incontinence, during a 3-day micturition diary period. Key OAB-related exclusion criteria included significant stress incontinence, or mixed stress/urgency incontinence (where stress was the predominant factor) at screening, or an average total daily urine volume of >3000 ml as recorded in a 3-day micturition diary period. All patients provided written, informed consent to participate.
Outcome measures
The main outcome of interest in the present analysis was the EQ-5D, which measures health status in five dimensions: mobility, self-care, usual activities, pain and discomfort, and anxiety and depressionCitation24. Each dimension has three response levels: no problems, some problems, and either extreme problems (in the case of the pain/discomfort and anxiety/depression dimensions), unable to (in the case of self-care and usual activities), or confined to bed (in the case of mobility). The EQ-5D is accompanied by utility indices for a range of countries—these provide, for each of the 243 states defined by the descriptive system, weights on a scale anchored at 0 (dead) to 1 (full health), as required for the estimation of QALYs, based on the stated preferences of members of the general publicCitation25. In the present study, we used the UK MVH TTO tariffCitation26: there is no single value set that will be relevant to all the study sites included in the trial, or to all healthcare systems making decisions about the treatment of OAB. While there is a value set for EuropeCitation27, it is subject to some limitations, e.g., it was based on VAS valuations, re-scaled to 0 based on average rather than individual participants’ responses. We proceed using the UK value set on the grounds that the evidence is likely to be relevant to decision-making in the UK.
Respondents are also asked to rate their overall health status on a 0–100 hash-marked, vertical visual analogue scale (EQ-VAS) on which 0 represents the worst imaginable health state and 100 represents the best possible imaginable health state. EQ-5D was administered at baseline (W1), week 4 (W4); week 8 (W8), and week 12 (W12) for a total of four repeated observations per participant.
Other outcomes measures included in the trials were the Overactive Bladder QuestionnaireCitation28, the Patient Perception of Bladder Condition (PPBC)Citation29,Citation30, and the Work Productivity & Activity Impairment questionnaire for a Specific Health Problem (WPAI:SHP)Citation31.
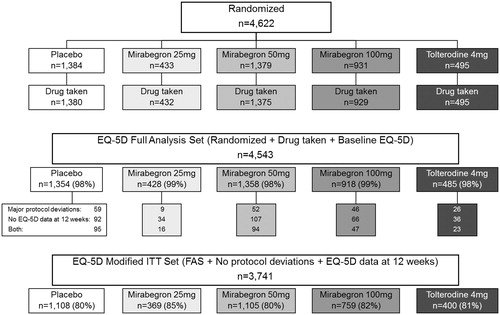
From the whole population of patients randomized in the three clinical trials (n = 4622), two specific analysis populations were selected for pooled data analyses: the EQ-5D Full Analysis Set (EQ-5D FAS) included all study patients (n = 4543) who were randomized, received at least one dose of double-blind study medication and completed the EQ-5D questionnaire at baseline and at least once post-baseline. The EQ-5D modified Intention to Treat (EQ-5D mod-ITT) analysis excluded from EQ-5D FAS 802 patients: (a) who presented serious deviations from the protocol or (b) for whom EQ-5D questionnaire data was not available at 12-weeks This modified Intention-to-Treat analysis set included 3741 patients.
The overall number of patients randomized to each treatment arm in the three clinical trials, and the number of patients included in each EQ-5D analysis set, are provided in .
Figure 1. Randomization of patients to treatment arms from pooled clinical trial data and description of the resulting EQ-5D Full Analysis Set (FAS) and Mod-ITT Set (Mod-ITT).
Statistical methods
All statistical analyses were carried out using both the EQ-5D FAS and EQ-5D mod-ITT analysis sets. However, given the purpose of this investigation, we considered the mod-ITT analysis set to be the most relevant, as it excludes patients with major protocol violation and lack of treatment compliance, thereby allowing more reliable estimates of treatment effects. More importantly, in the present instance, it included patients for whom EQ-5D data was available at baseline and 12 weeks. In all statistical analyses the significance level was set at 0.05 for a two-way test.
Where necessary, i.e., in intermediate visits in the mod-ITT set and at all visits post-baseline in the FAS group, missing evaluations of EQ-5D questionnaire items were imputed by carrying forward the last available observation.
Categorical variables were summarized using counts and percentages. For continuous variables, the n, mean, and standard deviation are reported. Treatment comparisons on categorical EQ-5D variables were carried out using Chi-square tests. One-way ANOVAs and Student’s t-tests (for pairwise comparisons) were used to compare changes from baseline in utility weighted profiles and EQ-VAS.
Patients’ baseline characteristics were analysed to assess their association with EQ-5D outcomes and detect imbalances among treatment groups. Chi-square tests were used for categorical variables, and Student’s t-tests or One-way ANOVAs for continuous parameters; the Mann-Whitney U-test or Kruskall-Wallis non-parametric ANOVA were used for non-normally distributed variables. Pearson’s or Spearman’s coefficients were used to estimate correlations between two continuous variables. Baseline characteristics which showed an association with both EQ-5D outcomes and treatment arm were selected as potential confounders in multivariate models fitted to estimate treatment effects.
Treatment effects for EQ-5D utilities and the EQ-VAS were estimated by fitting Analysis of Covariance (ANCOVA) models for changes from baseline to each time point. To take into account the possibility that some treatments may be faster acting than others, even when there is no difference in outcome at 12 weeks, we also explored the results by comparing the Areas Under the Curve (AUC) of changes from baseline in UK utility scores at 4, 8, and 12 weeks. These were computed by summing the areas corresponding to treatment effect between each consecutive study visit. AUC values were then analysed adjusting for potential confounders by means of an ANCOVA model.
Changes in EQ-5D health profiles from baseline were analysed using the Paretian Classification of Health Change (PCHC)Citation7. This uses the profile data between any two points in time to categorize the observed changes as either improved (better on at least one dimension and no worse on any other dimension), worsened (worse on at least on dimension and no better on any other dimension), the same (both profiles identical on all dimensions) or ‘mixed’ (some dimensions improved, some worsened). The effect of treatment on the percentage of patients reporting improved overall health status according to the PCHC was estimated by means of a Logistic Regression model, adjusting for baseline potential confounders.
Results
Patients’ baseline characteristics by treatment arm are reported in and . Some differences were observed among treatment groups on variables associated with EQ-5D outcomes. These baseline characteristics were: time from diagnosis with OAB; type of OAB; previous surgery for OAB; history of hyperlipidemia (high levels of lipids in the blood); activity impairment; OAB-1 Symptom Bother Scale and Total Score on the OAB-q; mean level of urgency and mean number of urgency episodes; patients’ perception of their bladder condition; and the EQ-VAS and EQ-5D utility-weighted profiles. These were considered as potential confounders of treatment effects and the relevant adjustments made in multivariate models.
Table 1. Patients’ baseline characteristics by treatment group (mod-ITT).
Table 2. Patients’ baseline EQ-5D profiles by treatment group (mod-ITT).
The adjusted treatment effects at each study time point (ANCOVA models and mod-ITT data set) are shown in .
Figure 2. EQ-5D questionnaire: Utility index (UK value sets), adjusted changes from baseline (LS means)–modified ITT.
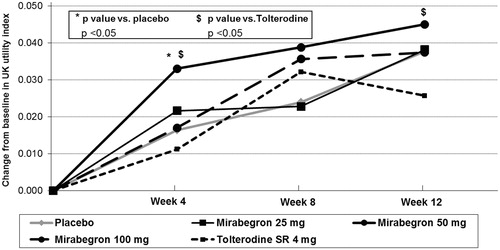
After adjusting for baseline confounding factors, mirabegron 50 mg was found to be superior to tolterodine 4 mg ER in terms of change from baseline utility score after 12 weeks (mean change of 0.045 vs 0.026, respectively; p ≤ 0.05). Significant differences vs placebo were observed at 4 weeks (mean change of 0.033 vs 0.016, respectively; p < 0.05) and at 8 weeks (mean change of 0.039 vs 0.024, respectively; p < 0.05). A similar trend was also observed at 12 weeks, although between-group differences were not statistically significant (mean change for mirabegron 50 mg and placebo: 0.045 vs 0.038, respectively; p = 0.30). No clinically relevant or statistically significant differences were observed between the other mirabegron dose groups and placebo or tolterodine.
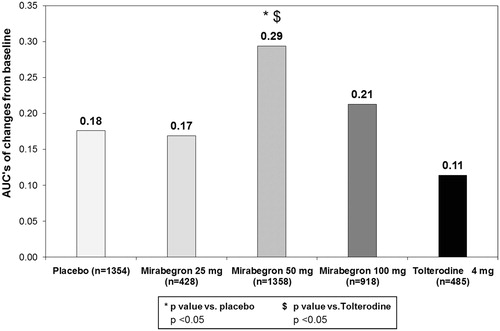
shows the results of analysing and comparing utility scores using the AUC approach. As can be seen, mirabegron 50 mg was found to be superior to both placebo and tolterodine 4 mg ER on overall AUC (adjusted AUCs of 0.294, 0.176 and 0.114, respectively; p < 0.05 vs placebo and p ≤ 0.05 vs tolterodine).
Figure 3. Changes from baseline in UK Index scores: adjusted AUC’s (LS means) on 12 weeks–modified ITT (based on the sub-set of patients with EQ-5D profiles worse than 11111 at baseline).
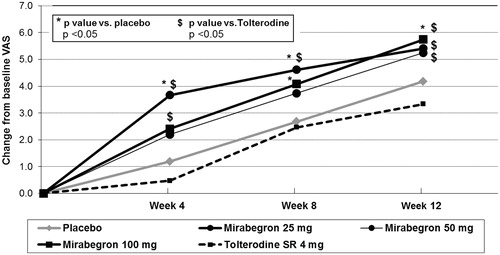
shows the results on the EQ-VAS. Adjusted estimates of change from baseline were significantly higher in the mirabegron 100 mg group with respect to placebo at 8 and 12 weeks (change at 12 weeks of +5.7 vs +4.2, respectively; p < 0.05). A similar trend was observed for the mirabegron 50 mg dose group, although the difference with placebo was not statistically significant. All mirabegron doses showed larger improvements on the EQ-VAS than tolterodine 4 mg ER at 12 weeks with changes of 5.7, 5.3, and 5.4 points on the EQ-VAS for mirabegron 100 mg, 50 mg, and 25 mg, respectively, compared to a change of 3.3 points for tolterodine 4 mg ER. The differences in the change scores between the three mirabegron doses and tolterodine were all statistically significant at p < 0.01 (mirabegron 100 mg) or p < 0.05 (mirabegron 50 mg and 25 mg).
Figure 4. EQ-VAS adjusted changes from baseline (LS means), modified ITT set.
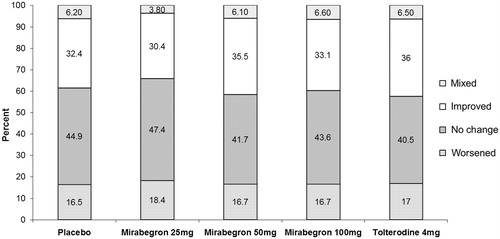
shows the results of analysing the EQ-5D profile data using the Pareto Classification of Health Change approach. After adjusting for baseline confounders, there was no statistical significance in the likelihood of patients reporting improved overall health status neither for mirabegron 50 mg compared to placebo (OR = 1.090; 95% CI = 0.889–1.336; p = 0.4066) nor for tolterodine 4 mg ER compared to placebo (OR = 1.046; 95% CI = 0.793–1.379; p = 0.7495).
Figure 5. Pareto classification of health change from baseline to health status at 12 weeks, modified ITT set.
Discussion
This study has examined in depth the use of the EQ-5D as an outcomes measure in patients treated with a new treatment (mirabegron) for OAB. Various doses of mirabegron were tested and compared with placebo and tolterodine, a widely-used treatment for OAB. The results of analysing data from the pooled trials included here showed mirabegron to be effective on the EQ-VAS and EQ Index. The EQ-VAS was most consistent in showing superior outcomes with mirabegron, particularly in comparison to tolterodine; all three doses showed statistically significant greater effectiveness compared to tolterodine at 12 weeks, while the 100 mg dose was also more effective than placebo at 12 weeks on the EQ-VAS. Although the EQ Index showed a statistically significant greater improvement for mirabegron 50 mg compared to tolterodine at 12 weeks in the mod-ITT analysis, it did not do so for the 25 mg and 100 mg doses, and it did not show a statistically significant advantage over placebo at 12 weeks on this measure. Interestingly, a more rapid effect for the study drug was noted on both the EQ-VAS and the EQ Index, with mirabegron showing a statistically significant greater effect at 4 weeks compared to placebo and tolterodine. This may be because, as opposed to tolterodine, mirabegron does not lead to an increase in the occurrence of bothersome anti-muscarinic side-effects, e.g., dry mouth. The occurrence of dry mouth during the first 4 weeks of treatment with tolterodine could offset the benefits on OAB symptoms and, therefore, explain this finding. Finally, it should be noted that the Tolterodine group showed poorer health on several parameters, including the PPBC, EQ-VAS, and Index Score, at baseline. This could have affected results; however, the differences were taken into account by adjusting for them in all analyses.
To some extent, the results of this study are in line with the findings of previous studies which used the EQ-5D in patients with OAB or other urinary conditions. For instance, Coyne et al.Citation32 reported a 0.05 difference in score on the EQ-5D utility index between patients with symptoms of OAB and controls without OAB symptoms. That between-group difference is similar to the overall level of change of 0.045 points seen in the mirabegron 50 mg group at 12 weeks. Coyne et al.Citation32 also reported a similar impact of OAB on HRQoL as assessed on the EQ Index, with cases scoring 0.85; this is similar to the average EQ-5D utility index score of 0.80 at baseline in all patients with OAB in our study. In patients with stress urinary incontinence (SUI), Mihaylova et al.Citation33 found that duloxetine alone and duloxetine in combination with conservative treatment for SUI were associated with incremental QALYs of ∼0.03 over a year compared with no treatment or with conservative treatment alone when the EQ-5D was used to calculate QALYs. In another study in patients with SUI, the authors found a change of 0.045 points on the utility index after 3 months of treatment with non-animal stabilized hyaluronic acid/dextranomer (NASHA/Dx) gelCitation34.
Although we did find that both the EQ-VAS and the EQ Index provided evidence that mirabegron was more effective than tolterodine and, to some extent, placebo, the effects were stronger on the EQ-VAS. Evidence for superior outcomes with mirabegron in comparison to placebo and tolterodine was also provided by an analysis of results obtained with disease-specific instruments, such as the Overactive Bladder Questionnaire or the Patient Perception of Bladder Condition, which were included in the same group of clinical trials analysed here (data not shown). The question then arises as to why the EQ Index does not reflect QoL gains with mirabegron to the same extent as the EQ-VAS. There may be several reasons for this. One is that the descriptive system (on which utility scores are based) does not adequately reflect aspects of HRQoL which are of particular relevance to OAB patients. Although, as far as we are aware, there has been no in-depth investigation of which aspects of HRQoL important to patients with OAB might be missing from the EQ-5D, a study in patients with SUI did seem to indicate that relevant aspects might be missing in those patients, including aspects related to problems caused when socializing or problems related to sleepCitation35. A similar study in OAB patients would be useful. The lower effectiveness recorded on the Index might also be due to the fact that the descriptive system has only three levels of severity, which might make it less sensitive to smaller variations in effectiveness. This may be especially true in conditions such as OAB, in which patients do not generally have very severe health problems, and will usually score 1 or 2 on most dimensions. This problem may be alleviated to some extent by use of the new 5-level version of the EQ-5DCitation36, which has the potential to detect smaller changes in health. The high ceiling effects observed in the present study might also blunt the instrument’s ability to distinguish between groups or to adequately reflect changes over time. However, the proportion of patients in state 11111 (no problems on any EQ-5D dimension) was similar in treatment and control groups, suggesting that any influence of the ceiling effect would likely be similar between the two groups. A re-analysis of the data in which all patients in state 11111 at baseline were excluded also showed that the pattern of statistically significant differences between groups was maintained, although the effect size of between-group differences over time increased. Finally, it should be remembered that utilities represent the preferences of the general public, whereas the EQ-VAS captures the patient’s overall assessment of their healthCitation5.
Another way in which mirabegron appeared to show advantages over placebo and tolterodine was in the rapidity of it effects, with statistically significant greater improvement shown by mirabegron 50 mg at 4 weeks on both the EQ-VAS and the EQ Index. These gains may not be adequately represented if we focus only on differences at 12 weeks. For that reason, we performed AUC analyses which aimed to capture how the more rapid effect would impact on QoL. The results of these additional analyses showed significant gains (an estimated change from baseline in the VAS, cumulated across all study time points, of 0.82) for mirabegron 50 mg compared to both placebo and tolterodine. On the other hand, the use of a new method (the PCHC approach) to analyse data on the descriptive system did not show any advantages for mirabegron at any dose. This new approach was intended to allow a fuller exploitation of responses on the descriptive system, without the requirement to use utility weights, and has been shown to be useful in analysis of outcomes from elective surgical proceduresCitation7. The fact that it did not discriminate between intervention and control groups in the present study may be related to limitations of the EQ-5D in detecting quality-of-life impacts noted above.
We also wondered how the adverse effects (AE) of treatment might impact on Index and EQ-VAS scores, and whether they might be responsible to some extent for the differences between treatments on these two measures, or whether they could contribute to the absence of more marked differences. We therefore analysed the incidence of the most relevant side-effects in all groups at all time points and found that tolterodine patients showed a higher incidence of dry-mouth at any time-point with respect to the rest of treatment groups, but there were no differences between treatments in the incidence of constipation. Furthermore, we found no clinically or statistically significant association between the presence of these AEs and the main outcomes (changes from baseline in UK scores or EQ-VAS) in any of the treatment groups.
Limitations of the present analysis include the fact that the three pivotal trials selected for the analysis were designed to assess mirabegron efficacy, not specifically to assess improvements in quality-of-life as measured by the EQ-5D. We focused on patients who had EQ-5D data available at baseline and 12 weeks and also excluded those with major protocol deviations. This was because our primary interest was in understanding mirabegron’s effects on HRQoL as measured by the EQ-5D; excluding patients with major protocol deviations allows a clearer picture of the intervention effect on the EQ-5D to emerge. When the same analysis was performed including all patients that took at least one dose of the study drug, we found very similar results on the EQ VAS, with all three mirabegron doses showing statistically significant better outcomes than tolterodine at 12 weeks, and two of them showing statistically significant better outcomes than placebo. Results on the EQ Index showed a generally similar trend to those reported here, especially as regards superiority over tolterodine, but the differences were not statistically significant. This may have been due to a ‘watering down’ of the effect by inclusion of those with protocol violations and/or by using the last observation carried forward approach to estimate EQ-5D scores at the final visit in patients for whom that data was not available.
Our analysis used the UK EQ-5D value set. As we noted in the Introduction, the choice of value set can in itself exert an effect on resultsCitation3, and different value sets will be relevant if evidence may be required in decision-making in healthcare systems other than the UK.
Conclusions
In conclusion, we found that mirabegron appeared to show a beneficial effect on HRQoL as measured by the EQ-5D Index and EQ-VAS in patients with OAB. The slightly weaker effect on the Index may be due to the EQ-5D lacking specific aspects of HRQoL which are most relevant to patients with OAB. Identifying those aspects and determining how they could be incorporated in future utility measurements of patients receiving treatment for OAB should be an area for future research.
Transparency
Declaration of funding
Funding for this study was provided in full by Astellas Pharmaceuticals Europe Limited.
Declaration of financial/other relationships
HZ, NJ, and IO are employees and shareholders of Astellas Pharmaceuticals Europe Lt; ND and CH are employees of the Office of Health Economics who received funding from Astellas Pharmaceuticals Europe Ltd to carry out the study; MP and HM are independent consultants who were funded from the Office of Health Economics. All authors contributed to the design of the study, statistical analysis plan, and writing of the manuscript, and MP and HM performed the statistical analyses.
Acknowledgements
We would like to thank Claire Green from the Office of Health Economics for her contribution in preparation of the manuscript.
References
- NICE. Guide to the methods of health technology appraisal. London: National Institute of Health and Clinical Excellence, 2008
- Brooks R. EuroQol: the current state of play. Health Policy 1996;37:53-72
- Parkin D, Rice N, Devlin N. Statistical analysis of EQ-5D profiles: does the use of value sets bias inference? Med Decis Making 2010;30:556-65
- Brazier J, Akehurst R, Brennan A, et al. Should patients have a greater role in valuing health states? Appl Health Econ Health Policy 2005;4:201-8
- Feng Y, Parkin D, Devlin N. An investigation of issues arising from the EQ-VAS in the NHS PROMs programme. OHE Research Paper 12/01. London: Office of Health Economics, 2011
- Nitti VW, Auerbach S, Martin N, et al. Results of a randomized phase III trial of mirabegron in patients with overactive bladder. J Urol 2012;189:1388-95
- Devlin NJ, Parkin D, Browne J. Patient-reported outcome measures in the NHS: new methods for analysing and reporting EQ-5D data. Health Econ 2010;19:886-905
- Wein AJ, Rovner ES. The overactive bladder: an overview for primary care health providers. Int J Fertil Womens Med 1999;44:56-66
- Abrams P, Cardozo L, Fall M, et al. The standardisation of terminology of lower urinary tract function: report from the Standardisation Sub-committee of the International Continence Society. Neurourol Urodyn 2002;21:167-78
- Chapple CR. Alpha-adrenergic blocking drugs in bladder outflow obstruction: what potential has alpha 1-adrenoceptor selectivity? Br J Urol 1995;76(1 Suppl):47-55
- Haylen BT, de RD, Freeman RM, et al. An International Urogynecological Association (IUGA)/International Continence Society (ICS) joint report on the terminology for female pelvic floor dysfunction. Neurourol Urodyn 2010;29:4-20
- Irwin DE, Kopp ZS, Agatep B, et al. Worldwide prevalence estimates of lower urinary tract symptoms, overactive bladder, urinary incontinence and bladder outlet obstruction. BJU Int 2011;108:1132-8
- Milsom I, Abrams P, Cardozo L, et al. How widespread are the symptoms of an overactive bladder and how are they managed? A population-based prevalence study. BJU Int 2001;87:760-6
- Stewart WF, Van Rooyen JB, Cundiff GW, et al. Prevalence and burden of overactive bladder in the United States. World J Urol 2003;20:327-36
- Irwin DE, Milsom I, Hunskaar S, et al. Population-based survey of urinary incontinence, overactive bladder, and other lower urinary tract symptoms in five countries: results of the EPIC study. Eur Urol 2006;50:1306-14
- Coyne KS, Sexton CC, Thompson CL, et al. The prevalence of lower urinary tract symptoms (LUTS) in the USA, the UK and Sweden: results from the Epidemiology of LUTS (EpiLUTS) study. BJU Int 2009;104:352-60
- Basra R, Kelleher C. Disease burden of overactive bladder: quality-of-life data assessed using ICI-recommended instruments. Pharmacoeconomics 2007;25:129-42
- Mangera A, Andersson KE, Apostolidis A, et al. Contemporary management of lower urinary tract disease with botulinum toxin A: a systematic review of botox (onabotulinumtoxinA) and dysport (abobotulinumtoxinA). Eur Urol 2011;60:784-95
- Yamaguchi O, Nishizawa O, Takeda M, et al. Clinical guidelines for overactive bladder. Int J Urol 2009;16:126-42
- D'Souza AO, Smith MJ, Miller LA, et al. Persistence, adherence, and switch rates among extended-release and immediate-release overactive bladder medications in a regional managed care plan. J Manag Care Pharm 2008;14:291-301
- Benner JS, Nichol MB, Rovner ES, et al. Patient-reported reasons for discontinuing overactive bladder medication. BJU Int 2010;105:1276-82
- Chapple CR, Yamaguchi O, Ridder A, et al. Clinical proof of concept study (blossom) shows novel beta 3 adrenoceptor agonist YM178 is effective and well tolerated in the treatment of symptoms of overactive bladder. Journal Eur Urol Suppl 2008;7:674
- Chapple CR, Wyndaele JJ, Van Kerrebroeck P, et al. 774 Dose-ranging study of once-daily mirabegron (YM178), a novel selective beta-adrenoceptor agonist, in patients with overactive bladder (OAB). Eur Urol Suppl 2010;9:249
- Kind P, Brooks R, Rabin R. EQ-5D concepts and methods: a developmental history. The Netherlands: Springer, 2005
- Szende A, Oppe M, Devlin N. EQ-5D value sets: inventory, comparative review and user guide. 2nd ed. The Netherlands: Springer, 2006
- Dolan P. Modeling valuations for EuroQol health states. Med Care 1997;35:1095-108
- Greiner W, Weijnen T, Nieuwenhuizen M, et al. A single European currency for EQ-5D health states. Results from a six-country study. Eur J Health Econ 2003;4:222-31
- Coyne KS, Revicki D, Hunt T, et al. Psychometric validation of an overactive bladder symptom and health-related quality of life questionnaire: the OAB-q. Qual Life Res 2002;11:563-74
- Matza LS, Thompson CL, Krasnow J, et al. Test-retest reliability of four questionnaires for patients with overactive bladder: the overactive bladder questionnaire (OAB-q), patient perception of bladder condition (PPBC), urgency questionnaire (UQ), and the primary OAB symptom questionnaire (POSQ). Neurourol Urodyn 2005;24:215-25
- Coyne KS, Matza LS, Kopp Z, et al. The validation of the patient perception of bladder condition (PPBC): a single-item global measure for patients with overactive bladder. Eur Urol 2006;49:1079-86
- Reilly MC, Zbrozek AS, Dukes EM. The validity and reproducibility of a work productivity and activity impairment instrument. Pharmacoeconomics 1993;4:353-65
- Coyne KS, Sexton CC, Irwin DE, et al. The impact of overactive bladder, incontinence and other lower urinary tract symptoms on quality of life, work productivity, sexuality and emotional well-being in men and women: results from the EPIC study. BJU Int 2008;101:1388-95
- Mihaylova B, Pitman R, Tincello D, et al. Cost-effectiveness of duloxetine: the Stress Urinary Incontinence Treatment (SUIT) study. Value Health 2010;13:565-72
- Kobelt G, Fianu-Jonasson A. Treatment of stress urinary incontinence with non-animal stabilised hyaluronic acid/dextranomer (NASHA/Dx) gel: an analysis of utility and cost. Clin Drug Investig 2006;26:583-91
- Ternent L, Vale L, Buckley B, et al. Measuring outcomes of importance to women with stress urinary incontinence. BJOG 2009;116:719-25
- Herdman M, Gudex C, Lloyd A, et al. Development and preliminary testing of the new five-level version of EQ-5D (EQ-5D-5L). Qual Life Res 2011;20:1727-36